Research Article - (2019) Volume 10, Issue 4
Aim of the work: To identify the relationship between serum concentration of 7,8-dihydro-2-deoxyguanosine (8-OHdG) and different stages of Albumin Excretion Rate (AER), as marker of nephropathy in Egyptian patients with Type 1 Diabetes(T1D).
Subjects and methodology: Total 65 volunteers were distributed in 4 groups: group 1: included 20 healthy subjects as control, group 2: 15 T1D patients with AER<30 mg/g creatinine, group 3: 15 T1D patients with (300
Results: Significant increase in urea and creatinine in G3 and G4 with control with a p value<0.005. Also increase in 8-OHdG and MDA with a p value<0.005 in G2, G3 and G4 compared with control.
Diabetic nephropathy; 8-OHdG biomarker; ROS
Diabetic Nephropathy (DN) is one of diabetes complications; it may lead to renal failure and death rate raised in diabetic patients [1]. Uncontrolled blood sugar (chronic hyperglycemia), contributes to vascular complications and podocyte injury. Recent researches focus on studying the role of Reactive Oxygen Species (ROS), hypoxia and glomerular endothelial injury, in the progression of DN [2]. ROS interact with DNA and causes damage, this damage include single and double-stranded DNA breaks, deletions and modifications of nucleoside. Guanine is more susceptible to oxidation by ROS. 8-OHdG produced by oxidation of hydroxyl radical (OH•) to carbon in position 8 in amino acid guanine. 8-OHdG reflects general cellular oxidative stress, so it may consider marker of DNA damage in diabetic patients [3]. The most characteristic marker of DN is albuminuria, which is associated with renal disease progression. However, renal function declines in about one-third of the patients before the occurrence of albuminuria, which makes it inadequate to detect albuminuria alone to monitor the incidence and progression of DN [4]. Therefore, scientists look for laboratory biomarkers, more specific and appear before occurrence of microalbuminuria [5].
This study included 65 human volunteers, they were classified as follow: group 1: control group included 20 healthy subjects, group 2 included 15 patients with normoalbuminuria (AER<30 mg / g), group 3 included 15 patients with microalbuminuria (30 mg / 24 h>AER<300 mg / g) and group 4 included 15 patients with macroalbuminuria (AER ≥ 300 mg /g) (Figure 1). The mean ages of all volunteers were (30 ± 5) years old. All patients were selected from the outpatient clinics in National Institute for Diabetes and Endocrinology (NIDE), Cairo, Egypt and Shebin El-kom Teaching Hospital, Menofia, Egypt. The diabetic patients treated with insulin with a dose adjusted according to the state of each patient. A detailed clinical history had been obtained after biochemical investigation to exclude any disease other than type 1 diabetes according to C-peptide results (Figure 2). The purpose and nature of the study were explained to all subjects and written voluntary consents were obtained before their participation. Approval was taken from the research committee of General Organization of Teaching Hospitals and Institutions (GOTHI). Blood samples were collected after 6 to 8 h fasting, blood was centrifuged at 3000 rpm for 10 min at 4°C, serum samples were rapidly separated until the measurements of 8-OHdG using Biodiagnostic Company kits, Egypt ELISA kit (Cloud-Clone Corp). Estimation of plasma glucose fasting was done by the glucose oxidase method [6]. Urea and Creatinine levels were determined according to the method of Patton & Crouch [7] and Houot [8] respectively. Malondialdhyde (MDA) level, marker of lipid peroxidation was determined according to the method of Satoh, 1978 [9] using Biodiagnostic Company kits, Egypt. C-Peptide estimated according to the ELISA method (DRG C-peptide kit Germany Frauenbergstraße). Another part of blood was taken on EDTA for estimation of HbA1c (immuno turbidemetry) (Spectrum-diagnostics kits). Fresh morning urine samples were obtained centrifuged at 1500 rpm for 10 min to remove cells and salts. Urine samples used for measurement of microalbumin/creatinine concentrations, microalbumin and creatinine in urine according to (Spectrum-diagnostics kits from Egyptian company for Biotechnology), according to Jaffs kinetic method [10].
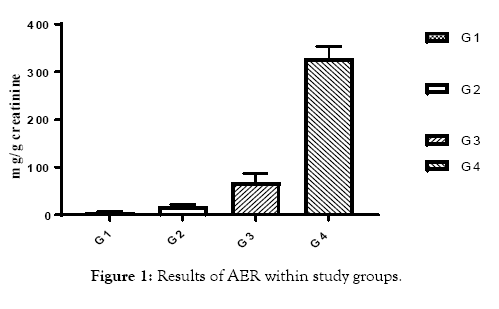
Figure 1: Results of AER within study groups.
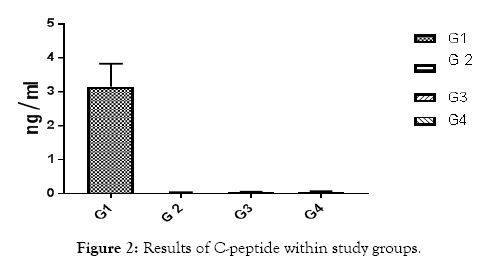
Figure 2: Results of C-peptide within study groups.
Statistical analysis
It was performed using the one-way analysis of variance (ANOVA), Tukey's Multiple Comparison Test using IBM SPSS software package version 20.0. (Armonk, NY: IBM Corp). Data were expressed as mean ± Standard deviation, p<0.05 was considered statistically significant.
All of subjects had near by the same age. Type 1 diabetic patients were selected and differentiated according to C-peptide and AER results (Table 1 and Figures 1 and 2). Results of RBG and HbA1c revealed a highly significant increase in diabetic biomarkers (RBG and HbA1c) in type 1 diabetic patients groups (G2, G3 and G4) compared with non-diabetic group 1 (control), with p value<0.05. Also, significant increase diabetic groups with albuminuria (G3 & G4) in RBG and HbA1c compared with normoalbuminuria group (G2), (p value<0.05). Comparison between macroalbuminuria (G4) and microalbuminuria (G3) showed significant increase in macroalbuminuria (G4) with p value<0.05, this significance only in HbA1c. There is significant increase in kidney functions (urea and creatinine) in diabetic patients with normoalbuminuria (G2) compared with control (G1) and between macroalbuminuria (G4) compared to microalbuminuria (G3) (p value<0.05), but highly significant increase in both urea and creatinine in diabetic groups with microalbuminuria (G3) and macroalbuminuria (G4) when compared with control (G1) (p value<0.05). Highly significant increase in all diabetic groups (G2, G3 and G4) in malondialdhyde (MDA) results compared with control group (G1) and between macroalbuminuria (G4) compared with normoalbuminuria (G2) and significant increase between microalbuminuria (G2) and normoalbuminuria (G3) (p value<0.05). No significant in MDA within diabetic nephropathy groups (G3 and G4). Results of 8-OHdG showed highly significant increase in diabetic groups with albuminuria (G3 and G4) compared with control group (G1) and in macroalbuminuria (G4) compared with microalbuminuria (G3). Also, highly significant increase in diabetic groups with albuminuria (G3 and G4) compared with normoalbuminuria (G2), which has significant increase compared with control group (G1) (p value<0.05). (Table 1 and Figures 3-7). According to (Tables 2-6), there is no significant correlation between AER and 8-OHdG in (control group, diabetic patients with normoalbuminuria group, diabetic patients with microalbuminuria group and diabetic patients with macroalbuminuria group).
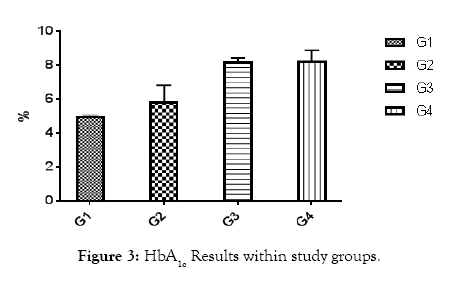
Figure 3: HbA1c Results within study groups.
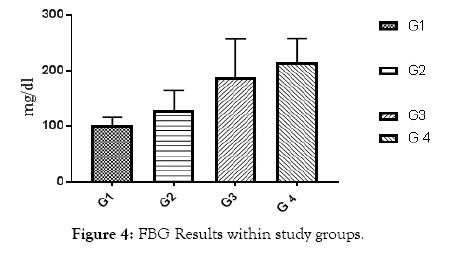
Figure 4: FBG Results within study groups.
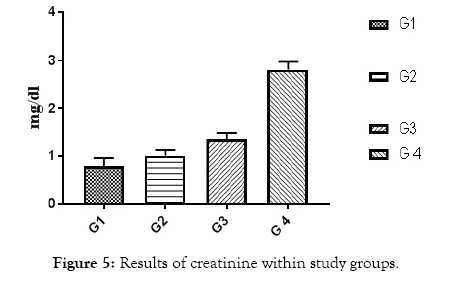
Figure 5: Results of creatinine within study groups.
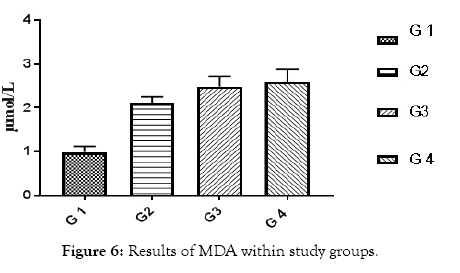
Figure 6: Results of MDA within study groups.
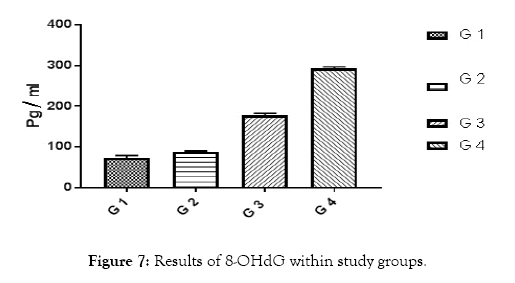
Figure 7: Results of 8-OHdG within study groups.
| Variables | Group (1) (Control) (Mean ± SD) N=20 | Group (2) *" (Mean ± SD) N=15 | Group (3)*# " (Mean ± SD) N=15 | Group(4)*#" (Mean ± SD) N=15 | ANOVA one way by SPSS p value |
|---|---|---|---|---|---|
| Age | 25 ± 5 | 25 ± 5 | 25 ± 10 | 25 ± 10 | NS |
| C-peptide ng/mL | 3.1 ± 0.4 | 0.043 ± 0.03 | 0.045 ± 0.03 | 0.045 ± 0.03 | <0.001 |
| AER (mg/g creatinine) | 5.3 ± 7.7 | 17 ± 4.59 | 70.6 ± 18.1 | 317.9 ± 23.4 | <0.001 |
| HbA1c% | 4.99 ± 0.09 | 5.9 ± 0.9 | 8.22 ± 0.22 | 8.28 ± 0.581 | <0.001 |
| FBG (mg/dL) | 90.2 ± 9.2 | 121 ± 31 | 181.2 ± 60.77 | 191.3 ± 33.1 | <0.001 |
| Urea (mg/dL) | 24.1 ± 2.1 | 33.1 ± 2.21 | 51.2 ± 2.02 | 60.2 ± 2.5 | <0.001 |
| Creat (mg/dL) | 0.79 ± 0.05 | 0.9 ± 0.1 | 1.87 ± 0.09 | 3.1 ± 0.2 | <0.001 |
| MDA (µmol /L | 0.99 ± 0.05 | 1.90 ± 0.06 | 2.43 ± 0.1 | 2.9 ± 0.2 | <0.001 |
| 8-OHdG (Pg/mL) | 88.5 ± 1.69 | 72.5 ± 2.01 | 177.1 ± 5.39 | 293 ± 3.66 | <0.001 |
*Comparsion of groups with Control (Group 1).
"Comparsion between microalbuminuria (Group3) and macroalbuminuria (Group 4).
#Comparsion of groups with normoalbuminuria (Group 2).
Table 1: Results of C-peptide, AER, FBG, HbA1c, urea, creat, MDA and 8-OHdG.
| AER (mg ̷ g) | 8-OHdG (pg ̷ mL) | ||
|---|---|---|---|
| AER (mg/g) | Pearson Correlation | 1 | -0.577 |
| Sig. (2-tailed) | 0.087 | ||
| N | 20 | 20 | |
| 8-OHdG (pg /mL) | Pearson Correlation | -0.577 | 1 |
| Sig. (2-tailed) | 0.087 | ||
| N | 20 | 20 |
r: Pearson coefficient
*: Statistically significant at p ≤ 0.05.
No significant correlation between AER and 8-OHdG in group 1 control.
Table 2: Correlation studies in group-1 (Healthy control).
| AER (mg ̷ g) | 8-OHdG (pg ̷ mL) | ||
|---|---|---|---|
| AER (mg ̷ g) | Pearson Correlation | 1 | 0.503 |
| Sig. (2-tailed) | 0.139 | ||
| N | 15 | 15 | |
| 8-OHdG (pg ̷ mL) | Pearson Correlation | 0.503 | 1 |
| Sig. (2-tailed) | 0.139 | ||
| N | 15 | 15 |
r: Pearson coefficient
*: Statistically significant at p ≤ 0.05
No significant correlation between AER and 8-OHdG in group 2 (Normoalbuminuria).
Table 3: Correlation studies in group-2 (Normoalbuminuria).
| AER (mg ̷ g) | 8-OHdG (pg ̷ mL) | ||
|---|---|---|---|
| AER (mg ̷ g) | Pearson Correlation | 1 | 0.018 |
| Sig. (2-tailed) | 0.95 | ||
| N | 15 | 15 | |
| 8-OHdG (pg ̷ mL) | Pearson Correlation | 0.018 | 1 |
| Sig. (2-tailed) | 0.95 | ||
| N | 15 | 15 |
r: Pearson coefficient
*: Statistically significant at p ≤ 0.05.
No significant correlation between AER and 8-OHdG in group 3 (microalbuminuria).
Table 4: Correlation studies in group-3 (Microalbuminuria).
| AER (mg ̷ g) | 8-OHdG (pg ̷ mL) | ||
|---|---|---|---|
| AER (mg ̷ g) | Pearson Correlation | 1 | 0.331 |
| Sig. (2-tailed) | 0.229 | ||
| N | 15 | 15 | |
| 8-OHdG (pg ̷ mL) | Pearson Correlation | 0.331 | 1 |
| Sig. (2-tailed) | 0.229 | ||
| N | 15 | 15 |
r: Pearson coefficient
*: Statistically significant at p ≤ 0.05
No significant correlation between AER and 8-OHdG in group 3 (microalbuminuria).
Table 5: Correlation studies in group-4 (Macroalbuminuria).
| AER (mg ̷ g) | 8-OHdG (pg ̷ mL) | ||
|---|---|---|---|
| AER (mg ̷ g) | Pearson Correlation | 1 | 0.987* |
| Sig. (2-tailed) | < 0.001 | ||
| N | 65 | 65 | |
| 8-OHdG (pg ̷ mL) | Pearson Correlation | 0.987* | 1 |
| Sig. (2-tailed) | <0.001 | ||
| N | 65 | 65 |
r: Pearson coefficient
*: Statistically significant at p ≤ 0.05.
Significant Positive correlation between AER and 8-OHdG in study groups.
Table 6: Correlation between AER and 8-OHdG in study groups.
Increased in fasting blood glucose and glycated heamoglobin in all diabetic groups’ means uncontrolled blood sugar. Increased urea and creatinine results means impairment in kidney functions, this is due to nephropathy in agreement of AER, by which we differentiate diabetic groups into sub groups , and these results are in accordance with Fujita et al. [11], they noticed that the creatinine clearance rate was slightly reduced in the diabetic group with nephropathy than without nephropathy. Highly significant increase in all diabetic groups (G2, G3 and G4) in Malondialdhyde (MDA) results compared with control group (G1) and between macroalbuminuria (G4) compared with normoalbuminuria (G2) and significant increase between microalbuminuria (G2) and normoalbuminuria (G3) (p value<0.05)., this indicates occurrence of lipid peroxidation due to oxidative stress and increase Reactive Oxygen Species (ROS) production due to hyperglycemia. Results are in agreement with Kamal et al. [12], as they showed increase in Malondialdhyde (MDA) as marker of lipid peroxidation and oxidation of lipids increased in diabetic nephropathy subjects than healthy subjects. Our results showed that this increase is parallel with increase in AER, until macroalbuminuria stage, as there is no significant in MDA between diabetic nephropathy groups (G3 and G4). Results of 8-OHdG showed highly significant increase in diabetic groups with albuminuria (G3 and G4) compared with control group (G1) and in macroalbuminuria (G4) compared with microalbuminuria (G3). Also, highly significant increase in diabetic groups with albuminuria (G3 and G4) compared with normoalbuminuria (G2), which has significant increase compared with control group (G1) (p value<0.05). This slightly significant increase in 8-OHdG with type 1 diabetic patients with normoalbuminuria compared with healthy subjects (control) indicated that type 1 causes damage (oxidation) to DNA of kidney cells before occurrence of albuminuria (nephropathy) and after occurance of albuminuria this increase in 8-OHdG is highly increased as indicated between macroalbuminuria (G4) compared with microalbuminuria (G3) and presence of highly significant positive correlation between AER and 8-OHdG in study groups (p value<0.05) .These results are in accordance with Ilse, 2018 and Qi H et al. [3,13], they showed oxidative damage increase in endothelial cells of glomerulus detected in patients diagnosed with diabetic kidney disease (DKD), as oxidized DNA lesion excretion in the urine (8-OHdG) was significantly increased in patients with diabetic nephropathy progression, this is disagree with our results as they reported that this increase in 8-OhdG is only diabetic nephropathy progression and not with normoalbuminuria, but they estimated 8-OHdG in urine and we estimated it in serum, so we need more studies in this point and estimate 8-OHdG in both urine and serum samples together and correlate between them and confirm that this significant increase in patients with normoalbuminuria compared with healthy subjects founded in 8-OHdG results in serum, also found in urine or increase only in serum. Sanchez et al. and Santosh et al. [14,15] were also in agreement with our data, as higher concentrations of 8-OHdG were found to be associated with increased risk of progression of kidney disease in both T1DM and T2DM.
We concluded that 8-OHdG, reflects generalized cellular oxidative stress and oxidation of DNA. 8-OHdG concentration is used as a marker for DNA damage in kidney cells in patients with T1DM and predict nephropathy before occurrence of albuminuria.
More studies needed to confirm our results and estimate 8-OHdG in both urine and serum samples together and correlate between them and confirm that this significant increase in patients with normoalbuminuria compared with healthy subjects found in 8-OHdG results in serum, also found in urine or increase in serum only.
Citation:
Soliman AM, Awad ET, Abdelghffar ARB, Emara IA, El Azeem EM (2019) Assessment of 8-Hydroxy-2-Deoxyguanosine (8-OHdG) as a Diagnostic Marker for Diabetic Nephropathy in Type 1 Egyptian Diabetic Patients. J Diabetes Metab 10: 826. doi: 10.35248/2155-6156.19.10.826.
Received: 25-Feb-2019 Published: 29-Apr-2019, DOI: 10.35248/2155-6156.19.10.826
Copyright:
© 2019 Soliman AM, et al. This is an open-access article distributed under the terms of the Creative Commons Attribution License, which permits unrestricted use, distribution, and reproduction in any medium, provided the original author and source are credited.