Research Article - (2015) Volume 6, Issue 3
The present study ascertained the comparative capacities of single and combinatorial herbal formulations of Acanthus montanus, Emilia coccinea, Hibiscus rosasinensis and Asystasia gangetica to exert glycemic control and ameliorate oxidative stress in renal and hepatic tissues of alloxan-induced hyperglycemic rats (HyGR) following 30 days treatment. Phytochemical composition of the herbal extracts and fasting plasma glucose concentration (FPGC) of the rats were measured by standard methods. The post mitochondrial supernatant fractions (PMSF) of renal and hepatic tissues homogenates were measured for activity levels of glutathione peroxidase (GPOx), superoxide dismutase (SOD) and catalase (CAT) as well as glutathione (GSH) concentration. Comparatively, flavonoids were the most abundant phytochemical present in the four herbal extracts. FPGC of treated HyGR was within the range of 66.30 ± 0.71 - 133.00 ± 0.63 mg/dL as against the untreated hyperglycemic rat group=368.20 ± 0.72 mg/dL (p<0.05). At the end of the experimental time, treated HyGR liver SOD activities were lower than that of normal group (p<0.05). Liver and kidney GPOx activities of HyGR were 2.36 folds and 3.93 folds lower than the normal rats. Furthermore, liver and kidney CAT activities of the treated HyGR were significantly (p<0.05) lower than the normal rats, whereas liver and kidney GSH/GSSG ratios were significantly (p<0.05) increased when compared with treated HyGR. Combinatorial herbal formulations exerted greater glycemic control than the single herbal formulations and caused a sparing effect on renal and hepatic antioxidants against reactive oxygen species.
Keywords: Antioxidant; Hyperglycemia; Hepatic; Renal; Phytochemicals
Acanthus montanus (Nees) T. Anderson belongs to the family of Acantheceae and is widespread in Africa, the Balkans, Romania, Greece and Eastern Mediterranean. The plant is a thinly branched perennial shrub with basal clusters of oblong and lance shaped glossy, dark green leaves that measure about 30 cm long. A. montanus is commonly known as mountain thistle or Devil’s fig or Bear’s Breech. The medicinal usefulness of the plant extracts have been previously reported elsewhere [1,2]. Asystasia gangetica L. T. Anderson is also known as creeping foxglove and belongs to the family of Acantheceae. It is a fast-growing herbaceous weed of height between 0.3 – 0.4 m. Decoctions of A. gangetica are used in African and Asian ethnomedicinal practices for the alleviation of stomach ache, urethral discharge, inflammation, rheumatism and dry cough. Also, A. gangetica is used for the management of diabetes mellitus (DM) and epilepsy as well as antidote to snake bite. Emilia coccinea (SIMS) G. Donis (family: Asteracca) is commonly found in African countries like Congo, Sudan, Kenya, Tanzanian, Malawi, Uganda and Nigeria [3]. In parts of Africa, this multipurpose plant serves as delicacies and herbal concoctions for remedies of numerous diseases including DM [3,4]. Hibiscus rosasinensis L. is an evergreen shrub that grows up to 1.8 – 2.4 m high. The family, Malvalcae, is consists of 82 genera and over 1,500 species of which over 200 species are found in tropical and subtropical regions of the world. The flowers are hermaphrodites and vary in colour depending on the species and location. The medicinal usefulness of H. rosasinensis in the treatment of cardiovascular diseases, DM as well as its hypotensive activity has been reported by previous researchers [5-7].
Hyperglycemia, which is one of the prominent defining features of DM, has been implicated in promoting overwhelming levels of reactive oxygen and nitrogen species (RONS) [8,9] and protein glycation [10,11]. Hyperglycemia mediated generation and accumulation of RONS may occur through one or combinations of the following molecular events: distortions of glycolytic pathways [12,13], intercellular activation of sorbitol (polyol) pathways [14], auto-oxidation of glucose [15] and non-enzymatic proteins and amino acids glycation [16,17]. Antioxidant systems prevent cellular damage from the adverse effects of xenobiotics, carcinogens and cytotoxic activities of RONS. Several reports showed that there are several biologically derived compounds with antioxidant functions [18-20]. Glutathione peroxidases (GPOx; EC 1.11.1.19) are ubiquitous selenium-containing peroxidases that catalyze the reduction of a variety of hydroperoxides (ROOH and H2O2) using GSH as co-factor. GPOx activity, among other functions, protects mammalian cells against oxidative damage. There are at least five GPOx isoenzymes found in mammals with the levels of each isoform vary depending on the tissue type [18,21]. Superoxide dismutase (SOD; EC 1.15.1.1) is metallo-enzyme that defines the basis for their classification; Mn-SOD [22] and Cu, Zn-SOD [20,23] Ni–SOD [24]. SOD activity neutralizes superoxide by transforming oxygen derived reactive species to peroxide, which can in turn be eliminated by the actions of catalase or GPOx activities. Catalase (CAT; EC 1.11.1.6) is a tetrameric haemin-enzyme consisting of four identical tetrahedrally arranged subunits of ≈ 60 kDa [18]. CAT activity prevents H2O2-induced cellular damage by converting H2O2 to H2O and O2. To a large extent, the thiol-redox status of the cell is defined by cellular levels of GSH [25,26]. In addition, the reduced glutathione (GSH)/oxidized glutathione (GSSG) ratio (GSH:GSSG) is an important biomarker of redox environment in biologic systems [25,27].
In modern medicine and traditional systems, medicinal plants have continued to provide valuable therapeutic agents for the treatment and management of diseases and disorders. Moreover, in spite of the higher acceptability level of orthodox anti-diabetic therapeutics, the use several plants as herbal remedies by traditional healers for the treatment of diabetes mellitus is still very common especially in Africa and Asia continents [28-32]. According to Wang et al., [33] traditional herbs are commonly used in the form multi-herb recipe, which is believed to possess better pharmacological efficacy than the individual composite herb extracts. In that regard, the present study ascertained the comparative capacities of single and combinatorial herbal formulations of four medicinal plant extracts of A. montanus, E. coccinea, H. rosasinensis and A. gangetica to exert glycemic control in alloxan-induced HyGR. In addition, hyperglycemia causes oxidative organ damage mediated by autoxidation of glucose. Previous reports have revealed that cellular levels of the antioxidant system could serve as a reliable biomarker to establishing the pathogenesis and progression of DM especially with respect to tissue damage [34,35]. Therefore, studies were carried out to ascertain levels of renal and hepatic tissues derived primary oxidative stress indicators (GPOx, SOD, CAT activities and GSH/GSSG ratio) and their correlations following the administration of the herbal formulations. The outcome of the present investigations will serve to give insights into the capacities of the various herbal formulations to ameliorate hyperglycemia and tissue oxidative stress in DM.
Collection and preparation of herbal samples
Fresh leaves of Acanthus montanus (Nees) T. Anderson (ACMO), Emilia coccinea (SIMS) G. Don (EMCO) and Hibiscus rosasinensis L. (HIRO) were collected from uncultivated lands in Umuamacha Ayaba Umaeze, Osisioma Ngwa Local Government Area (LGA), Abia State, Nigeria, whereas fresh leaves of Asystasia gangetica L. T. Anderson (ASGA) were collected from Ubowuala, Emekuku, Owerri North LGA, Imo State, Nigeria. The four herbs were identified and authenticated by Dr. M. Ibe at the School of Agriculture and Agricultural Technology (SAAT), Federal University of Technology, Owerri. All the leaves were collected between the months of July and August, 2009.
The leaves of individual plants were washed with continues flow of distilled water for 15 min and allowed to dry at laboratory ambient temperature (24 ± 5°C). A 500 g part of each herbal samples were weighted using a triple beam balance (OHAU 750-50: Burlington, NC, USA) and dried in an oven (WTC BINDER, 7200 Tuttlingen, Germany) at 60°C until a constant weight was achieved. The dried leaves were packaged in dark polyethylene bags and kept in cold room (7 ± 3°C) for 24 h before pulverization. Next, the separate dried leaves were pulverized using Thomas-Willey milling machine (ASTM D-3182, INDIA), after which the ground samples were stored in airtight plastic bottles with screw caps pending extraction.
Extraction of herbal samples
Portion of 40 g of each pulverized dried samples of A. montanus, E. coccinea, H. rosasinensis and A. gangetica were subjected to repeated soxhlet extraction cycles for 2 h using 96% C2H5OH (BDH, U.K) as solvent to obtain final volume of 500 mL of each herbal extracts. These volumes of the extracts were concentrated and recovered in rotary evaporator for 12 h at 60°C under reduced pressure. The extracts were dried in a desiccator for 24 h, wrapped in aluminum foil and stored in air-tight plastic bottles with screw caps at ≤ 4°C. The yields were calculated to be as follows: A. montanus =16.35% (w/w), E. coccinea =17.99% (w/w), H. rosasinensis =17.23% (w/w) and A. gangetica =16.69% (w/w). The separate extracts were reconstituted in phosphate buffered saline (PBS) solution (extract vehicle), osmotically equivalent to 100 g/L PBS (90.0 g NaCI, 17.0 Na2HPO4.2H2O and 2.43 g NaH2PO4.2H2O), before appropriated doses were administered to the experimental animals. Portions of the individual extracts were also measured for phytochemical contents.
Phytochemical composition of herbal extracts
Flavonoids content was measured by the methods of Boham and Kocipal [36]. Five grams (5.0 g) of the herbal extract was weighted into 250 mL beaker, mixed with 100 mL of 96% C2H5OH for 30 min at 24 ± 5°C and filtered using the Whatmann No 1 filter paper. The filtrate was dried in an oven to constant weight and cooled in a dessicator.
The concentration of alkaloids of the herbal extracts was measured by the methods of Harborne [37]. A 5.0 g extract was weighted into 250 mL beaker containing 100 mL of 10% CH3COOH (Sigma, St. Louis, USA) in C2H5OH. The content was mix properly by vortex and allowed to stand with continuous agitation (Shaking Bath; Precision Scientific Inc., Chicago, IL) at 24 ± 5°C for 4 h. The suspension was separated by simple filtration method using Whatman No 1 filter paper and concentrated by evaporation to ¼ of its original volume in a steam bath. Next, concentrated NH4OH (BDH, U.K) was added in droplets to the filtrate to form precipitates, which was subsequently separated by filtration. The precipitates were washed with 1% NH4OH, dried in an oven to constant weight and cooled in a dessicator.
Measurement of saponin content of the herbal extracts was by the methods of Harborne [37], as reported by Obadoni and Ochuka [38]. Five grams (5.0 g) of the sample was mixed with 200 mL of 20% C2H5OH. The suspension was heated in a water bath at 55°C while stirring for 4 h and allowed to cool to 24 ± 5°C. The precipitate was harvested by simple filtration methods using Whatman No 42 filter paper. The filtrate was concentrated by reducing the total filtrate volume to 40 mL by evaporation in a steam bath. In a 250 mL capacity separating funnel, the 40 mL concentrated filtrate was mixed properly with 20 mL of C2H5OC2H5 (BDH, U.K). The aqueous layer was recovered, whereas the organic layer was decanted. The purification and separation procedure was repeated twice. Finally, 60 mL of n-C4H9OH (BDH, U.K) was added to the extract followed by 10 mL of 5% NaCl (BDH, U.K) to precipitate saponins. The solution was evaporated to dryness in a water bath, dried in an oven and cooled in a dessicator.
Calculations
The concentrations of flavonoids, alkaloids and saponin (mg/100 g sample weight) in the various herbal extracts were calculated thus:
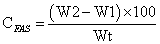 (1)
(1)
Where
CFAS: concentrations of flavonoids, alkaloids and saponins.
W2: weights of filter paper + precipitate.
W1: weight of filter paper.
Wt: weights of samples.
The Van-Burden and Robinson [39], method as reported by Belonwu et al., [40] was used to measure the concentration of tannins of the herbal extracts. A 5 g of the sample was mixed with 50 mL of distilled water for 1 h in a 50 mL capacity plastic bottle on a mechanical shaker. The mixture was filtered with Whatman No 42 filter paper. A 5 mL aliquot of the filtrate was mixed with 2 mL of 0.1 M FeCl3< in 0.1 N HCl and 0.008 M K4(Fe)CN6 (Sigma, St. Louis, USA) in a test tube. The absorbance of the analyte was measured at maximum absorptivity (λmax)=605 nm within 10 min and compared with the standards.
Experimental animals
Male albino (Wistar) rats weighing between 150-160 g were maintained at room temperatures of 24 ± 5°C, 30–55% of relative humidity on a 12-h light/12-h dark cycle, with access to water and standard commercial feed (SCF) (Ewu Feed Mill, Edo State, Nigeria) ad libitum for 2 weeks acclimatization period. The handling of the animals was in accordance with the standard principles of laboratory animal care of the United States National Institutes of Health (NIH, 1978).
Induction of diabetes/experimental design
Diabetes was induced in the rats by single intra-peritoneal (i.p) injection of 90 mg/kg bw of alloxan monohydrate (Sigma, St. Louis, USA) in PBS solution (pH=7.4). The animals with Fasting Plasma Glucose Concentration (FPGC) greater than 110 mg/dL for 5 consecutive days were considered diabetic and selected for the study. A total of 102 male Wistar rats were allotted into seventeen (17) groups of six (6) rats each. The animals were deprived of food and water for additional 16 h before commencement of treatment as described elsewhere [41]. The animal groups were designated on the bases of treatments received at regular intervals of 2 days for 30 days. Herbal treatments of the HyGR were defined as single herbal formulations (SHF): (Hr-Am, Hr-Ag, Hr-E and Hr-H), double herbal formulations (DHF): (Hr-Ag-Am, Hr-Ag-E, Hr- Ag-H, Hr-Am-E, Hr-Am-H and Hr-E-H), triple herbal formulations (THF): (Hr-Ag-E-H, Hr-Am-Ag-E, Hr-Am-Ag-H and Hr-Am-E-H) and quadruple herbal formulation (QHF): (Hr-Am-Ag-E-H).
• NORM: Normal rats received SCF + water ad libitum + 1.0 mL/ kg of PBS.
• DIAB: HyGR received SCF + water ad libitum + 1.0 mL/kg of PBS.
• Hr-Am: HyGR received SCF + water ad libitum + A. montanus (20 mg/kg in PBS; i.p.).
• Hr-Ag: HyGR received SCF + water ad libitum + A. gangetica (20 mg/kg in PBS; i.p.).
• Hr-E: HyGR received SCF + water ad libitum + E. coccinea (20 mg/kg in PBS; i.p.).
• Hr-H: HyGR received SCF + water ad libitum + H. rosasinensis (20 mg/kg in PBS; i.p.).
• Hr-Ag-Am: HyGR received SCF + water ad libitum + combined dose (ratio: 1:1w/w) of A. gangetica + A. montanus (20 mg/kg in PBS; i.p.).
• Hr-Ag-E: HyGR received SCF + water ad libitum + combined dose (ratio: 1:1w/w) of A. gangetica + E. coccinea (20 mg/kg in PBS; i.p.).
• Hr-Ag-H: HyGR received SCF + water ad libitum + combined dose (ratio: 1:1w/w) of A. gangetica + H. rosasinensis (20 mg/ kg in PBS; i.p.).
• Hr-Am-E: HyGR received SCF + water ad libitum + combined dose (ratio: 1:1w/w) of A. montanus + E. coccinea (20 mg/kg in PBS; i.p.).
• Hr-Am-H: HyGR received SCF + water ad libitum + combined dose (ratio: 1:1w/w) of A. montanus + H. rosasinensis (20 mg/ kg in PBS; i.p.).
• Hr-E-H: HyGR received SCF + water ad libitum + combined dose (ratio: 1:1w/w) of E. coccinea + H. rosasinensis (20 mg/kg in PBS; i.p.).
• Hr-Ag-E-H: HyGR received SCF + water ad libitum + combined dose (ratio: 1:1:1w/w) of A. gangetica + E. coccinea + H. rosasinensis (20 mg/kg in PBS; i.p.).
• Hr-Am-Ag-E: HyGR received SCF + water ad libitum + combined dose (ratio: 1:1:1w/w) of A. montanus + A. gangetica + E. coccinea (20 mg/kg in PBS; i.p.).
• Hr-Am-Ag-H: HyGR received SCF + water ad libitum + combined dose (ratio: 1:1:1w/w) of A. montanus + A. gangetica + H. rosasinensis (20 mg/kg in PBS; i.p.).
• Hr-Am-E-H: HyGR received SCF + water ad libitum + combined dose (ratio: 1:1:1w/w) of A. montanus + E. coccinea + H. rosasinensis (20 mg/kg in PBS; i.p.).
• Hr-Am-Ag-E-H: HyGR received SCF + water ad libitum + combined dose (ratio: 1:1:1:1 w/w) of A. montanus + A. gangetica + E. coccinea + H. rosasinensis (20 mg/kg in PBS; i.p.).
At the end of treatment, the animals were fasted for 12 h [28] before their blood samples and organ homogenates were measured for the various biochemical parameters.
Fasting plasma glucose concentration
Blood samples (2.0 mL) were drawn from the orbital sinus [42] on the 30th day and measured for FPGC. Determination of FPGC was by the glucose oxidase method according to Randox® kit manufacturer’s procedure (Randox® Laboratories Ltd. Ardmore, United Kingdom).
Preparation of renal and hepatic organs homogenates
The rats were anaesthetized in CCl4 chamber and dissected. The kidneys and liver were quickly excised and placed on a blotting paper to remove blood and rinsed in 1.15% of potassium chloride solution to remove residual hemoglobin [43]. The two organs were stored in 10% formaldehyde and preserved at temperature below -8 °C before analyses. Preparation of the organ homogenates was according to the methods of Adekunle et al., [43] with minor modifications by Chikezie and Uwakwe [44]. Each organ was homogenized using a Teflon homogenizer in aqueous K2PO4/KHPO4 buffer (0.1 M; pH=7.4); in 4:1 volume of buffer to organ weight. Next, the crude homogenate was centrifuged at 10,000×g for 20 min at 4°C to obtain the post mitochondrial supernatant fraction (PMSF). The PMSF was finally stored at -8°C before used for analyses. The PMSF was measured for GPOx, SOD and CAT activities. Protein concentrations of PMSF of hepatic and renal homogenates were assayed by the method of Lowry et al., [45] using bovine serum albumin (Sigma-Aldrich, St. Louis, USA) as a standard. Also, the PMSF was measured for glutathione (GSH) concentration.
Glutathione peroxidase activity
GPOx activity was measured by the method of Paglia and Valentine [46], as reported by Chikezie and Uwakwe [44]. Briefly, the reaction mixture contained aliquot of PMSF in 50 mM K2PO4/KHPO4 buffer (pH=7.0), 1.0 mM EDTA (Mayer and Baker, England), 1.0 mM NaN3, 0.2 mM NADPH, 1.0 U glutathione reductase, and 1.0 mM GSH. The reaction mixture was allowed to equilibrate at 25°C for 5 min. The reaction was started by introducing 0.1 mL of 2.5 mM H2O2. Increase in absorbance at λmax=340 nm was recorded for 5 min. The change in absorbance was defined as nanomoles of NADPH oxidized to NADP; Σ=6.2 × 10³ M-1cm-1 at λmax=340 nm. The levels of GPx were expressed in terms of nmole NADPH consumed/min/mg protein (U/mg protein).
Superoxide dismutase activity
SOD activity was measured according to the methods of Kono [47]. Briefly, the reaction mixture contained solution A (50 mM Na2CO3, 0.1 mM EDTA, pH=10.0), solution B (96 μM nitroblue tetrazolium (NBT) in solution A), and solution C (0.6% Triton X-100 in solution A) were incubated at 37°C for 10 min. Reaction was started by introducing 100 μL of solution D (20 mM hydroxylamine hydrochloride, pH=6.0). The rate of NBT dye reduction by O2 .- anion generated due to photoactivation of hydroxylamine hydrochloride was measured at λmax =560 nm in the absence of PMSF. Next, 10 μL aliquot of PMSF were added to the reaction mixture and 50% inhibition in the rate of NBT reduction by SOD present in the enzyme source was measured. A unit (U) of SOD activity was defined by the 50% inhibition of NBT. SOD activity was expressed in U/mg protein.
Catalase activity
Measurement of PMSF CAT activity was according to the method of Luck [48], as reported by Chikezie and Uwakwe [44]. The final reaction volume of 3.0 mL contained 0.05 M Tris-buffer, 5 mM EDTA (pH=7.0), and 10 mM H2O2 (in 0.1 M K2PO4/KHPO4 buffer; pH=7.0). A hundred micro milliliter (100 μL) aliquot of the PMSF was added to the above mixture. The rate of change of absorbance per min at λmax =240 nm was recorded for 5 min. CAT activity was calculated using Σ=43.6 M-1 cm-1 and expressed in terms of mole H2O2 consumed/min/ mg protein (U/mg protein).
Reduced glutathione (GSH)/oxidized glutathione (GSSG) ratio
Level of GSH in organ homogenate was determined by the procedure according to Moron et al., [49] with minor modification by Chikezie and Uwakwe [44]. A 100 μL aliquot of the PMSF was mixed with 25% of CHCl3 and centrifuged at 2000×g for 15 min to precipitate proteins. The supernatant was aspirated and diluted to 1.0 mL with 0.2 M Na2PO4/NaHPO4 buffer (pH=8.0). Next, 2.0 mL of 0.6 mM 5, 5’-dithiobis-(2-nitrobenzoic acid) (DTNB) was added. The absorbance of the developed yellow-colour complex maintained at 24 ± 5°C was measured at λmax =405 nm after 10 min. A standard curve was obtained with GSH standards. The level of GSH was expressed as μgGSH/mg protein. The GSSG concentrations (CGSSG) of organ homogenates were measured using Bioxytech-412 kits according to manufacturer’s procedure (Oxis International Inc., Foster City, CA, USA).
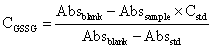 (2)
(2)
Accordingly, the ratio of GSH/GSSG of renal and hepatic tissues was evaluated.
Statistical analysis
The data collected were analyzed by the analysis of variance procedure while treatment means were separated by the Least Significance Difference (LSD) incorporated in the Statistical Analysis System (SAS) package of 9.1 version, (2006). Correlation coefficients and trend lines were determined using Excel Software (Microsoft, 2010 version).
At the end of the experimental time of 30 days, FPGC of DIAB group was 4.3 folds greater than the NORM group. Specifically, the Hr-Am, Hr-H, Hr-Ag-H and Hr-Am-E-H groups exhibited elevated FBGC compared with the NORM group (p<0.05) and were considered to be hyperglycemic after the 30-day treatment. Conversely, FPGC of Hr-Ag, Hr-Am-E, Hr-Am-H, Hr-E-H, Hr-Ag-E-H and Hr-Am-Ag- E-H groups were significantly (p<0.05) higher than the NORM group but not considered to be hyperglycemic after the 30-day treatment.
It is worthwhile to note that FPGC of the Hr-Ag-Am and Hr- Ag-E groups were significantly (p<0.05) lower than the NORM group. Specifically, the Hr-Ag-Am group =66.30 ± 0.71 mg/dL, Hr-Ag-E group =81.00 ± 0.39 mg/dL and NORM group =86.30 ± 0.15 mg/dL (Table 1). Generally, FPGC of the various treated HyGR was within the range of 66.30 ± 0.71 mg/dL and 133.00 ± 0.63 mg/dL as against the DIAB group =368.20 ± 0.72 mg/dL. At the end of the experimental time, the following animal groups: Hr-Ag, Hr-Ag-Am, Hr-Ag-E, Hr- Am-E, Hr-Am-H, Hr-E-H, Hr-Ag-E-H, Hr-Am-Ag-E and Hr-Am- Ag-E-H registered FPGC less than 110 mg/dL.
| Group | FPGC (mg/dL) |
|---|---|
| NORM | 86.30 ± 0.15n |
| DIAB | 368.20 ± 0.72a |
| HrACMO | 133.00 ± 0.63b |
| HrASGA | 105.70 ± 0.71e,f,g,h |
| HrEMCO | 118.00 ± 0.92c,d |
| HrHIRO | 112.50 ± 0.70d,e |
| HrAGAM | 66.30 ± 0.71q |
| HrAGEC | 81.00 ± 0.39n,o,p |
| HrAGHR | 112.50 ± 0.42d,e,f |
| HrAMEC | 97.20 ± 0.51l,m |
| HrAMHR | 105.00 ± 0.62e,f,g,h,i |
| HrECHR | 103.50 ± 0.79f,g,h,i,j |
| HrAGEH | 103.00 ± 0.81f,g,h,i,j,k |
| HrAMAE | 84.70 ± 0.51n,o |
| HrAMAH | 124.30 ± 0.92c |
| HrAMEH | 112.00 ± 0.71d,e,f,g |
| HrAAEH | 97.30 ± 0.85l |
The mean (X) ± S.D of six (n = 6) determinations. Means in the column with the same letter are not significantly different at p>0.05 according to LSD. FPGC>110 mg/dL = hyperglycemia.
Table 1: Fasting plasma glucose concentrations of normal, diabetic and treated
rats.
Figure 1 showed that flavonoids were comparatively the most abundant phytochemical present in the four leaf extracts, which was in the order: AMCO>ASGA>HIRO>EMCO. The concentration of alkaloids in HIRO was relatively low compared with other three leaf extracts. Saponin contents in the four leaf extracts were in the range of 43.50 ± 1.01 mg/g and 71.01 ± 0.62 mg/g. In addition, saponin contents of ASGA, EMCO and HIRO leaf extracts were not significantly (p>0.05) different; specifically, ASGA =44.50 ± 0.51 mg/g, EMCO=43.50 ± 0.54 mg/g and HIRO=45.25 ± 0.35 mg/g (Figure 1). Likewise, tannin contents of the four leaf extracts was within a narrow range of 25.50 ± 0.18 mg/g and 33.75 ± 0.32 mg/g; p>0.05. In addition, tannin was the lowest phytochemical present in the four leaf extracts.

Figure 1: Some phytochemical contents of Acanthus montanus, Emilia coccinea, Asystasia gangetica and Hibiscus rosasinensis leaf extracts.
Liver SOD (LSOD) activity of the NORM group was significantly (p<0.05) higher the corresponding kidney SOD (KSOD) activity (Figure 2). Likewise, in the DIAB group, LSOD activity was higher than KSOD activity; p>0.05. Also, Figure 2 showed that the levels of LSOD and KSOD activities of the DIAB group were 3.82 and 12.01 folds lower than the NORM group, relatively. At the end of the experimental time, each of the treated diabetic rats LSOD activities were lower than that of the NORM group; except Hr-Am-HLSOD activity=198.24 ± 1.02 U/ mg protein, whereas NORMLSOD activity=190.61 ± 1.22 U/mg protein; p>0.05. By the same comparison, Hr-Ag-AmKSOD activity and Hr- Ag-HKSOD activity were significantly (p<0.05) higher than NORMKSOD activity. Peak values of SOD activities of the treated HyGR were of the following magnitudes: Hr-AmLSOD activity=185.25 ± 1.01 U/mg proteins and Hr-Ag-AmKSOD activity =171.45 ± 0.99 U/mg protein.

Figure 2: Liver and kidney superoxide dismutase activities of experimental rats.
However, KSOD activities of other treated HyGR (Hr-Ag-E, Hr- Am-Ag-H, Hr-E-H and Hr-Ag-E-H) were higher than the NORM group, but with no significant difference (p>0.05). Generally, the treated HyGR exhibited increased levels of LSOD and KSOD activities compared with the DIAB group. For instance, the Hr-Am-H group showed 3.97 folds improvement in LSOD activity compared with the DIAB group. LSOD and KSOD activities of the treated HyGR showed a very weak positive correlation (r=0.197011749).
Liver GPOx (LGPOx) activity of the NORM group was not significantly (p>0.05) different from the corresponding kidney GPOx (KGPOx) activity; LGPOx activity=1.70 ± 0.03 U/mg protein, whereas KGPOx activity =1.10 ± 0.04 U/mg protein (Figure 3). LGPOx and KGPOx activities of DIAB group were 2.36 folds and 3.93 folds lower than the NORM group. However, LGPOx and KGPOx activities increased following the administration of the various herbal formulations to corresponding animal groups as against the decreased levels of LGPOx and KGPOx activities of the DIAB group. LGPOx activity showed a very weak negative correlation (r=-0.088487792) with KGPOx activity in the treated animal groups. A cursory look at Figure 3 showed that amongst the various treated hyperglycemic rat groups, peak LGPOx activity=1.71 ± 0.05 U/mg protein was exhibited by the Hr-Am-Ag-E-H group. Similarly, peak value of KGPOx activity=1.99 ± 0.04 U/mg protein, occurred in the HyGR consequent upon the administration of ACMO + HIRO (ratio: 1:1 w/w) herbal formulation.

Figure 3: Liver and kidney glutathione peroxidase activities of experimental rats.
Liver CAT (LCAT) activity was 2.19 folds greater than kidney CAT (KCAT) activity in the NORM group (Figure 4). DIABLCAT activity=23.05 ± 0.82 U/mg protein and DIABKCAT activity=20.78 ± 0.77 U/mg protein, representing 73.93% and 48.60% reduction in CAT activity compared with the NORM group; p<0.05. Comparative analyses showed that DIABLCAT activity was not significantly (p>0.05) different from DIABKCAT activity. Furthermore, at the end of the experimental time, LCAT activity and KCAT activity of all the treated hyperglycemic rat groups were significantly (p<0.05) lower than the NORM group; except Hr-AgKCAT and Hr-EKCAT activities; p>0.05. LCAT activity of the treated hyperglycemic animal groups showed a very weak positive correlation (r=0.000829808) with that of KCAT activity. Hr-Am-Ag-E-H group exhibited peak LCAT activity=83.77 ± 0.82 U/ mg protein, whereas Hr-E group gave peak KCAT activity=41.22 ± 0.72 U/mg protein.

Figure 4: Liver and kidney catalase activities of experimental rats.
The ratio of liver GSH/GSSG (LGSH:GSSG) levels and kidney GSH/GSSG (KGSH:GSSG) levels were such that in the NORM group, KGSH:GSSG was greater than LGSH:GSSG; p<0.05 (Figure 5). Also, Figure 4 showed that most values of liver and kidney GSH/GSSG ratios were significantly (p<0.05) increased compared with the NORM group, following the administration of the herbal formulations to the various hyperglycemic rat groups; except the Hr-Am-Ag-E group which gave LGSH:GSSG=9.74 ± 1.04 and KGSH:GSSG=19.00 ± 1.06. LGSH:GSSG and KGSH:GSSG) of treated hyperglycemic rat groups showed a very weak negative correlation (r=-0.192889137). Figure 5 showed that LGSH:GSSG peak value=15.74 ± 1.05, occurred in treated hyperglycemic rat groups administered with ACMO + HIRO (ratio: 1:1 w/w) herbal formulation. Correspondingly, peak value of KGSH:GSSG=26.11 ± 1.04, was presented in HyGR administered with ACMO + EMCO (ratio: 1:1 w/w) herbal formulation.

Figure 5: Liver and kidney ratio of GSH to GSSG concentrations of experimental rats.
Overview of Figures 2-5 showed that liver and kidney levels of antioxidant enzyme activities (SOD, GPOx and CAT) and GSH/GSSG ratios increased following the administration of the various herbal formulations, which was order of SHF>DHF>THF>QHF as indicated by their corresponding trend lines.
From the results of the present study, HyGR treated with the various herbal formulations for experimental period of 30 days showed evidence of varied levels of efficacy of herbal formulations to exert glycemic control (Table 1). Specifically, HyGR administered with the DHFs (Hr-Ag-Am, Hr-Ag-E and Hr-Am-E), THF (Hr-Am-Ag-E) and QHF (Hr-Am-Ag-E-H) were normoglycemic (FBGC=66.30 ± 0.71 - 97.30 ± 0.85 mg/dL) following the 30-day treatments. In conformity with the present findings, several authors had previously reported the use of herbal remedies for the control and management of hyperglycemia in animal models [28,32,50,51] and individuals suffering from DM [52-56]. Furthermore, the diverse modes of actions of some selected anti-hyperglycemic plants have been extensively discussed elsewhere [32,57,58]. In all these reports, the quantity and types of phytochemicals present in the extracts were considered to be, to a large extent, responsible for the observed anti-hyperglycemic properties of the herbal extracts [32,50,51,53,56,59,60].
Previous studies showed that alkaloids and flavonoids from natural products and plant materials are effective anti-diabetic agents [57,61]. In another study, the potency of core structures of flavonoids precursors to act as anti-hyperglycemic agent was demonstrated in vivo in diabetic rats [62]. A comprehensive review on natural approach to the treatment of diabetes by Kumar et al., [7] further confirmed that flavonoids are among the listed several anti-diabetic compounds, which exert their hypoglycemic properties via extra pancreatic mechanism of α-glucosidase modulation [56]. Expectedly, the relatively high flavonoids contents of the four medicinal plants (ACMO, ASGA, EMCO and HIRO) contributed to the capabilities of the herbal formulations to exert glycemic control in the experimental rats. Likewise, the relatively high abundance of alkaloids, especially in ACMO, ASGA and EMCO extracts, may have acted as an anti-hyperglycemic agent as previously reported [63]. Therefore, combinatorial formulations of the four medicinal plant extracts promoted anti-hyperglycemic synergy amongst the various bioactive principles, and thereby potentiated their glycemic control indices of the individual plant extracts in conformity to previous reports [33,64]. Also, Brahmbhatt et al., [65] demonstrated that combining ginger extracts’ with other constituents, particularly 6-gingerol, caused significant augmentation of anti-proliferative activity of the extracts. Paradoxically, studies have equally shown that antagonistic inter-phytochemicals interactions in medicinal plant extracts could attenuate the therapeutic potentials of the individual bioactive principles [66].
Generally, the level of enzyme activity in biologic systems could serve as a reliable tool in ascertaining health and pathologic conditions [20]. Also, in the event of exposure of biological systems to noxious chemical agents and other environmental insults, previous researchers have applied levels of activity of diverse antioxidant enzymes and low molecular weight antioxidants (LMWA) as basis for ascertaining tissue oxidative stress status [18,20,26,70-73] Findings from the present study showed that HyGR exhibited alterations in tissue antioxidant enzymes (SOD, GPOx and CAT) activities and GSH/GSSG ratio, of which the cellular levels of these oxidative stress indicators were diagnostic of oxidative tissue injury.
Decreased SOD activity of untreated HyGR as reported here conformed to previous observations elsewhere [11,74,75] Particularly, Di Naso et al., [11] noted that decreased SOD activity in DM is connected with non-enzymatic glycation of intracellular SOD at the lysine residues located in the heparin-binding domain, which indirectly altered extracellular SOD activity and functionality. In another study, Loven et al., [76] posited that decreased Cu-Zn SOD activity observed in DM was sequel to the inactivation of the enzyme as a result of absence or failure to metabolize hydrogen peroxide via GPOx pathway. The decreased levels of renal and hepatic SOD activity of HyGR showed evidence of restoration of the enzyme activity that were comparable to NORM rats following the administration of the various experimental herbal formulations (Figure 2). The present findings are comparable with that reported by Elmalí et al., [77] in which they noted that glibenclamide directly increased renal and hepatic CAT and SOD activities of S-IDR. Reports have shown that ethanolic extract of Sphaeranthus indicus exhibited protective effect against lipid peroxidation and normalized repressed SOD, CAT, glutathione S-transferase activities in gentamicin induced nephrotoxic rats [70]. In the same vein, previous reports showed that S-IDR treated with exogenous SOD and GSH exhibited improved antioxidant enzymes activities [11,74,76], which implied amelioration of tissue oxidative stress.
Depressed renal and hepatic GPOx and CAT activities are associated with the diabetic state as reported here (Figures 3 and 4). Specifically, previous studies by Hwang et al., [78] had noted that CAT deficiency accelerated diabetic nephropathy, which was mediated by peroxisomal dysfunction. However, cod liver oil intake engenders significant increase in both GPOx and CAT activities in aorta, heart, and liver of S-IDR, [79] thereby alleviating oxidative stress induced tissue injuries. Similarly, the studies by Shanmugam et al., [75] revealed that dietary ginger improved renal and hepatic GPOx and CAT activities alongside other antioxidant enzymes and oxidative stress indicators of S-IDR. They further noted that treatment of diabetic rats with ginger for 30 days caused a therapeutic protective effect by lowering oxidative stress induced hepatic and renal damage. Also, using experimental female Wistar rats, several natural products obtained from wide varieties of medicinal plants reversed low levels of tissue SOD, CAT, GPOx and GST activities following exposure to cadmium [72]. They further suggested that their therapeutic actions were probably connected with the synergistic effects of the bioactive principles of the natural products. The present study has equally shown substantial improvements in depressed renal and hepatic GPOx and CAT activities in HyGR following the administration of combinatorial herbal formulations of the four medicinal plant extracts.
The physiochemical roles of GSH are indispensible in a multitude of cellular processes. Therefore, disturbances in GSH homeostasis are associated with the etiology and/or progression of a number of human diseases [26]. Furthermore, the redox state of the GSH/glutathione disulfide couple (GSH/GSSG) is an important biologic indicator and regulator of signals of metabolic pathways in normal cell systems [27,80] as well as indicators of level of oxidative stress and glucose metabolism in type 2 DM [81]. Accordingly, the results of the present investigations have shown that GSH/GSSG ratio served as a reliable biomarker in ascertaining the efficacy of herbal remedies in alleviation of hyperglycemia and amelioration of tissue oxidative stress. The present findings corroborated the reports of El-Missiry and El Gindy [82], in which they noted that daily oral administration of Eruca sativa seeds oil for 2 weeks stimulated and increased hepatic GSH production of alloxan-treated rats. Additionally, Zitka et al., [83] used the redox status expressed as GSH:GSSG as a biomarker for ascertaining the level of oxidative stress in paediatric tumor patients, which was in line with earlier reports by Murakam et al., [84] on impairment of glutathione metabolism in erythrocytes of patients suffering from DM.
From the present investigations, the antioxidant enzymes activities and GSH:GSSG between renal and hepatic tissues of HyGR treated with the various herbal formulations gave poor correlations. This was an obvious indication that the levels of oxidative stress and subsequent capacities of the herbal formulations to ameliorate oxidative stress in renal and hepatic tissues of HyGR were not of equal pathophysiological proportions and dimensions. Generally, the improvement in renal and hepatic antioxidant enzymes activities and GSH:GSSG ratio of the treated HyGR suggest that the experimental herbal formulations caused a sparing effect on renal and hepatic antioxidant system against reactive oxygen species. Additionally, the combinatorial herbal formulations exerted greater glycemic control than the single herbal formulations.
