Research Article - (2014) Volume 5, Issue 2
Background: The Middle East region is predicted to have one of the highest prevalence of diabetes mellitus (DM) in the world. This is the first study in the region to forecast the burden of diabetes.
Aim: This study aims to estimate the projected prevalence of type 2 diabetes mellitus [T2DM] among adults in Qatar over the period 2012 to 2025 using national data, and to quantify the potential effect of a suggested preventive intervention program.
Design: It is an observational cohort study.
Setting: The survey was based on registry at the Hamad General Hospital and Primary Health Care (PHC) centers in the State of Qatar.
Subjects: This study consisted of patients above 25 years of age with diagnosed diabetes mellitus registered at Hamad General Hospital and Primary Health Care (PHC) centers during January 2006 to December 2012.
Methods: We developed a dynamic model in which actual incidence, prevalence, and life expectancy data are used and alternative assumptions about future trends in these parameters can be incorporated. Linear regression model has been performed to forecast the burden of diabetes in oil - rich country.
Result: According to the dynamic model, a 10% increased in the number of diabetic patients in the State of Qatar from 37000 in 2006 to 122,000 in 2012 (about 1% annually). The annual diabetes incidence rate was higher in women than in men during a period between 2006 to 2012 years. The static model forecasted as 10% increase over 10 years. The relative increase in prevalence of diabetes and number of diabetic people is higher in women than in men (16.6%; 17.5% and 18.4% in men vs. 22.6%; 23.8% and 25.1% in women). Most of the increase in prevalence of diabetes is projected to occur in younger age groups where it is estimated to increase among age groups of 50-59 years and above 60 years, respectively.
Conclusion: The burden of diabetes in Qatar is markedly larger than proposed by IDF estimations- suggesting that Qatar would be one of the top ten countries worldwide in diabetes prevalence. Family history of diabetes, consanguinity marriages’, hereditary gene-environment interactions, poor nutrition in utero and in early life plus over nutrition in later life may also contribute to the current diabetes epidemic in Qatari’s Arab populations. In planning future health care, monitoring of trends in incidence, prevalence, remission, and mortality or life expectancy is a necessary prerequisite.
Keywords: Epidemiology, Diabetes, Projection, Modeling, Regression models, Economics cost
Type 2 Diabetes Mellitus [T2DM] has been described as a modern epidemic [1], emerging rapidly in developing countries. T2DM is a worldwide major public health problem. It is a global crisis that threatens the health and economy of all nations, particularly developing countries and one of the main chronic diseases currently affecting humankind, regardless of socioeconomic status and geographic location. Also, it increases the risk of future vascular disease [2]. It is the fourth or fifth leading cause of death in most high-income countries and there is substantial evidence that it is changing into an epidemic in many low- and middle-income countries [3]. Diabetes is certain to be one of the most challenging health problems in the 21st century [4].
IDF most recent estimates indicate that globally 8.3% of adults are living with diabetes and the number of people with diabetes is set to rise beyond 592 million in less than 25 years [3]. A further 175 million of Cases are currently undiagnosed and a vast amount of people with diabetes are progressing towards complications [3]. In-spite of these alarming figures, many governments and public health planners in developing countries remain largely unaware of the current magnitude or, more importantly, the future potential for increase in diabetes and its serious complications in their own countries [2]. Studies have attributed this rise in the burden of diabetes mellitus to population growth, environmental and genetics factors, as well as increasing urbanization, and physical inactivity [5-7].
Although there are various measures for assessing the risk of having undiagnosed diabetes [2,5-7], few measures are available for assessing the future possibility of developing diabetes [3-8]. Projecting future prevalence of diabetes is a useful approach to estimate the burden of diabetes. Some studies that projected future diabetes prevalence in other countries [9-13] did not consider the variation in the risk of developing diabetes in different individuals, which could possibly distort estimates of prevalence. Number of people with diabetes is increasing due to population growth, aging, genetics factors, urbanization, and increasing prevalence of obesity and physical inactivity [1,6]. Moreover, many of these projections are based on estimates of diagnosed diabetes and exclude estimates of total diabetes (diagnosed and undiagnosed), which may lead to serious underestimation of the diabetes burden in the population.
In developed countries, such as Greenland [9], United States [10,11], United Kingdom [12], and Netherlands [13], considerable evidence has been accumulated on the increase in diabetes prevalence. Unlike developed countries, in the developing countries including Qatar, however, there is no information about future projections of diabetes. The only available estimate about future diabetes in Qatar is 15.43% [3], and this estimate is based on data from other countries in the region [3]. According to Bener et al. [14], the prevalence of DM among adult Qatari population was 16.7%. Also, the impaired glucose tolerance (IGT) was diagnosed in 12.5%, while impaired fasting glucose was in 1.3% with a total of (13.8%) [14].
The state of Qatar is a rapidly developing country with a change that influenced the lifestyle of the people towards urbanization, particularly over the recent decades. Globally, it was estimated that diabetes accounted for 12% of health expenditures in 2010, or at least $376 billion-a figure expected to hit $490 billion in 2030 [15]. Therefore, increasing prevalence of DM and its associated health complications threaten to reverse economic gains in developing countries. With limited infrastructures for diabetes care, many countries are illequipped to manage this epidemic. This study aims to estimate the projected prevalence of type 2 diabetes among adults in Qatar over the period 2012 to 2025 using national data, and to quantify the potential effect of a suggested preventive intervention program.
The projection of diabetes in Qatar was based on a data from January 2006 to December 2012. The data concerning the disease structure in Qatar such as major causes of death and frequent medical service treatment diseases were investigated. Mortality data for the year 2010 according to ICD 10, by age group were collected from the Annual Health Statistics Reports and Vital Health Statistics database [http:// site.hmc.org.qa/msrc/ahr.htm] [16]. Also, life expectancy table for the year 2006-2012 were used. Additionally, we have used the inpatient discharge abstract of the hospitals, diabetes and Endocrinology registry and some of the community surveys for the incidence of other diseases. Where sufficient data were not available to run the model, the incidence estimates were developed. The complete details of each minor and major category of ICD have been mentioned with its frequency, length of stay and number of deaths.
Data sets and parameters
The population structure at baseline years from 2006 to 2012 was obtained from the [16] Annual Health and Vital Statistics Report 2012. The population is expected to increase by 65% by 2025 as compared to that of 2012, with slightly higher increase in men than in women (69% vs. 49%). Between 2012 and 2025 the increase in number is smaller for the youngest age group (25-34 years), but it increases with age until it peaks in the age group of 55-64 years and then goes down. The age group of 75 years and above included more women than men, although the overall number of men is slightly higher than that of women.
The prevalence rates of diabetes, obesity and smoking at the baseline year were obtained from the various surveys [14]. Obesity was assumed not to exceed 30% of the prevalence. Smoking trends were determined based on experts’ interviews conducted in previous studies [14,17,18].
Furthermore an observational cohort study which was conducted among people with diabetes registered in diabetic clinics of primary health care (PHC) centres during the period 2010 – 2012. The diabetes care is organized in most of the PHC centers. During the study period from January 2010 to August 2012, the study included people with diabetes registered in these diabetic clinics. Of the 2334 registered with diagnosed diabetes, 1705 agreed and gave their consent to take part in this study, thus giving a response rate of 73.1%. Only patients with Qatari or any other Arab country nationalities residing in Qatar were included in the study. People with diabetes holding non-Arab nationality were excluded. IRB ethical approval, for this study, was obtained from Hamad Medical Corporation prior to commencing data collection.
Projection model and economic cost
Future diabetes prevalence was estimated using Diabetes Forecast Model from study that was developed for this purpose [15]. Based on a Markov approach [10,19] the model assumes that the population can be divided into several pools: people with diabetics, healthy people.
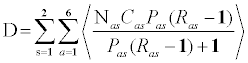
We used the approach developed by [20] to derive the estimate of health care expenditures for diabetes for the State of Qatar in 2012. Specifically, we used the formula:
 (1)
(1)
where D=the total health expenditure for diabetes in a country, Nas=the total population, in each age and sex subgroup, projected for a country in 2010, Cas=the annual health expenditure per person including persons with and without diabetes, in each age and sex subgroup, in the country in 2005, Pas = the prevalence of diabetes in the country, by age and sex, projected for a country in 2010, Ras=the ratios of health care expenditure for persons with diabetes to persons without diabetes, by age and sex, a is an indicator for ten year age span (20–29, 30–39, ...,60+) and s is an indicator for sex (men, women).
The comparison with the IDF projections
The IDF estimated future diabetes prevalence among people 20-79 years of age, while age distributions in the model output of this study are ranged 25 years and over [3]. To allow better comparison, prevalence of diabetes was recalculated from the model output results after excluding all people >79 years of age and adding number of people 20-24 years of age for each year assuming that no diabetes Cases existed among them.
Statistical analysis
Student’s t-test was used to ascertain the significance of differences between mean values of two continuous variables and confirmed by non-parametric Mann-Whitney test. Chi-square and Fisher exact tests were performed to test for differences in proportions of categorical variables between two or more groups. Linear regression model was performed for the projection of diabetes burden through 2025. Pearson’s correlation coefficient was used to evaluate the strength of concordance between variables. The level p<0.05 was considered as the cut-off value for significance.
Cross sectional study and Socio demographic profile of the participants:
Overall mean (standard deviation) age of our studied sample was 45.6 (14.2) years with almost similar distribution between males (45.5 ± 14.0) and females (45.6 ± 14.4). Participants with Qatari nationality were almost double than non-Qatari (63.4% vs. 36.6%). In addition, significantly larger proportion of females were Qatari (74.6% vs. 25.4%; p<0.001). On the whole, more than three quarter (80.6%) of patients with diabetes was married, 13.1% were single and only a small proportion (6.3%) were either divorced or widow. Significantly larger proportion of females were divorced or widowed than males (9.1% vs. 3.4%; p <0.001). More than a quarter of the patients with diabetes (27.6%) were having secondary education, followed by those with intermediate education (20.1%), primary education (19.2%), university education (17.8%) and illiterate (15.2%). A majority of females were housewives (46.1%; p<0.001) while most males were either in sedentary/professional (33.5%) or manual (24.1%; p<0.001) occupations (Table 1).
| Variables | Total n=1705 n (%) | Gender | P value | ||
|---|---|---|---|---|---|
| Male = 862 n(%) | Female=843 n(%) | ||||
| Age Group (mean ± SD) | 45.6±14.2 | 45.5±14.0 | 45.6±14.4 | 0.913 | |
| <30 Years | 232(13.6) | 113(13.1) | 119(14.1) | 0.330 | |
| 30-39 Years | 264(15.5) | 126(14.6) | 138(16.4) | ||
| 40-49 Years | 225(13.2) | 125(14.5) | 100(11.9) | ||
| 50-59 Years | 390(22.9) | 189(21.9) | 201(23.8) | ||
| ≥60 Years | 594(34.8) | 309(35.9) | 285(33.8) | ||
| Ethnicity | |||||
| Qatari | 1081(63.4) | 452(52.4) | 629(74.6) | <0.001 | |
| Non-Qatari | 624(36.6) | 410(47.6) | 214(25.4) | ||
| Marital status | |||||
| Single | 331(19.4) | 150(17.3) | 181(21.4) | <0.001 | |
| Married | 1374(80.6) | 712(82.7) | 662(78.5) | ||
| Educational level | |||||
| Illiterate | 260(15.2) | 125(14.5) | 135(16.0) | 0.053 | |
| Primary | 328(19.2) | 175(20.3) | 153(18.1) | ||
| Intermediate | 342(20.1) | 179(20.8) | 163(19.3) | ||
| Secondary | 471(27.6) | 215(24.9) | 256(30.4) | ||
| University | 304(17.8) | 168(19.5) | 136(16.1) | ||
| Occupation | |||||
| Housewife | 389(22.8) | 0(.0) | 389(46.1) | <0.001 | |
| Sedentary/Professional | 460(27.0) | 289(33.5) | 171(20.3) | ||
| Clerk / officer | 298(17.5) | 208(24.1) | 90(10.7) | ||
| Business man | 174(10.2) | 114(13.2) | 60(7.1) | ||
| Army/Police | 138(8.1) | 86(10.0) | 52(6.2) | ||
| Student | 245(14.4) | 165(19.1) | 81(9.6) | ||
| Household Income (QR)* | |||||
| < $3,000 | 116(6.8) | 58(6.7) | 58(6.9) | 0.838 | |
| $3.000 – 4,999 | 552(32.4) | 279(32.4) | 273(32.4) | ||
| $5,000 – $7,000 | 598(35.1) | 310(36.0) | 288(34.2) | ||
| > $7,000 | 439(25.7) | 215(24.9) | 224(26.6) | ||
| Consanguinity | |||||
| Yes | 651(38.2) | 351(40.7) | 300(35.6) | 0.029 | |
| No | 1054(61.8) | 511(59.3) | 543(64.4) | ||
| BMI | |||||
| Normal (<25 Kg/m2) | 530(31.0) | 328(38.1) | 202(24.0) | <0.001 | |
| Overweight (25-30 Kg/m2) | 738(43.3) | 346(40.1) | 392(46.5) | 0.009 | |
| Obese (30+ Kg/m2) | 437(25.70 | 188(21.8) | 249(29.5) | 0.003 | |
| Physical Activities | 284(32.9) | 255(30.2) | 0.231 | ||
| Cigarette Smoking | 205(12) | 140(16.2) | 65(7.7) | <0.001 | |
| Sheesha water-pipe Smoking | 237(13.3) | 104(11) | 133(15.8) | <0.001 | |
| Hours of sleep (mean ± sd) | 6.5 ± 1.2 | 6.7 ± 1.2 | 6.3 ± 1.2 | <0.001 | |
| Family History of DM | |||||
| Negative | 560(32.8) | 285(33.1) | 275(32.6) | 0.846 | |
| Mother | 214(12.6) | 111(12.9) | 103(12.2) | 0.681 | |
| Father | 234(13.7) | 118(13.7) | 116(13.8) | 0.966 | |
| Both Parents | 194(11.4) | 92(10.7) | 102(12.1) | 0.354 | |
| Siblings | 476(27.9) | 244(28.3) | 232(27.5) | 0.717 | |
| Grand Parents | 27(1.5) | 12(1.4) | 15(1.8) | 0.522 | |
* [8]
Table 1: Cross-sectional study of socio-demographics and life-style habits of diabetes patients by gender (N=1705) *
Comparison of clinical characteristics across gender:
Almost half (46.5%) of the female patients with diabetes were overweight while more than a quarter (29.5%) females were obese. Similarly, 40.1% of males were overweight while only 21.8% males were obese. There was a significant difference among female and males in terms of overweight and obesity (P=0.009 and P=0.003 respectively). The majority of both males (86.0%) and females (84.0%) were diagnosed with type 2 DM. More than one third (40% males and 39.5% females) were having diabetes for the last 5-9 years while only a quarter of males (24.2%) and females (28%) were having diabetes for the last 10 or more than 10 years. Difference across gender in terms of duration of diabetes was not significant (P=0.112). Self reported average number of hours of sleep was significantly more among males (6.7 ± 1.2 vs. 6.3 ± 1.2; p<0.001).
Table 2 shows the number of diabetes patients’ visits for selected years among adults of age 25 years and older and projection of diabetes burden through 2025. There is a trend in age as increase the incidence rate increases as well. The annual diabetes incidence was higher in women than in men during a period between 2006 to 2012 years.
| Age Group | Years | ||||||
|---|---|---|---|---|---|---|---|
| 2006 | 2009 | 2012 | 2015 | 2020 | 2025 | ||
| Men | 25-34 | 2345 (1.6) | 7513 (1.6) | 10143 (2.1) | 20039 (2.9) | 19456 (3.2) | 11997 (3.3) |
| 35-44 | 6198 (4.7) | 13439 ( 4.8) | 20334 (6.6) | 38675 (8.5) | 50025 (8.7) | 57723 (8.2) | |
| 45-54 | 9041 (10.5) | 19603 (14.8) | 29661 (20.1) | 55080 (27) | 90872 (29.6) | 122049 (29.6) | |
| 55-64 | 4880 (19.2) | 8152 (22.3) | 16009 (31.7) | 17865 (39.7) | 33930 (39) | 59172 (35.2) | |
| 65-74 | 401 (8.1) | 822 (12.4) | 1317 (14.7) | 1449 (20.7) | 2400 (24) | 7785 (25.1) | |
| 75+ | 24 (1.7) | 51 (1.7) | 77 (2) | 130 (2.6) | 174 (2.9) | 200 (2.9) | |
| Total | 22889 (5.8) | 49579 (5.4) | 77541 (7.7) | 133665 (9.5) | 197532 (12.4) | 258926 (15.3) | |
| Women | 25-34 | 884 (1.5) | 5236 (5.5) | 2901 (2.2) | 4508 (2.8) | 3690 (3) | 2895 (3.3) |
| 35-44 | 6010 (12.4) | 13032 (21) | 19718 (23.3) | 29700 (30) | 48276 (32.4) | 60517 (36) | |
| 45-54 | 5724 (25.1) | 9982 (31.5) | 16328 (39.4) | 19995 (46.5) | 26100 (43.5) | 38554 (41.5) | |
| 55-64 | 1530 (21) | 2508 (23.8) | 5020 (33.6) | 8579 (37.3) | 9120 (30.4) | 9016 (23.7) | |
| 65-74 | 275 (10) | 596 (15.3) | 901 (17.9) | 1140 (22.8) | 2673 (24.3) | 5333 (26.7) | |
| 75+ | 31 (2.9) | 67 (3.1) | 101 (3.4) | 141 (4.7) | 165 (5.5) | 391 (6.5) | |
| Total | 14454 (10.2) | 31420 (15.3) | 44969 (16.2) | 64128 (19.2) | 89864 (23.9) | 116706 (28.3) | |
| Total | 25-34 | 3229 (1.6) | 12749 (2.3) | 13043 (2.1) | 24737 (2.9) | 23360 (3.2) | 14892 (3.3) |
| 35-44 | 12209 (6.7) | 26470 (7.7) | 40052 (10.3) | 68572 (12.4) | 98600 (13.6) | 118240 (13.6) | |
| 45-54 | 14765 (13.6) | 29584 (18) | 45989 (24.3) | 75030 (30.5) | 117165 (32.1) | 160603 (31.9) | |
| 55-64 | 6410 (19.6) | 10660 (22.6) | 21029 (32.1) | 26427 (38.3) | 43036 (37.1) | 68188 (33.1) | |
| 65-74 | 676 (8.8) | 1418 (13.5) | 2218 (15.9) | 2590 (18.5) | 5082 (24.2) | 13118 (25.7) | |
| 75+ | 54 (2.2) | 118 (2.3) | 178 (2.6) | 272 (3.4) | 340 (3.4) | 591 (4.9) | |
| Patients visit total | 37,344 | 80,998 | 122,509 | 196,959 | 287,182 | 375,632 | |
| Population Age > 25 Years | 534,051 | 1,124,287 | 1,277,186 | 2,225,636 | 3,245,156 | 6,716,300 | |
| Incidence rate (%) | 6.99 | 7.20 | 9.59 | 11.3 | 14.6 | 17.88 | |
* Source: Annual Health Report Qatar, http://site.hmc.org.qa/msrc/ahr.htm
Table 2: Number of diabetes patient visits and incidence rate for selected years among men and women adults age of 25 years old and above and projection of diabetes burden through 2025*
| Age Group | Years | ||||
|---|---|---|---|---|---|
| 2006 * | 2009 ** | 2012 *** | 2025 | ||
| Men | 20-29 | 2 (5.0) | 6 (5.3) | 6 (5.6) | 6.9 |
| 30-39 | 39 (23.2) | 53 (24.5) | 50 (25.8) | 31.4 | |
| 40-49 | 124 (24.8) | 117 (26.2) | 136 (27.6) | 33.6 | |
| 50-59 | 251 (33.6) | 323 (35.4) | 439 (37.3) | 45.3 | |
| 60+ | 373 (38.6) | 388 (40.8) | 373 (42.9) | 52.2 | |
| Total | 403 (16.6) | 461 (17.5) | 522 (18.4) | 22.3 | |
| Women | 20-29 | 5 (7.6) | 7 (8.0) | 14 (8.4) | 10.1 |
| 30-39 | 22 (18.6) | 40 (19.7) | 41 (20.7) | 25.2 | |
| 40-49 | 187 (34.5) | 187 (36.4) | 216 (38.3) | 46.5 | |
| 50-59 | 321 (43.9) | 406 (46.4) | 422 (48.8) | 59.4 | |
| 60+ | 357 (48) | 420 (50.6) | 449 (53.3) | 64.7 | |
| Total | 499 (22.6) | 599 (23.8) | 661 (25.1) | 30.5 | |
| Total | 20-29 | 8 (6.5) | 13 (6.5) | 20 (7.4) | 9.3 |
| 30-39 | 62 (21.3) | 93 (22.2) | 91 (23.2) | 27.3 | |
| 40-49 | 311 (29.9) | 305 (31.7) | 352 (33.3) | 40.7 | |
| 50-59 | 572 (38.7) | 729 (40.8) | 861 (42.2) | 49.9 | |
| 60+ | 730 (42.7) | 808 (45.4) | 821 (48) | 59.5 | |
| Total | 902 (14.6) | 1059 (16.7) | 1183 (19.4) | 29.7 | |
* [5,14]; ** [8,29]; *** [22]
Table 3: Community based surveys and Prevalence rate of diabetes patients for selected years among men and women adults age of 20 years old and above and projection of diabetes burden through 2025
Table 3 gives the community based surveys and point prevalence rate of diabetes patients for selected years among adults age of 20 years old and above and projection of diabetes burden through 2025. As can be seen from this Table in men, the numbers are lower than in women. However, the relative increase in prevalence of diabetes and number of diabetic people is higher in women than in men (16.6%; 17.5% and 18.4% in men vs. 22.6%; 23.8% and 25.1% in women). Most of the increase in prevalence of diabetes is projected to occur in younger age groups where it is estimated to increase by among age groups of 50-59 years and above 60 years, respectively.
The top 10 countries for expenditure on diabetes, as measured by total health expenditures for diabetes, per capita health expenditures for diabetes, and percent of health expenditures spent on diabetes are presented in Table 4. Only two of the ten countries with the highest total health expenditures for diabetes are developing countries. The top 10 countries with the highest per capita health expenditure on diabetes are all developed countries. The top 10 countries with the highest percent of the health expenditure spent on diabetes are all countries where the prevalence of diabetes is high.
| Country | Total (USD in 000s) | Country | Per person with diabetes (USD) |
|---|---|---|---|
| United States | 197,956,040 | Norway | 10,369 |
| Germany | 28,108,815 | Luxembourg | 10,206 |
| Japan | 22,150,916 | Switzerland | 9,873 |
| France | 17,242,239 | United States | 9,800 |
| Canada | 11,217,092 | Denmark | 7,272 |
| Italy | 11,022,611 | Netherland | 6,667 |
| United Kingdom | 7,647,875 | Canada | 6,177 |
| Spain | 6,694,086 | Sweden | 5,806 |
| China | 4,968,697 | Ireland | 5,598 |
| Mexico | 4,836,480 | Qatar ** | 3,663 |
* [3]
** Source: Hospital based cost manual http://site.hmc.org.qa/msrc/ahr.htm
Table 4: Top 10 Countries with the highest health expenditures for diabetes as measured by the national total, per person with diabetes, and percentage of the national health expenditure on diabetes in 2013
Table 5 presents top 10 countries/territories for prevalence (%) of diabetes (20-79 years), 2013 and 2035. As can be seen from this table the prevalence rate of Diabetes in Qatar is ranking number 10 in both year 2013 and year 2035, respectively as stated by IDF 2013 [3].
| COUNTRY/ TERRITORY | 2013 (%) | COUNTRY/ TERRITORY | 2035 (%) |
|---|---|---|---|
| Tokelau | 37.5 | Tokelau | 37.9 |
| Federated States of Micronesia | 35.0 | Federated States of Micronesia | 35.1 |
| Marshall Islands | 34.9 | Marshall Islands | 35.0 |
| Kiribati | 28.8 | Kiribati | 28.9 |
| Cook Islands | 25.7 | Cook Islands | 25.7 |
| Vanuatu | 24.0 | Saudi Arabia | 24.5 |
| Saudi Arabia | 24.0 | Vanuatu | 24.2 |
| Nauru | 23.3 | Nauru | 23.3 |
| Kuwait | 23.1 | Kuwait | 23.2 |
| Qatar | 22.9 | Qatar | 22.8 |
* [3]
Table 5: Top 10 countries/territories for prevalence* (%) of diabetes (20-79 years), 2013 and 2035.
Overweight and obesity
Overweight and obesity are driving the global diabetes epidemic. They affect the majority of adults in most developed countries and are increasing rapidly in developing countries. If current worldwide trends continue, the number of overweight people (BMI ≥ 25 kg/m2) is projected to increase from 1.3 billion in 2005 to nearly 2.0 billion by 2030 [21,22]. Compared with Western populations, the prevalence of overweight and obesity in Qatar is relatively very high over 29% among females (Table 1); meanwhile, it is increasing precipitously in parallel with economic development and rapid urbanization. In the Past several years, Qatari’s gross domestic product per capita has grown at an average annual rate of nearly 20% [16]. Meanwhile, the prevalence of overweight and obesity in Qatar adults increased from 20% in 2005 to over 25% in 2012 (Table 1).
Diet
Excessive caloric intake is a major driving force behind escalating obesity and type 2 diabetes epidemics worldwide, but diet quality also has independent effects. In the Nurses’ Health Study (NHS), we found that the quality of fats and carbohydrates play an important role in the development of diabetes, independent of BMI and other risk factors [6-7,14,23]. In particular, higher dietary glycemic load (GL) and trans fat are associated with increased diabetes risk. Evidence also indicates that higher consumption of sugar-sweetened beverages (SSBs) increases the risk of type 2 diabetes even after taking into account the effects of body weight [6].
Many developing nations experience rapid economic and social development with concomitant shifts in lifestyle habits and dietary structure [24]. These changes promote over nutrition and positive energy balance. In Middle-East and Arab Countries, traditional dietary patterns are being lost as the population adapts to more industrialized and urban food environments. At the same time, built living environments have become increasingly sedentary. These changes have a significant impact on type 2 diabetes risks by increasing body weight and central adiposity, and decreasing physical activity. With the rapid pace of nutrition transition, many countries are facing coexisting problems of over- and under nutrition, which lead to the double burden of infectious and chronic diseases [24].
Physical activity
Numerous epidemiologic studies show that increased physical activity reduces risk of diabetes, whereas sedentary behaviors increase risk [6]. In the NHS [6-7,14,23,25], each 2-h/day increment of time spent watching television (TV) was associated with a 14% increase in diabetes risk. Each 2-h/day increment of standing or walking around at home was associated with a 12% reduction in risk. More recently study by Bener et al. [8,22] showed that only 21% of Diabetes patients perform daily physical activities. These results indicate a continuum in the relationship between physical activity levels and diabetes risk. Among sedentary behaviors (TV watching, sitting at work, and other sitting), prolonged TV watching was associated with the highest risk. At least two potential mechanisms account for the positive association between watching TV and obesity and diabetes risk [21,25]. In fact, those who spend more time watching TV tend to have unhealthy eating patterns characterized by increased consumption of snacks, sugary beverages, and fast foods.
Cigarette and sheehsa-water-pipe Smoking
Cigarette smoking is an independent risk factor for type 2 diabetes and 12 % were observed to be smoker among diabetes patients and also, sheesha water-pipe smoking (13.3%) (Table 1). A meta-analysis found that current smokers had a 45% increased risk of developing diabetes compared with nonsmokers [26]. Moreover, there was a dose-response relationship between the number of cigarettes smoked and diabetes risk. Several possible biological mechanisms may explain the association between cigarette smoking and diabetes [5-7,14,23]. Although smokers tend to be leaner than nonsmokers, smoking has been associated with increased risk of central obesity or abdominal fat [6], an established risk factor for insulin resistance and diabetes. More recent literature showed that the proportion of smokers was above 18% among diabetes and metabolic syndrome patients [22] and there is a trend of smoking increasing within 8 years.
Family history of diabetes and consanguinity marriages
Diabetes is a disease that has a strong clustering in families and has a genetic component. It has been widely reported that the occurrence of T2DM is triggered by a genetic susceptibility and familial aggregation in several populations [17-18,27]. It was estimated that risk for diagnosed T2DM increases approximately two to four fold when one or both parents are affected (Table 1) [8,18]. Almost 25% to 33% of all T2DM patients have family members with diabetes and having a first-degree relative with the disease poses a 40% risk of developing diabetes [8]. T2DM patients are more likely to have diabetic mothers than diabetic fathers. The existence of excess maternal transmission of T2DM in offspring of affected mothers than affected fathers is currently debated. Consanguineous marriages and family history reflects both inherited genetic susceptibilities and shared environment which include cultural factors [18]. Thus, family history of diabetes may be a useful tool to identify individuals at increased risk of the disease and target behavior modifications that could potentially delay disease onset and improve health outcomes.
Harrison et al. [27] documented that family history information may serve as a useful tool for public health because it reflects both genetic and environmental factors [27]. Examining family history of DM may be a valuable approach for identifying patients at risk for diabetes. In addition, this survey provides some indication that knowledge of family history of diabetes may lead to identify people at increased risk of diabetes and perhaps motivate them to make preventive life style changes that could favorably affect both clinical practice and patient behavior [17].
Genetic susceptibility and gene-environment interactions
The recent advent of genome-wide association studies (GWAS) has led to major advances in the identification of common genetic variants [5-6,8,28-30]. To date, at least 40 genetic loci have been convincingly associated with type 2 diabetes, but these loci confer only a modest effect size and do not add to the clinical prediction of diabetes beyond traditional risk factors, such as obesity, physical inactivity, unhealthy diet, and family history of diabetes.
Despite heterogeneity across populations in risk allele frequency or effect size in type 2 diabetes genes, the combined effects of multiple genetic variants using genetic scores based on the number of risk alleles appear to be similar across different ethnic groups. Typically, each risk allele increment is associated with a 10–20% increased risk of type 2 diabetes [28,31,32]. These data suggest that the overall contribution of the identified genetic loci to type 2 diabetes is similar between Qatari’s and other Arab ethnic groups, and that these loci do not appear to explain ethnic differences in diabetes risk. In predicting future risk of diabetes, the clinical utility of these cumulative genetic risk scores appears to be limited in either high- or low-risk populations. Like other multi-factorial diseases, type 2 diabetes is a product of the interplay between genetic and environmental factors (Table 1) [5,8,28]. It seems that the genetic factors that underlie individual susceptibility are amplified in the presence of certain environmental triggers [5,6] (Table 6).
| COUNTRY/ TERRITORY | 2013 (%) | COUNTRY/ TERRITORY | 2035 (%) |
|---|---|---|---|
| Kuwait | 17.9 | Poland | 19.3 |
| Qatar | 17.1 | Kuwait | 18.1 |
| United Arab Emirates | 16.6 | Qatar | 17.4 |
| Poland | 16.5 | United Arab Emirates | 17.0 |
| Bahrain | 16.3 | Bahrain | 16.7 |
| Malaysia | 15.2 | Malaysia | 15.3 |
| Hong Kong SAR | 13.3 | Hong Kong SAR | 13.2 |
| Nicaragua | 12.9 | Anguilla | 13.0 |
| Japan | 12.6 | Guadeloupe | 13.0 |
| Singapore | 12.4 | Macau SAR | 12.9 |
* [3]
Table 6: Top 10 countries/territories for prevalence* (%) of IGT (20-79 years), 2013 and 2035
Type 2 diabetes is a global public health crisis that threatens the economies of all nations, particularly developing countries. Fueled by rapid urbanization, nutrition transition, and increasingly sedentary lifestyles, the epidemic has grown in parallel with the worldwide rise in obesity [6-22]. Controlling and treating type 2 diabetes and its complications require a long-term planning and rational allocation of resources-especially in developing countries with limited resources. Therefore, predicting the future burden of diabetes potentially provides an invaluable tool for public health planners. Studies predicting future prevalence of diabetes in developing countries are very rare [3]. This study provides for the first time future projections of diabetes in Qatar based on the country’s own data.
Type 2 diabetes is a global crisis that threatens the health and economy of all nations, particularly developing countries [6,17-18]. This epidemic is primarily driven by rapid urbanization, nutrition transition, and increasingly sedentary lifestyles. The diabetes epidemic in Qatar is characterized by onset at higher prevalence rate of overweight and obesity and younger ages compared with Western populations.
More recently studies showed that complications were higher in diabetic patients with family history of DM. Family history of DM was higher in patients of consanguineous parents compared to nonconsanguineous parents. The presence of a family history of diabetes resulted to an early onset of the disease to the offspring. Interventions to change the life style habits among families might reduce the risk of diabetes in the offspring of diabetic patients
Accumulating evidence strongly demonstrates that the majority of type 2 diabetes Cases can be prevented through diet and lifestyle modification [6]. However, the adoption of a healthy diet and lifestyle requires not only individual behavioral changes, but also changes in our food, built, and social environments [14]. Public health strategies that target the obesogenic environment are critical. Translating clinical and epidemiologic findings into practice requires fundamental shifts in public policies and health systems. To curb the diabetes epidemic, primary prevention through the promotion of a healthy diet and lifestyle should be a global public policy priority.
Using information from 2006, the model in this study predicted that the number of individuals with diabetes would increase two times, and diabetes prevalence would double, in about 10-20 years (14.6% in 2006 vs. predicted value of 24.7% in 2025). The IDF prevalence estimates were therefore generated using an average of available sources from countries matched by IDF region, World Bank’s income classification group, geography, and ethnicity [1,3-4]. However, our results suggest that the increase in diabetes prevalence and number of diabetes Cases will be substantially higher than IDF projections in the Middle Eastern and North African regions between 2011 and 2030 [3]. Current results are also higher than those reported for developed countries. For example, IDF projected an increase in prevalence of diabetes from 10.9% in 2011 to 11.8% in 2030 in United States, from 7.3% to 8.8% in Netherlands, and from 6.8% to 7.5% in United Kingdom [2].
The burden of diabetes in Qatar is markedly larger than proposed by IDF estimations- suggesting that Qatar would be one of the top ten countries worldwide in diabetes prevalence. Family history of diabetes, consanguinity marriages’, hereditary gene-environment interactions, poor nutrition in utero and in early life plus over nutrition in later life may also contribute to the current diabetes epidemic in Qatari’s Arab populations. In planning future health care, monitoring of trends in incidence, prevalence, remission, and mortality or life expectancy is a necessary prerequisite.
This work was generously supported and funded by the Qatar Foundation Grant No. UREP 13-109-3-021. The authors would like to thank the Hamad Medical Corporation for their support and ethical approval (HMC RP # Research proposal #13234/13).
