Research Article - (2015) Volume 4, Issue 2
Infectious or non-infectious peritonitis leads to systemic inflammation due to violation of the peritoneum which is often fatal. Fisetin, a flavonol compound, exhibits a broad spectrum of biological activities including anti-oxidant, anti-inflammatory, anti-cancer and neuro-protective effects. It was used in a murine model of thioglycollate (TG)- induced aseptic peritonitis to investigate its anti- inflammatory effects, and on RAW macrophage cells. In this study, peritonitis was induced in C57BL/6J mice using thioglycollate, and anti-inflammatory effects of fisetin, was assessed prophylactically. In in vitro study, cells treated with inflammatory agents like bacterial lipopolysaccharide (LPS) and phorbol-12-myristate-13-acetate (PMA) lose their viability and proliferative capacity. Fisetin has been shown to prevent the loss of viability when given prophylactically. In in vivo model, total cell recruitment was found to increase with TG, showing that it has induced inflammation. Interestingly cell recruitment was successfully inhibited by fisetin. The differential count of peripheral blood, treated only with TG, shows an increase in the polymorpho-nuclear (PMN) cell count, as compared to control. On treatment with Fisetin, PMN number decreases. Concentration of nitric oxide (NO) in intestine has increased 1.90 fold after 3 hours (p<0.05) and 1.24 fold after 24 hours (p<0.05), after treatment with TG as compared to control. NO concentration has decreased 1.28 fold after 3 hours (p<0.05) and 2.15 fold after 24 hours (p<0.05) with fisetin treatment, compared to only TG. Concentration of ascorbic acid in peritoneal fluid has increased 1.06 fold after 3 hours, 1.02 fold after 9 hours and 1.05 fold after 24 hours, on treatment with only TG, as compared to control. The ascorbic acid (ASA) concentration increases significantly (p<0.05) after treatment with fisetin, compared to only TG, after 3 hours (1.38 fold), 9 hours (1.44 fold) and 24 hours (2.19 fold). In conclusion, we found that fisetin had a positive prophylactic effect against peritonitis in mice.
Keywords: Inflammation; Aseptic peritonitis; Anti-oxidant; Phenolic compounds; Scavenger activities; Reactive oxygen nitrogen intermediates
TG: Thioglycollate; F: Fisetin; MTT: 3-(4, 5-Dimethyl Thiazol-2-yl)-2, 5-Diphenyl Tetrazolium Bromide; LPS: Lipopolysachharide; PMA: Phorbol 12-Myristate 13-Acetate; TG3, TG9, TG24: Treatment with only TG; Sacrifice after 3 h, 9 h, 24 h; TG3F, TG9F, TG24F: Treatment with Fisetin for 4 days; Followed by Treatment with 3% TG 1 hour after last Fisetin- Treatment; Sacrifice 3 h, 9 h, and 24 h after TG Treatment; PB: Peripheral Blood; PF: Peritoneal Fluid; BM: Bone Marrow; Spl: Spleen; Ins: Intestine; PP: Payer’s Patch; TC: Total Cell Count; DC: Differential Cell Count; PMN Cells: Poly Morphonuclear Cells; MN Cells: Mononuclear Cells; NO: Nitric Oxide; ASA: Ascorbic Acid; MPK-Milligram per Kilogram of Body Weight.
Symbols used:*-Denotes significance in samples compared to control.
*-Denotes significance in samples compared to samples treated with only TG.
Peritonitis is the inflammation of the peritoneum, which is the thin tissue that lines the inner wall of the abdomen, and covers most of the abdominal organs. Infected peritonitis is caused by perforation of part of the GI tract, by disruption of the peritoneum or by systemic infections. Non-infected peritonitis may be caused by leakage of sterile body fluids into the peritoneum, or by sterile abdominal surgery, which may inadvertently leave behind foreign bodies. Primary or spontaneous bacterial peritonitis (SBP) typically occurs when a bacterial infection spreads to the peritoneum across the gut wall or mesenteric lymphatics. Peritonitis is a common postoperative complication that can develop into lethal sepsis in case of delayed diagnosis or inappropriate treatment [1,2]. Though mortality due to sepsis caused by peritonitis has reduced over the last few decades, it can still range from 25-80% [1]. The pathophysiology of peritonitis is complicated and is involved in various processes, of which, the most important one is the inflammatory reaction [3]. The pathophysiology of peritonitis is not guided by any one particular mediator, signal or pathway. The main effects of peritonitis are dysregulated coagulation systems, abnormal production of mediators, inflammatory response (which may be heightened or suppressed, depending on the type of infection), and cellular irregularities (like lymphocyte apoptosis and neutrophil hyperactivity) [3]. Inflammation leads to increased production of reactive species like ROS (reactive oxygen species), NOS (nitric oxide synthase) and their product peroxynitrite by activated macrophages. This increase in oxidative stress leads to decrease in effectiveness of oxidant defences, that is, reduction in antioxidants. Local intra-abdominal focus of inflammation caused by the microorganisms can promote the synthesis and secretion of massive inflammatory cytokines, which would destroy the endothelial junctions and provide access for bacteria into the systemic circulation leading to lethal bacteremia [4-6]. During the pathological process of the peritonitis, NF-κB plays an activating role in the inflammatory reaction [6]. Acute peritonitis is one of the most headachy postoperative complications, which is an important cause of death in surgical practice and intensive care units [7]. Acute peritonitis differs from other infections because of the broad variety of causes, severity of the infection, polymicrobial pathogenesis and complex pathological process [8].
Perforation of part of the gastrointestinal tract is the most common cause of peritonitis. Disruption of the peritoneum, even in the absence of perforation of a hollow viscous, may also cause infection simply by letting micro-organisms into the peritoneal cavity. Examples include trauma, surgical wound, continuous ambulatory peritoneal dialysis, and intra-peritoneal chemotherapy. Again, in most of the cases, mixed bacteria are isolated; the most common agents include cutaneous species such as Staphylococcus aureus, and coagulasenegative staphylococci, but many others are possible, including fungi such as Candida [9]. Women can experience localized peritonitis from an infected fallopian tube or a ruptured ovarian cyst. Patients may present with an acute onset of symptoms, limited and mild disease, or systemic and severe disease with septic shock. It has been proven that delayed diagnosis of peritonitis was an important factor for its high mortality [10].
Peritoneal infections are classified as primary (i.e, from hematogenous dissemination, usually in the setting of an immunocompromised state), secondary (i.e, related to a pathologic process in a visceral organ, such as perforation or trauma), or tertiary (i.e, persistent or recurrent infection after adequate initial therapy). Primary peritonitis is most often spontaneous bacterial peritonitis (SBP) seen mostly in patients with chronic liver disease. Secondary peritonitis is by far the most common form of peritonitis encountered in clinical practice. Tertiary peritonitis often develops in the absence of the original visceral organ pathology [9,11-17]. Infections of the peritoneum are further divided into generalized (peritonitis) and localized (intra-abdominal abscess). The diagnosis of peritonitis is usually clinical. Diagnostic peritoneal lavage may be helpful in patients who do not have conclusive signs on physical examination or who cannot provide an adequate history [11]. An optimal treatment strategy against peritonitis has not yet established. In many cases, the surgical and antimicrobial treatment fails in this disease.
The animal model is one of the most important methods in the scientific research. Thioglycollate broth is a multi-purpose, enriched differential medium used primarily to determine the oxygen requirements of microorganisms. Sodium thioglycollate in the medium consumes oxygen and permits the growth of obligate anaerobes. The thioglycollate-induced peritonitis in mice is used as a model to study for potential anti-inflammatory action of investigated test compounds [18]. In this model, C57BL/6J mice are treated intraperitoneally with 3% sodium thioglycollate. This treatment is preceded by treatment with the drug of our choice, which, in this case, is fisetin.
Flavonoids, the most common group of polyphenolic compounds in the human diet, are abundant in fruits and vegetables. Fisetin is a bioactive polyphenolic flavonoid, commonly found in many fruits and vegetables such as strawberries, apples, persimmons, onions and cucumbers. It has been shown to possess both direct intrinsic antioxidant as well as indirect antioxidant effects [19,20]. Fisetin exerts multiple beneficial pharmacological activities such as anti-inflammatory, anticancer and in rheumatoid arthritis [21-25]. Recently, there has been an increasing interest in fisetin because of its anti-proliferative and apoptotic activities [26,27]. It was also considered to possess neuroprotective effects against the aging process, cerebral damage and neurodegenerative disorders [28]. In addition, several studies show that fisetin protects against several types of cancer, including prostate, cervical, colorectal, breast, bladder, and lung cancer [29,30].
The aim of this study was to investigate the prophylactic effect of fisetin in thioglycollate-induced peritonitis in mice. Fisetin is a flavonoid found in many common natural products, so it is easily available. We tested its prophylactic effects in a common inflammatory disease, peritonitis, so that it can be used as a drug.
Reagents
LPS (Cell wall lipopolysachharide from Escherichia coli 0111:B4) was bought from Sigma Aldrich, USA. PMA (Phorbol 12-myristate 13-acetate) was obtained from Calbiochem USA. MTT was obtained from Spectrochem Pvt. Ltd., Mumbai, India. Sodium thioglycollate, Fetal Bovine Serum (FBS), RBC Lysis Buffer were bought from HiMedia, India. DMSO (dimethyl sulfoxide), EDTA, methanol, L-Ascorbic Acid (L-ASA), Dinitrophenyl Hydrazine (DNPH), Thiourea, Sulfanilamide and NED were bought from Sisco Research Laboratory (SRL), India. Dulbecco’s Modified Eagle Medium (DMEM) from Gibco was used. Potassium Dichromate, Ortho-phosphoric acid and NaNO2 were purchased from Merck, India. Sulphuric acid was bought from Finar Chemicals Limited, India, and 6% H2O2 was bought from B. D. Pharmaceutical Works Pvt. Ltd., India. 1X phosphate buffered saline (PBS) was prepared using 137 mM NaCl (Merck, India), 2.7 mM KCl (Himedia, India), 10 mM Na2HPO4 (Qualigens, India), 2 mM KH2PO4 (Himedia, India).
96 well plates were obtained from Nest Biotech Co. Ltd., China. Dispovan syringes were used to obtain blood and peritoneal fluid.
Cells were incubated in a CO2 incubator (Thermo Fisher), and cells were observed using Floid Cell Imaging Station (Life Technologies, India).
Smears for cell counting were prepared using Cytospin (Centurion Scientific C2 Series) after centrifuging the sample in a cold centrifuge (Vision VS-15000CFN). Smears were observed under a light microscope (Debro DX-200). Absorbance readings were taken in a multi-plate reader (Thermo Fisher Multiskan EX). Plates were incubated in a CO2 incubator (Thermo Fisher).
All cell culture work was done inside the biosafety cabinet (Vision Scientific, Korea).
In-vitro cell proliferation studies
RAW macrophages were cultured, treated with inflammatory agents (LPS and PMA) and the effect of fisetin on cell viability was assessed using MTT test. Viable, proliferating cells produce NAD(P) H- dependent oxidoreductases, which can reduce the tetrazolium dye MTT [3-(4,5-dimethyl thiazol-2-yl)-2,5-diphenyl tetrazolium bromide], to its insoluble formazan (purple). These insoluble crystals are dissolved in DMSO, and absorbance is measured at 570 nm. 5 × 10⁴ RAW 264.7 cells were seeded into the wells of a 96-well plate and after 24 h, were treated with various concentrations of Fisetin (10 μM, 20 μM, 30 μM, 40 μM and 50 μM), followed by 1 μg/ml LPS (bacterial cell wall lipopolysachharide) for one group and 50 ng/ml PMA (Phorbol 12-myristate 13-acetate) for another, and incubated for 24 h. Then, the cells were incubated with 5 mg/ml MTT working solution for 3 h at 37°C followed by treatment with 100 μl DMSO to dissolve the form azan crystals. Absorbance was measured in a microplate reader (Shimazdu) at 570 nm. Cell viability for cells without treatment (control) was taken to be 100%, and the cell viability of the experimental groups calculated accordingly.
In-vitro assay for cellular uptake of fisetin
RAW 264.7 cells have been treated with different concentrations of fisetin (10 μM, 25 μM and 50 μM), followed by 1 μg/ml LPS, and observed under the microscope (Floid Cell Imaging Station). The change in uptake of fisetin by the cells was noted.
Animals
C57BL/6J mice were used. All experiments were performed according to rules laid down by the Institutional and departmental animal ethics committee and the animals housed under specific pathogen-free conditions at the animal housing vivarium of the Department of Zoology, University of Calcutta.
Treatment
5-6 weeks old male C57 mice were divided into seven groups: Control (n=3), TG3 (n=3), TG3F (n=2), TG9 (n=3), TG9F (n=2), TG24 (n=3) and TG24F (n=2). Three groups (TG3, TG9 and TG24) were treated with 3% thioglycollate (HiMedia, India) intraperitoneally (i.p). Three groups (TG3F, TG9F and TG24F) were treated with 3 MPK fisetin (i.p) for four consecutive days. After one hour of 4th day’s treatment, they were intraperitoneally treated with 3% thioglycollate. One group remained as placebo treated control (Table A).
| Group (No. of animals) | Day 0 | Day 1 | Day 2 | Day 3 | Day 4 | |||
|---|---|---|---|---|---|---|---|---|
| 0 hours | (0+1) hours | (0+1.5) + 3 hrs | (0+1.5) + 9 hrs | (0+1.5) + 24 hrs | ||||
| Treatment | Treatment | Treatment | Treatment | Treatment | ||||
| Control (n=3) | 400 μl PBS (i.p.) | 400 μl PBS (i.p.) | 400 μl PBS (i.p.) | 400 μl PBS (i.p.) | ||||
| TG3 (n=3) | 400 μl PBS (i.p.) | 400 μl PBS (i.p.) | 400 μl PBS (i.p.) | 400 μl PBS (i.p.) | 400 μl 3% TG (i.p.) | Sacrifice | ||
| TG3F (n=2) | 400 μl 3MPK Fisetin (i.p.) | 400 μl 3MPK Fisetin (i.p.) | 400 μl 3MPK Fisetin (i.p.) | 400 μl 3MPK Fisetin (i.p.) | 400 μl 3% TG (i.p.) | Sacrifice | ||
| TG9 (n=3) | 400 μl PBS (i.p.) | 400 μl PBS (i.p.) | 400 μl PBS (i.p.) | 400 μl PBS (i.p.) | 400 μl 3% TG (i.p.) | Sacrifice | ||
| TG9F (n=2) | 400 μl 3MPK Fisetin (i.p.) | 400 μl 3MPK Fisetin (i.p.) | 400 μl 3MPK Fisetin (i.p.) | 400 μl 3MPK Fisetin (i.p.) | 400 μl 3% TG (i.p.) | Sacrifice | ||
| TG24 (n=3) | 400 μl PBS (i.p.) | 400 μl PBS (i.p.) | 400 μl PBS (i.p.) | 400 μl PBS (i.p.) | 400 μl 3% TG (i.p.) | Sacrifice | ||
| TG24F (n=2) | 400 μl 3MPK Fisetin (i.p.) | 400 μl 3MPK Fisetin (i.p.) | 400 μl 3MPK Fisetin (i.p.) | 400 μl 3MPK Fisetin (i.p.) | 400 μl 3% TG (i.p.) | Sacrifice | ||
Table A: Study design, showing experimental groups and treatment regime.
The mice were sacrificed3 hours, 9 hours and 24 hours after the final treatments, and the following tissues were collected: peripheral blood (PB), serum, peritoneal fluid (PF), bone marrow (BM), spleen (Spl), Payer’s patch (PP), intestine (Ins), liver and kidney.
The following estimations and assays were done with the collected tissues: total cell count (TC), differential cell count (DC), nitric oxide (NO) estimation, catalase estimation and ascorbic acid estimation.
Total and differential cell count (TC/DC)
Differential white blood cell count is an examination and enumeration of the distribution of leukocytes in a stained blood smear. Increases in any of the normal leukocyte types or the presence of immature leukocytes or erythrocytes in peripheral blood are important diagnostically in a wide variety of inflammatory disorders.
The normal range of the leukocytes is:
• Neutrophils: 50-70%
• Lymphocytes: 20-40%
• Eosinophils: 0-6%
• Monocytes: 2-6%
• Basophils: 0-1%
The smear is stained with Hematoxylin, and counter- stained with Eosin.
Total cell counts of PB, PF, BM and Spl samples were taken, using Hemocytometry. Differential counts of PB and PF were taken. Quickly, 100 μl of each sample was added to appropriate wells of the cytospin, and the slides and filters were placed in the correct slots of the cytospin. The slides were centrifuged at 2000 rpm for 3 minutes. The slides were removed and air dried. They were then fixed with methanol, and air dried before staining. The fixed slides were placed in 100% Ethanol in a Coplin Jar for 5 minutes, followed by 10 minutes in 90% ethanol. They were then stained with hematoxylin for 5 minutes, rinsed in 70% ethanol, counterstained with eosin for 2 minutes, and again rinsed in 70% ethanol. Then they were placed in 100% ethanol for 1 minute, and then observed under the microscope.
The total cell count (TC) and the differential cell count (DC) were plotted against each sample using GraphPad Prism 6.
NO estimation
Activation of immune system is associated with increase in macrophage NO production. Transient nature of NO makes it unsuitable for detection, but it is oxidized to Nitrite (NO2 -) and Nitrate (NO3 -) by nitrate reductase. The concentrations of these anions are used as quantitative measure of NO production using the Griess reaction. In this reaction, acidified NO2 - produces a nitrosating agent, which reacts with sulfanillic acid to produce diazonium ion. This ion couples with NED (N-1-naphthyl ethylene diamine dihydrochloride) to form a coloured product that is measured spectrophotometrically at 540 nm.
The reaction was standardized using different concentrations of NaNO2, using the method in Promega User Guide (Product G2930). 50 μl of cells from each sample (PF, BM, Serum, Ins, and PP and Spl) from all the groups (Control, TG3, TG3F, TG9, TG9F, TG24, TG24F) were plated in the wells of a 96-well plate. The cells were incubated for 24 hours, in a CO2 incubator at 5% CO2, 37°C. Sulfanilamide solution was prepared by dissolving 1% Sulfanilamide in 5% orthophosphoric acid. 0.1% NED solution was prepared in distilled water. 50 μl of sulfanilamide solution was added to each well, and incubated at room temperature for 5 minutes, in dark. 50 μl of NED solution was then added, and incubated at room temperature for 5 minutes, in dark. Absorbance was measured in a plate reader at 540 nm. Using the standard curve prepared, the absorbance values of the samples were plotted to get the concentrations of NO produced (in μM). The concentrations of NO were plotted against each sample.
Catalase estimation
Catalase is an antioxidant enzyme, present in the peroxisomes of all aerobic organisms, that protects against harmful ROS (reactive oxygen species), produced during metabolism. Catalase concentration was measured in this study. 0.5 ml of culture medium supernatant (lung sample) was added to the reaction mixture containing 1 ml of 0.01 M phosphate buffer (pH 7.0), 0.5 ml of 0.2 M H2O2, and 0.4 ml of H2O. The reaction was stopped by adding 2 ml of acid reagent (dichromate/acetic acid), made by mixing 5% potassium dichromate with glacial acetic acid, in the ratio of 1:3 by volume. The tubes were heated for 10 minutes, and absorbance was measured at 610 nm using a spectrophotometer (Shimadzu). The concentration of catalase produced was determined from a standard curve.
Ascorbic acid estimation
L-Ascorbic acid (Vitamin C) is an antioxidant, free-radical scavenger, which is present in normal conditions to protect against ROS. Inflammation leads to a decrease in the concentration of ascorbic acid, which can be measured colorimetrically. The reaction mixture for quantification of ASA comprised 0.1 ml of the sample, 2.9 ml distilled water, 1 ml of 2% DNPH (Dinitrophenyl hydrazine) and 1-2 drops of thiourea. After incubation for 3 hours at 37°C, the osazone crystals formed were dissolved with 7 ml of 80% sulphuric acid. Absorbance was read after 30 minutes at 540 nm using a spectrophotometer. The concentration of ASA was determined from a standard curve.
Statistics
All data are presented as mean ± SEM, and only p values of less than 0.05 have been considered as significant. Graphs are plotted using GraphPad Prism 6.
In vitro cell proliferation assay
With 1 μg/ml LPS treatment: We found that administration of LPS has led to a 1.82 fold decrease (p<0.05) in cell viability, as compared to untreated control. Administration of fisetin has led to an increase (p<0.05), compared to LPS-treated cells, with the maximum increase with 20 μM fisetin (1.56 fold). This shows that fisetin is capable of restoring the cell’s proliferative capacity, which had been reduced with LPS treatment.
The absorbance of control, at 570 nm, is assumed to be for 100% viability. The viabilities of the other samples are calculated with respect to control, and plotted.
It is seen that the viability of cells treated with LPS is restored to 85% with 20 mM fisetin, indicating that it may be used as an optimal dose (Table 1, Figure 1).
| Fold change, with respect to | |||
|---|---|---|---|
| Percentage viability (%) | Control | LPS | |
| Control | 100.00 | ||
| LPS(1μg/ml) | 54.95 | (-) 1.82* | |
| LPS(1μg/ml)+50μM Fisetin | 62.95 | (+) 1.15* | |
| LPS(1μg/ml)+40μM Fisetin | 67.34 | (+) 1.23* | |
| LPS(1μg/ml)+30μM Fisetin | 70.72 | (+) 1.29* | |
| LPS(1μg/ml)+20 μM Fisetin | 85.48 | (+) 1.56* | |
| LPS(1μg/ml)+10μM Fisetin | 74.27 | (+) 1.35* | |
Table 1: Cell proliferation assay using MTT, on LPS and Fisetin treated RAW 264.7 macrophages. Fisetin leads to an increase (p<0.05) in cell viabilty, with maximum increase with 20μM fisetin.
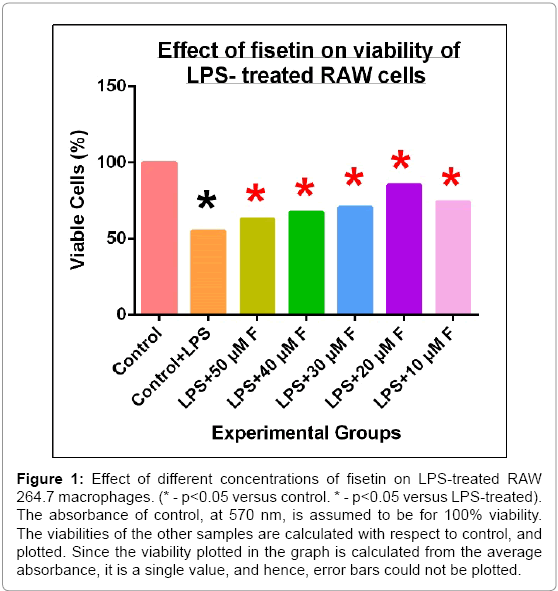
Figure 1: Effect of different concentrations of fisetin on LPS-treated RAW 264.7 macrophages. (* - p<0.05 versus control. * - p<0.05 versus LPS-treated). The absorbance of control, at 570 nm, is assumed to be for 100% viability. The viabilities of the other samples are calculated with respect to control, and plotted. Since the viability plotted in the graph is calculated from the average absorbance, it is a single value, and hence, error bars could not be plotted.
With 50 ng/ml PMA treatment: Here we demonstrated that administration of PMA has led to a 2.39 fold decrease (p<0.05) in cell viability, as compared to untreated control. Administration of fisetin has led to an increase (p<0.05), compared to LPS-treated cells, with the maximum increase with 10μM fisetin (2.23 fold). This shows that fisetin is capable of restoring the cell’s proliferative capacity, which had been reduced with PMA treatment. The absorbance of control, at 570 nm, is assumed to be for 100% viability. The viabilities of the other samples are calculated with respect to control, and plotted.
It is seen that the optimal dose of fisetin on PMA- treated cells is also 20 mM, even though the viability has increased even more with a lower dose of 10 mM (Table 2, Figure 2).
| Fold change, with respect to | |||
|---|---|---|---|
| Percentage viability (%) | Control | LPS | |
| Control | 100.00 | ||
| PMA(50ng/ml) | 41.76 | (-) 2.39* | |
| PMA(50ng/ml)+50μM Fisetin | 47.54 | (+) 1.14* | |
| PMA(50ng/ml)+40μM Fisetin | 49.07 | (+) 1.18* | |
| PMA(50ng/ml)+30μM Fisetin | 57.45 | (+) 1.38* | |
| PMA(50ng/ml)+20 μM Fisetin | 85.59 | (+) 2.05* | |
| PMA(50ng/ml)+10μM Fisetin | 93.16 | (+) 2.23* | |
Table 2: Cell proliferation assay using MTT, on PMA and Fisetin treated RAW 264.7 macrophages. Fisetin leads to an increase (p<0.05) in cell viabilty, with maximum increase with 10μM fisetin.
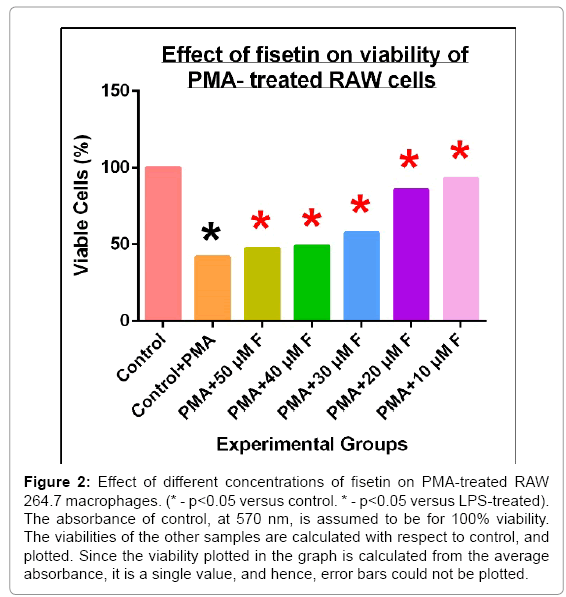
Figure 2: Effect of different concentrations of fisetin on PMA-treated RAW 264.7 macrophages. (* - p<0.05 versus control. * - p<0.05 versus LPS-treated). The absorbance of control, at 570 nm, is assumed to be for 100% viability. The viabilities of the other samples are calculated with respect to control, and plotted. Since the viability plotted in the graph is calculated from the average absorbance, it is a single value, and hence, error bars could not be plotted.
In-vitro cellular uptake of fisetin
The uptake of various concentrations of fisetin is assessed by fluorescent microscopy. We found that, maximum uptake occurs with 50 μM fisetin, and the uptake reduces with lower concentrations of fisetin (Figure 3).
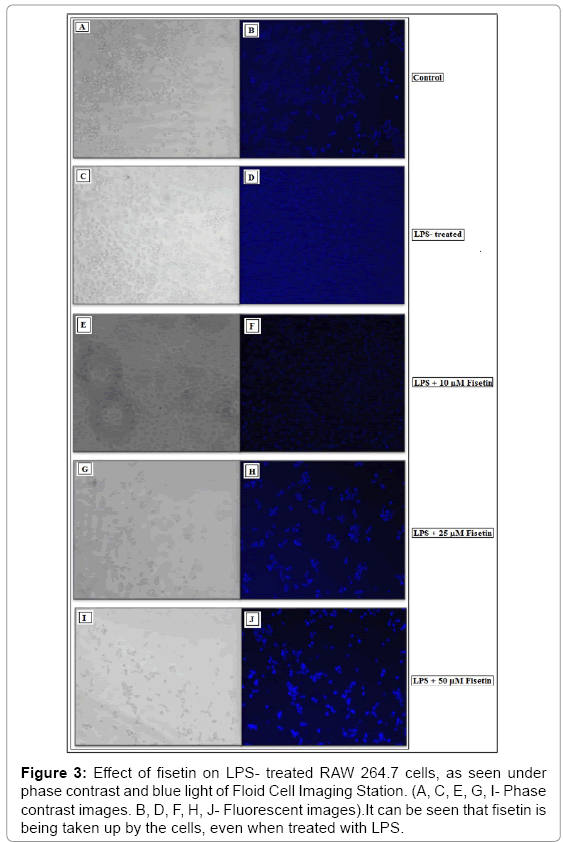
Figure 3: Effect of fisetin on LPS- treated RAW 264.7 cells, as seen under phase contrast and blue light of Floid Cell Imaging Station. (A, C, E, G, I- Phase contrast images. B, D, F, H, J- Fluorescent images).It can be seen that fisetin is being taken up by the cells, even when treated with LPS.
Total cell count (TC)
The total cell count in all the tissues has increased with treatment of TG, with the maximum increase after 24 hours. Fisetin has effectively inhibited cell recruitment in most of the tissues. This indicates that fisetin is capable of counteracting the inflammation caused by the TG.
Peritoneal fluid: The total cell count of peritoneal fluid has increased on treatment with only TG, as compared to control. There is a 1.61 fold increase (p<0.05) after 3 hours, a 2.03 fold increase (p<0.05) after 9 hours and a 3.35 fold increase (p<0.05) after 24 hours of treatment with TG, as compared to control. The cell count has decreased after treatment with fisetin, compared to only TG, after 3 hours (1.08 fold), 9 hours (1.19 fold) and after 24 hours (1.96 fold, p<0.05). The increase in TC with administration of fisetin indicates cell recruitment has occurred in response to the inflammation caused by TG. Large numbers of activated cells are recruited to the PF. Fisetin is successful in inhibiting cell recruitment, as shown by the decrease in TC (Table 3, Figure 4).
| PF | Cell Count (x 105) | Fold change, with respect to | |
|---|---|---|---|
| Control | TG | ||
| Control | 0.71 ± 0.02 | ||
| TG3 | 1.14 ± 0.06 | + 1.61* | |
| TG3F | 1.06 ± 0.03 | -1.08 | |
| TG9 | 1.44 ± 0.03 | +2.03* | |
| TG9F | 1.21 ± 0.12 | -1.19 | |
| TG24 | 2.38 ± 0.08 | +3.35* | |
| TG24F | 1.82 ± 0.05 | -1.31* | |
Table 3: Total cell count of peritoneal fluid, taken by hemocytometry. There is a 1.08 fold decrease after 3 hrs, a 1.19 fold decrease after 9 hrs and a 1.31 fold decrease (p<0.05) after 24 hrs of fisetin treatment.
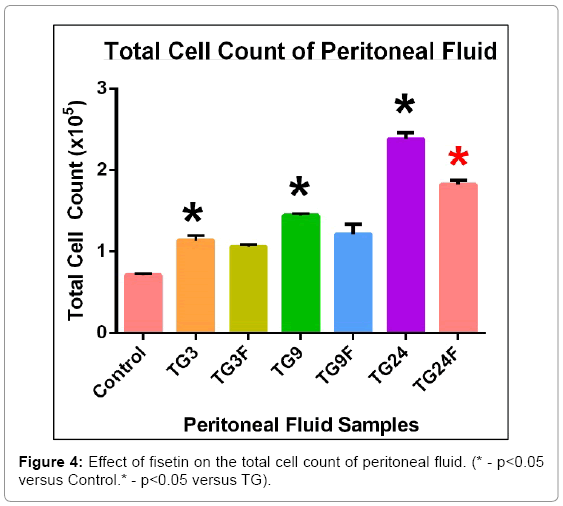
Figure 4:Effect of fisetin on the total cell count of peritoneal fluid. (* - p<0.05 versus Control.* - p<0.05 versus TG).
Bone marrow: The total cell count of bone marrow, the site of hematopoiesis, has increased on treatment with only TG, as compared to control, 3 hours (1.09 fold), 9 hours (1.48 fold) and 24 hours (1.72 fold) after treatment. This shows that inflammatory cells are being synthesized in response to the inflammation caused by TG. The cell count has decreased after treatment with Fisetin, compared to only TG, after 3 hours (1.15 fold), 9 hours (1.68 fold) and 24 hours (1.80 fold). The decrease in TC with fisetin is indicative of the reduction in inflammation, since synthesis of the cells is reduced (Table 4, Figure 5).
| BM | Cell Count (x 107) | Fold change, with respect to | |
|---|---|---|---|
| Control | TG | ||
| Control | 3.29 ± 0.04 | ||
| TG3 | 3.58 ± 0.07 | 1.09* | |
| TG3F | 3.12 ± 0.24 | -1.15 | |
| TG9 | 4.86 ± 0.10 | 1.48* | |
| TG9F | 2.89 ± 0.03 | -1.68* | |
| TG24 | 5.66 ± 0.24 | 1.72* | |
| TG24F | 3.14 ± 0.05 | -1.80* | |
Table 4: Total cell count of bone marrow, taken by hemocytometry. There is a 1.15 fold decrease after 3hrs, a 1.68 fold decrease after 9hrsand a 1.80 fold decrease after 24hrs of fisetin treatment.
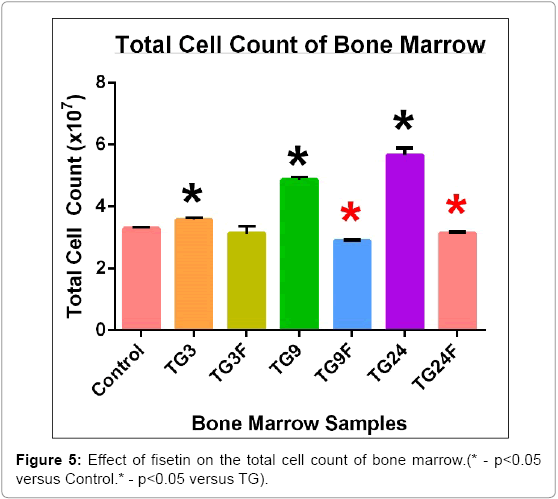
Figure 5: Effect of fisetin on the total cell count of bone marrow.(* - p<0.05 versus Control.* - p<0.05 versus TG).
Peripheral blood: The total cell count of peripheral blood has increased on treatment with only TG, as compared to control, 3 hours (1.46 fold), 9 hours (1.99 fold) and 24 hours (1.71 fold) after treatment. This increase indicates systemic inflammation caused by TG, which leads to greater number of cells in the blood for supply to tissues. The cell count has decreased after treatment with fisetin, compared to only TG, after 3 hours (1.20 fold), 9 hours (1.66 fold) and 24 hours (1.54 fold). Fisetin effectively inhibits cell recruitment (Table 5, Figure 6).
| PB | Cell Count (x 106) | Fold change, with respect to | |
|---|---|---|---|
| Control | TG | ||
| Control | 5.12±0.06 | ||
| TG3 | 7.48±0.03 | 1.46* | |
| TG3F | 6.24±0.05 | -1.20* | |
| TG9 | 10.22±0.02 | 1.99* | |
| TG9F | 6.16±0.01 | -1.66* | |
| TG24 | 8.74±0.06 | 1.71* | |
| TG24F | 5.66±0.06 | -1.54* | |
Table 5: Total cell count of peripheral blood, taken by hemocytometry. There is a 1.20 fold ecrease after 3hrs, a 1.66 fold decrease after 9hrsand a 1.54 fold decrease after 24hrs of fisetin treatment.
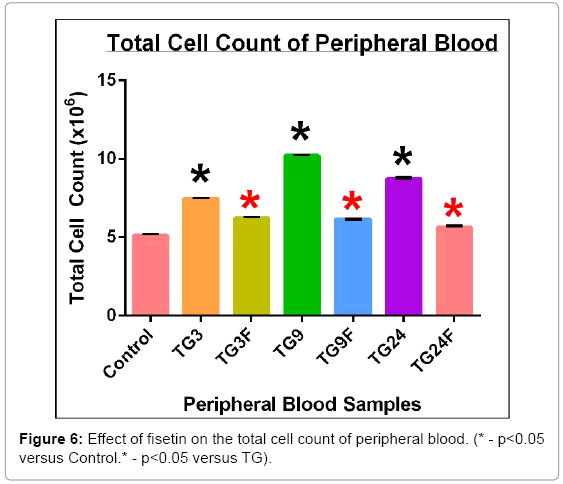
Figure 6: Effect of fisetin on the total cell count of peripheral blood. (* - p<0.05 versus Control.* - p<0.05 versus TG).
Spleen: The total cell count of spleen has increased on treatment with only TG, as compared to control. There is a 1.18 fold increase (p<0.05) after 3 hours, a 1.23 fold increase (p<0.05) after 9 hours and a 2.01 fold increase (p<0.05) after 24 hours of treatment. The cell count has decreased in all the samples after treatment with fisetin, compared to only TG. There is a 1.27 fold decrease (p<0.05) after 3 hours, a 1.41 fold decrease (p<0.05) after 9 hours and a 1.62 fold decrease (p<0.05) after 24 hours. This indicates that cell recruitment, which had increased as a response to the inflammation caused by TG, is successfully inhibited by fisetin (Table 6, Figure 7).
| Spl | Cell Count (x 107) | Fold change, with respect to | |
|---|---|---|---|
| Control | TG | ||
| Control | 6.04 ± 0.13 | ||
| TG3 | 7.15 ± 0.16 | +1.18* | |
| TG3F | 5.65 ± 0.11 | -1.27* | |
| TG9 | 7.42 ± 0.16 | +1.23* | |
| TG9F | 5.27 ± 0.21 | -1.41* | |
| TG24 | 12.13 ± 0.31 | +2.01* | |
| TG24F | 7.47 ± 0.13 | -1.62* | |
Table 6: Total cell count of spleen, taken by hemocytometry. There is a 1.27 fold decrease (p<0.05) after 3hrs, a 1.41 fold decrease (p<0.05) after 9hrsand a 1.62 fold decrease (p<0.05) after 24hrs of fisetin treatment.
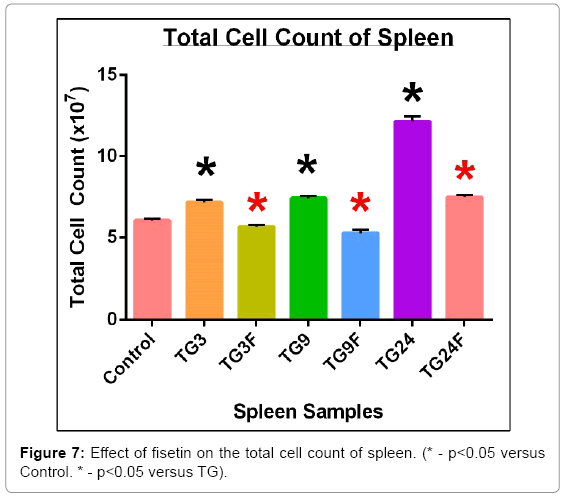
Figure 7: Effect of fisetin on the total cell count of spleen. (* - p<0.05 versus Control. * - p<0.05 versus TG).
Differential cell count (DC)
Peritoneal fluid: The differential count of peritoneal fluid, treated only with TG, shows an increase in the polymorpho-nuclear (PMN) cell count, as compared to control, 3 hours (2.01 fold), 9 hours (3.07 fold) and 24 hours (2.23 fold) after treatment. On treatment with fisetin, the PMN cell count decreases, compared to only TG, after 3 hours (1.34 fold), 9 hours (2.26 fold) and 24 hours (1.64 fold). The differential count of peritoneal fluid, treated only with TG, shows an increase in the mono-nuclear (MN) cell count, as compared to control, 3 hours (1.38 fold), 9 hours (2.02 fold) and 24 hours (3.14 fold) after treatment. On treatment with Fisetin, the MN cell count decreases, compared to only TG, after 3 hours (1.07 fold), 9 hours (1.60 fold) and 24 hours (2.14 fold) (Table 7, Figure 8).
| PF | Polymorphonuclear Cells | Mononuclear Cells | ||||
|---|---|---|---|---|---|---|
| Cell Count ( X104 ) | Fold change, with respect to | Cell Count ( X104 ) | Fold change, with respect to | |||
| Control | TG | Control | TG | |||
| Control | 2.10 | 3.20 | ||||
| TG3 | 4.22 | +2.01 | 4.40 | +1.38 | ||
| TG3+F | 3.16 | -1.34 | 4.12 | -1.07 | ||
| TG9 | 6.44 | +3.07 | 6.45 | +2.02 | ||
| TG9+F | 2.85 | -2.26 | 4.04 | -1.60 | ||
| TG24 | 4.68 | +2.23 | 10.04 | +3.14 | ||
| TG24+F | 2.85 | -1.64 | 4.66 | -2.14 | ||
Table 7: Differential cell count of peritoneal fluid, seen after HE staining, under light microscope. There is a 1.34 fold decrease in PMN cells and a 1.07 fold decrease in MN cells after 3 hrs, a 2.26 fold decrease in PMN cells and a 1.60 fold decrease on MN cells after 9 hrs, and a 1.64 fold decrease in PMN cells and a 2.14 fold decrease in MN cells after 24 hrs, of treatment with fisetin.
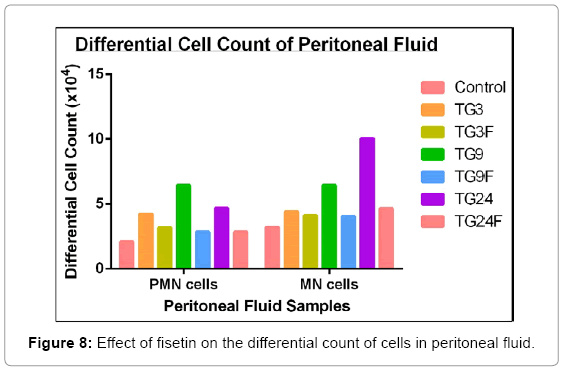
Figure 8: Effect of fisetin on the differential count of cells in peritoneal fluid.
Peripheral blood: The differential count of peripheral blood, treated only with TG, shows an increase in the polymorpho-nuclear (PMN) cell count, as compared to control, 3 hours (1.81 fold), 9 hours (2.90 fold) and 24 hours (3.26 fold) after treatment. On treatment with fisetin, the PMN cell count decreases, compared to only TG, after 3 hours (1.43 fold), 9 hours (1.45 fold) and 24 hours (2.37 fold). The differential count of PB, treated only with TG, shows an increase in the mono-nuclear (MN) cell count, as compared to control, 3 hours (1.50 fold), 9 hours (1.63 fold) and 24 hours (1.96 fold) after treatment. On treatment with fisetin, the MN cell count decreases, compared to only TG, after 3 hours (1.22 fold), 9 hours (1.46 fold) and 24 hours (1.72 fold) (Table 8, Figure 9).
| PB | Polymorphonuclear Cells | Mononuclear Cells | ||||
|---|---|---|---|---|---|---|
| Cell Count ( X104 ) | Fold change, with respect to | Cell Count ( X104 ) | Fold change, with respect to | |||
| Control | TG | Control | TG | |||
| Control | 1.80 | 5.24 | ||||
| TG3 | 3.26 | +1.81 | 7.88 | +1.50 | ||
| TG3+F | 2.28 | -1.43 | 6.48 | -1.22 | ||
| TG9 | 5.22 | +2.90 | 8.56 | +1.63 | ||
| TG9+F | 3.60 | -1.45 | 5.88 | -1.46 | ||
| TG24 | 5.87 | +3.26 | 10.26 | +1.96 | ||
| TG24+F | 2.48 | -2.37 | 5.98 | -1.72 | ||
Table 8: Differential cell count of peripheral blood, seen after HE staining, under light microscope. There is a 1.43 fold decrease in PMN cells and a 1.22 fold decrease in MN cells after 3 hrs, a 1.45 fold decrease in PMN cells and a 1.46 fold decrease on MN cells after 9 hrs, and a 2.37 fold decrease in PMN cells and a 1.72 fold decrease in MN cells after 24 hrs, of treatment with fisetin.
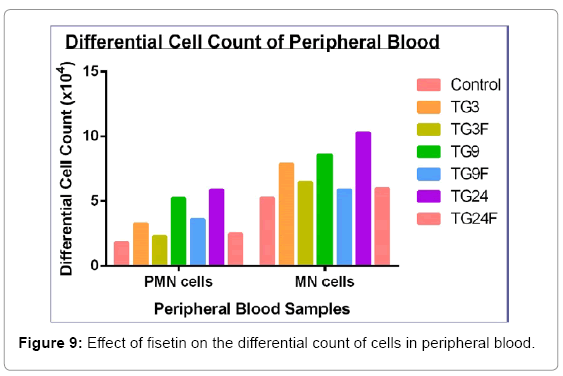
Figure 9: Effect of fisetin on the differential count of cells in peripheral blood.
NO estimation
The concentration of NO is found to have increased with TG, with the increase after 24 hours being significantly higher that at the beginning of the infection, i.e., after 3 hours. This is indicative of the fact that NO production in inflammation increases due to the upregulation of the iNOS (inducible NO synthase) gene, the upregulation of which occurs after about 18 hours of the onset of infection. Fisetin has been found to effectively reduce the production of NO, thereby reducing the inflammation to some extent.
Peritoneal fluid: The concentration of nitric oxide (NO) in peritoneal fluid has increased 1.49 fold after 3 hours (p<0.05), 1.52 fold after 9 hours (p<0.05) and 1.51 fold after 24 hours (p<0.05), after treatment with TG as compared to control. The NO concentration has decreased 1.29 fold after 3 hours, 1.18 fold after 9 hours and 1.23 fold after 24 hours (p<0.05) with fisetin, as compared to TG. The increase in NO concentration in peritoneal fluid on administration of TG indicates inflammation, which is reduced by the administration of Fisetin. The level of inflammation does not undergo much variation over time (Table 9, Figure 10).
| PF | NO Concentration (nM) | Fold change, with respect to | |
|---|---|---|---|
| Control | TG | ||
| Control | 4.52±0.17 | ||
| TG3 | 6.75±0.63 | +1.49* | |
| TG3F | 5.23±0.25 | -1.29 | |
| TG9 | 6.89±0.24 | +1.52* | |
| TG9F | 5.85±0.13 | -1.18 | |
| TG24 | 6.81±0.26 | +1.51* | |
| TG24F | 5.53±0.14 | -1.23* | |
Table 9: Concentration of NO produced in peritoneal fluid. There is a 1.29 fold decrease after 3 hrs, a 1.18 fold decrease after 9 hrs and a 1.23 fold decrease (p<0.05) after 24 hrs of fisetin treatment.
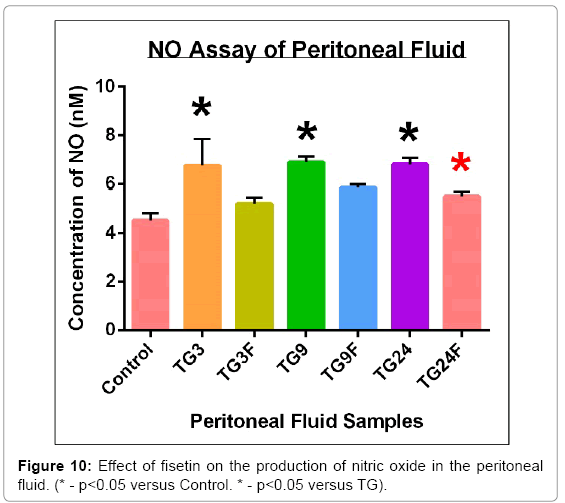
Figure 10: Effect of fisetin on the production of nitric oxide in the peritoneal fluid. (* - p<0.05 versus Control. * - p<0.05 versus TG).
Bone marrow: The concentration of nitric oxide (NO) in bone marrow has decreased 1.12 fold after 3 hours and 1.09 fold after 9 hours, but has increased 1.48 fold after 24 hours (p<0.05), after treatment with TG as compared to control. With fisetin treatment, the NO concentration has decreased 1.18 fold after 3 hours, 1.01 fold after 9 hours and 1.69 fold after 24 hours (p<0.05), compared to only TG. The increase in NO concentration in bone marrow on administration of TG after 24 hrs indicates inflammation, which is reduced by the administration of fisetin. There is not much change after 3 hrs and 9 hrs (Table 10, Figure 11).
| BM | NO Concentration (nM) | Fold change, with respect to | |
|---|---|---|---|
| Control | TG | ||
| Control | 4.92±0.16 | ||
| TG3 | 4.41±0.32 | -1.12 | |
| TG3F | 3.74±0.24 | -1.18 | |
| TG9 | 4.52±0.28 | -1.09 | |
| TG9F | 4.51±0.09 | -1.01 | |
| TG24 | 7.28±0.25 | +1.48* | |
| TG24F | 4.32±0.09 | -1.69* | |
Table 10: Concentration of NO produced in bone marrow. There is a 1.18 fold decrease after 3 hrs, a 1.01 fold decrease after 9 hrs and a 1.69 fold decrease (p<0.05) after 24 hrs of fisetin treatment.
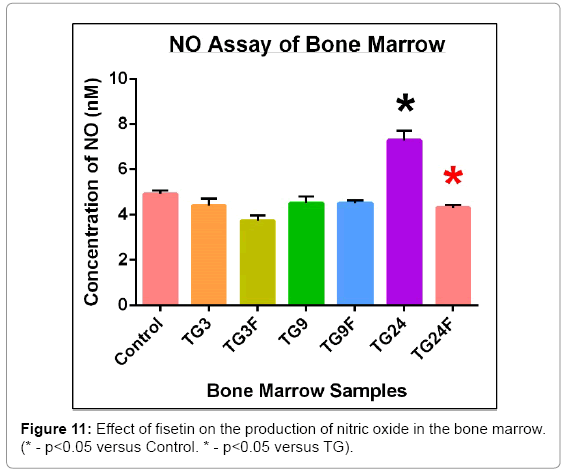
Figure 11: Effect of fisetin on the production of nitric oxide in the bone marrow. (* - p<0.05 versus Control. * - p<0.05 versus TG).
Serum: The concentration of nitric oxide (NO) in serum has decreased 1.13 fold after 3 hours (p<0.05) and 1.12 fold after 9 hours, but has increased 1.11 fold after 24 hours (p<0.05), after treatment with TG as compared to control. The NO concentration has decreased 1.23 fold after 3 hours (p<0.05) and 1.26 fold after 9 hours (p<0.05), but has remained almost same after 24 hours, with fisetin treatment. The increase in NO concentration in serum on administration of TG after 24 hrs indicates inflammation, which is reduced slightly by the administration of Fisetin. The NO concentration decreases after 3 hrs and 9 hrs, which is further reduced by Fisetin (Table 11, Figure 12).
| Ser | NO Concentration (nM) | Fold change, with respect to | |
|---|---|---|---|
| Control | TG | ||
| Control | 5.10±0.07 | ||
| TG3 | 4.51±0.09 | -1.13 | |
| TG3F | 3.68±0.18 | -1.23* | |
| TG9 | 4.55±0.21 | -1.12 | |
| TG9F | 3.60±0.10 | -1.26* | |
| TG24 | 5.66±0.16 | +1.11* | |
| TG24F | 5.66±0.06 | 1 | |
Table 11: Concentration of NO produced in serum. There is a 1.23 fold decrease (p<0.05) after 3 hrs, and a 1.26 fold decrease (p<0.05) after 9 hrs of fisetin treatment.
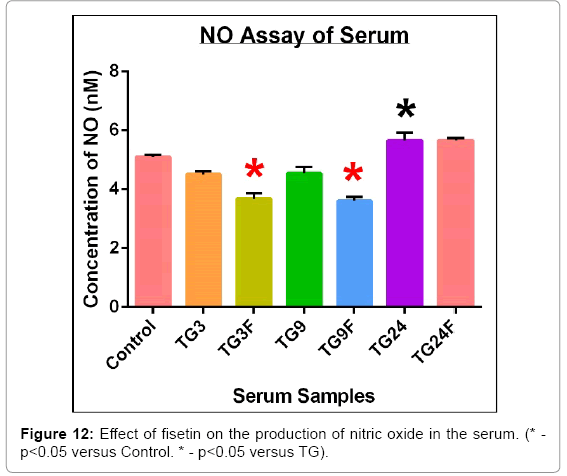
Figure 12: Effect of fisetin on the production of nitric oxide in the serum. (* - p<0.05 versus Control. * - p<0.05 versus TG).
Payer’s patch: The concentration of nitric oxide (NO) in Payer’s patch has increased 3.81 fold after 3 hours (p<0.05), 1.40 fold after 9 hours (p<0.05) and 2.38 fold after 24 hours (p<0.05), after treatment with TG as compared to control. The NO concentration has decreased 1.52 fold after 3 hours (p<0.05) and 1.91 fold after 24 hours (p<0.05) with fisetin, compared to only TG, but has increased 1.55 fold after 9 hours. The increase in NO concentration in Payer’s patch on administration of TG indicates inflammation, which is reduced by the administration of Fisetin after 3 hrs and 24 hrs (Table 12, Figure 13).
| PP | NO Concentration (nM) | Fold change, with respect to | |
|---|---|---|---|
| Control | TG | ||
| Control | 13.76±0.14 | ||
| TG3 | 52.48±0.11 | +3.81* | |
| TG3F | 34.48±1.54 | -1.52* | |
| TG9 | 19.23±0.13 | +1.40* | |
| TG9F | 29.75±0.33 | 1.55 | |
| TG24 | 32.75±0.12 | +2.38* | |
| TG24F | 17.13±0.87 | -1.91* | |
Table 12: Concentration of NO produced in Payer’s patch. There is a 1.52 fold decrease (p<0.05) after 3 hrs, and a 1.91 fold decrease (p<0.05) after 24 hrs of fisetin treatment.
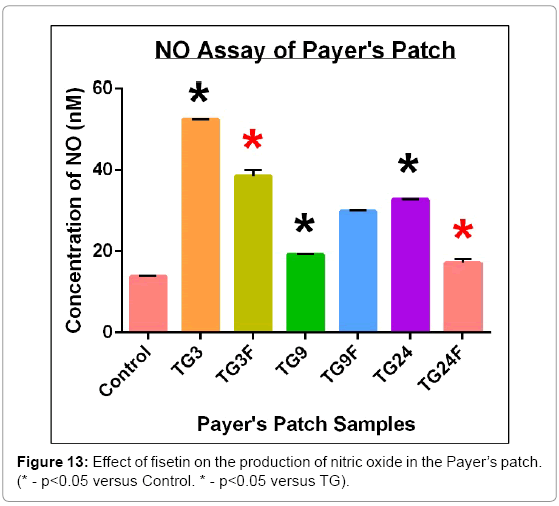
Figure 13: Effect of fisetin on the production of nitric oxide in the Payer’s patch. (* - p<0.05 versus Control. * - p<0.05 versus TG).
Intestine: The concentration of nitric oxide (NO) in the intestine has increased 2.69 fold after 3 hours (p<0.05), 1.17 fold after 9 hours (p<0.05) and 1.98 fold after 24 hours (p<0.05), after treatment with TG as compared to control. The NO concentration has decreased 1.96 fold after 3 hours (p<0.05), 1.63 fold after 9 hours (p<0.05) and 3.44 fold after 24 hours (p<0.05), with fisetin as compared to TG. The increase in NO concentration in intestine on administration of TG indicates inflammation, which is reduced by the administration of fisetin (Table 13, Figure 14).
| Ins | NO Concentration (nM) | Fold change, with respect to | |
|---|---|---|---|
| Control | TG | ||
| Control | 17.84±0.10 | ||
| TG3 | 48.06±0.08 | +2.69* | |
| TG3F | 24.48±0.48 | -1.96* | |
| TG9 | 20.79±0.12 | +1.17* | |
| TG9F | 12.73±0.32 | -1.63* | |
| TG24 | 35.36±0.23 | +1.98* | |
| TG24F | 10.28±0.23 | -3.44* | |
Table 13: Concentration of NO produced in intestine. There is a 1.96 fold decrease (p<0.05) after 3 hrs, a 1.63 fold decrease (p<0.05) after 9 hrs and a 3.44 fold decrease (p<0.05) after 24 hrs of fisetin treatment.
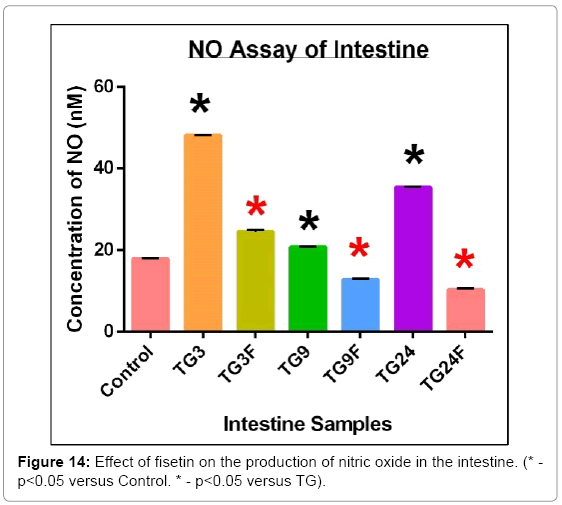
Figure 14: Effect of fisetin on the production of nitric oxide in the intestine. (* - p<0.05 versus Control. * - p<0.05 versus TG).
Spleen: The concentration of nitric oxide (NO) in the intestine has increased 1.90 fold after 3 hours (p<0.05) and 1.24 fold after 24 hours (p<0.05), after treatment with TG as compared to control, but has decreased slightly (1.01 fold) after 9 hours. The NO concentration has decreased 1.28 fold after 3 hours (p<0.05) and 2.15 fold after 24 hours (p<0.05) with fisetin treatment, compared to only TG, but has increased 1.20 fold after 9 hours. The increase in NO concentration in spleen on administration of TG indicates inflammation, which is reduced by the administration of fisetin (Table 14, Figure 15).
| Spl | NO Concentration (nM) | Fold change, with respect to | |
|---|---|---|---|
| Control | TG | ||
| Control | 4.14 ± 0.06 | ||
| TG3 | 7.88 ± 0.19 | +1.90* | |
| TG3F | 6.17 ± 0.27 | -1.28* | |
| TG9 | 4.09 ± 0.10 | -1.01 | |
| TG9F | 4.91 ± 0.88 | 1.2 | |
| TG24 | 5.15 ± 0.09 | +1.24* | |
| TG24F | 2.40 ± 0.24 | -2.15* | |
Table 14: Concentration of NO produced in spleen. There is a 1.28 fold decrease (p<0.05) after 3 hrs, and a 2.15 fold decrease (p<0.05) after 24 hrs of fisetin treatment.
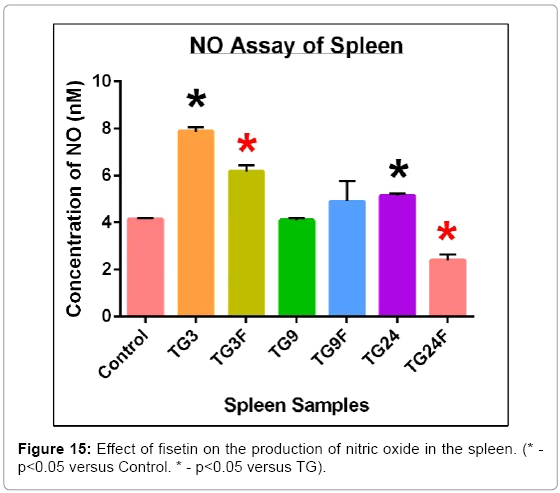
Figure 15: Effect of fisetin on the production of nitric oxide in the spleen. (* - p<0.05 versus Control. * - p<0.05 versus TG).
Catalase estimation
Peritoneal fluid: The concentration of catalase in peritoneal fluid has decreased on treatment with only TG, as compared to control, 3 hours (1.25 fold), 9 hours (1.81 fold) and 24 hours (1.62 fold) after treatment. The catalase concentration has increased after treatment with Fisetin, compared to only TG, after 9 hours (1.23 fold) and 24 hours (1.07 fold), but has decreased after 3 hours (1.12 fold) (Table 15, Figure 16).
| PF | Catalase Concentration (pM) | Fold change, with respect to | |
|---|---|---|---|
| Control | TG | ||
| Control | 18.89 ± 0.16 | ||
| TG3 | 15.14 ± 0.17 | -1.25 | |
| TG3F | 13.58 ± 0.23 | -1.12 | |
| TG9 | 10.45 ± 0.14 | -1.81 | |
| TG9F | 12.88 ± 0.12 | 1.23 | |
| TG24 | 11.69 ± 0.12 | -1.62 | |
| TG24F | 12.53 ± 0.28 | 1.07 | |
Table 15: Concentration of catalase produced in peritoneal fluid. There is a 1.12 fold decrease after 3 hrs of fisetin treatment.
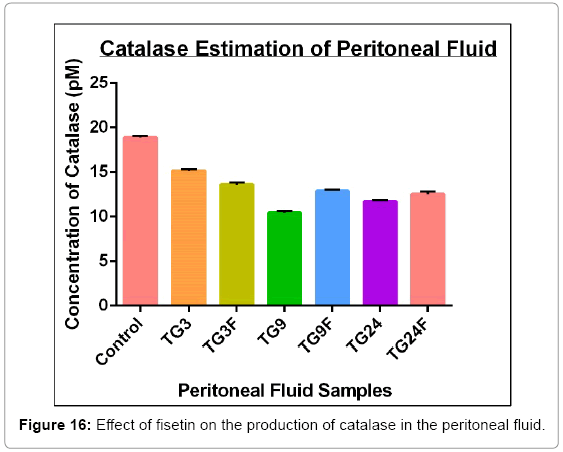
Figure 16: Effect of fisetin on the production of catalase in the peritoneal fluid.
Bone marrow: The concentration of catalase in bone marrow has decreased after 9 hours (1.16 fold) and 24 hours (1.15 fold), on treatment with only TG, as compared to control, but has increased 3 hours (1.04 fold) after treatment. The catalase concentration has increased after treatment with fisetin, compared to only TG, after 3 hours (1.12 fold), 9 hours (1.36 fold) and 24 hours (1.27 fold) (Table 16, Figure 17).
| BM | Catalase Concentration (pM) | Fold change, with respect to | |
|---|---|---|---|
| Control | TG | ||
| Control | 16.89 ± 0.12 | ||
| TG3 | 17.55 ± 0.18 | +1.04* | |
| TG3F | 19.56 ± 0.34 | 1.12 | |
| TG9 | 14.58 ± 0.16 | -1.16 | |
| TG9F | 19.89 ± 0.16 | 1.36 | |
| TG24 | 14.71 ± 0.07 | -1.15 | |
| TG24F | 18.61 ± 0.07 | 1.27 | |
Table 16: Concentration of catalase produced in bone marrow. There is a 1.04 fold increase (p<0.05) after 3 hrs of TG treatment.
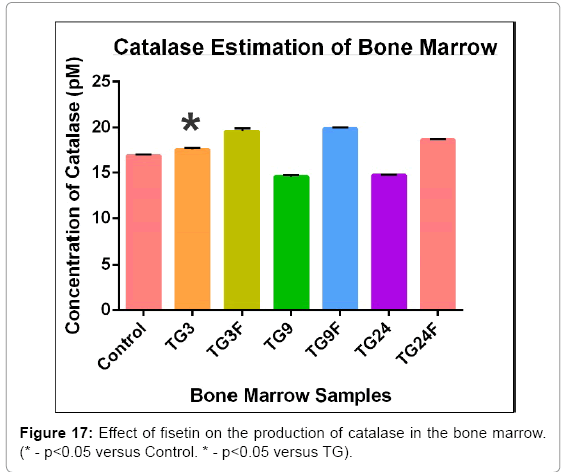
Figure 17: Effect of fisetin on the production of catalase in the bone marrow. (* - p<0.05 versus Control. * - p<0.05 versus TG).
Serum: The concentration of catalase in serum has decreased on treatment with only TG, as compared to control, 3 hours (1.41 fold), 9 hours (1.95 fold) and 24 hours (1.34 fold) after treatment. The catalase concentration has increased after treatment with Fisetin, compared to only TG, after 3 hours (1.11 fold), 9 hours (1.55 fold) and 24 hours (1.09 fold) (Table 17, Figure 18).
| Ser | Catalase Concentration (pM) | Fold change, with respect to | |
|---|---|---|---|
| Control | TG | ||
| Control | 15.81 ± 0.07 | ||
| TG3 | 11.22 ± 0.18 | -1.41 | |
| TG3F | 12.41 ± 0.10 | 1.11 | |
| TG9 | 8.09 ± 0.04 | -1.95 | |
| TG9F | 12.53 ± 0.08 | 1.55 | |
| TG24 | 11.82 ± 0.08 | -1.34 | |
| TG24F | 12.92 ± 0.06 | 1.09 | |
Table 17: Concentration of catalase produced in serum.
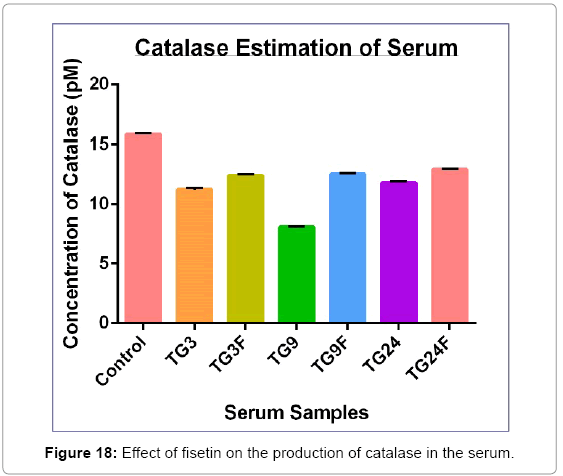
Figure 18: Effect of fisetin on the production of catalase in the serum.
Payer’s patch: The concentration of catalase in Payer’s patch has decreased on treatment with only TG, as compared to control, 3 hours (1.05 fold) after treatment, but has increased significantly (p<0.05) after 9 hours (1.08 fold) and 24 hours (1.69 fold). The catalase concentration has increased after treatment with fisetin, compared to only TG, after 3 hours (1.02 fold), but has remained almost unchanged after 9 hours, and has decreased 1.29 fold after 24 hours (p<0.05) (Table 18, Figure 19).
| PP | Catalase Concentration (pM) | Fold change, with respect to | |
|---|---|---|---|
| Control | TG | ||
| Control | 19.59 ± 0.25 | ||
| TG3 | 18.61 ± 0.19 | -1.05 | |
| TG3F | 19.04 ± 0.04 | 1.02 | |
| TG9 | 21.22 ± 0.10 | +1.08* | |
| TG9F | 21.20 ± 0.10 | 1 | |
| TG24 | 33.15 ± 0.08 | +1.69* | |
| TG24F | 25.70 ± 0.18 | -1.29* | |
Table 18: Concentration of catalase produced in Payer’s patch. There is a 1.29 fold decrease (p<0.05) after 9 hrs of fisetin treatment.
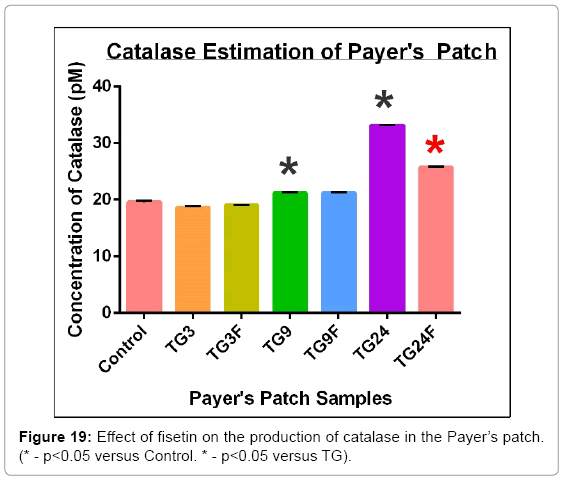
Figure 19: Effect of fisetin on the production of catalase in the Payer’s patch. (* - p<0.05 versus Control. * - p<0.05 versus TG).
Intestine: The concentration of catalase in intestine has decreased on treatment with only TG, as compared to control, 1.17 fold after 3 hours, 1.91 fold after 9 hours and 1.96 fold after 24 hours after treatment. The catalase concentration has increased after treatment with fisetin, compared to only TG, after 3 hours (1.09 fold), 9 hours (1.09 fold) and 24 hours (1.16 fold) (Table 19, Figure 20).
| Ins | Catalase Concentration (pM) | Fold change, with respect to | |
|---|---|---|---|
| Control | TG | ||
| Control | 53.09 ± 0.16 | ||
| TG3 | 45.55 ± 0.25 | -1.17 | |
| TG3F | 49.44 ± 0.04 | 1.09 | |
| TG9 | 27.79 ± 0.13 | -1.91 | |
| TG9F | 30.17 ± 0.39 | 1.09 | |
| TG24 | 27.10 ± 0.11 | -1.96 | |
| TG24F | 31.44 ± 0.34 | 1.16 | |
Table 19: Concentration of catalase produced in intestine.
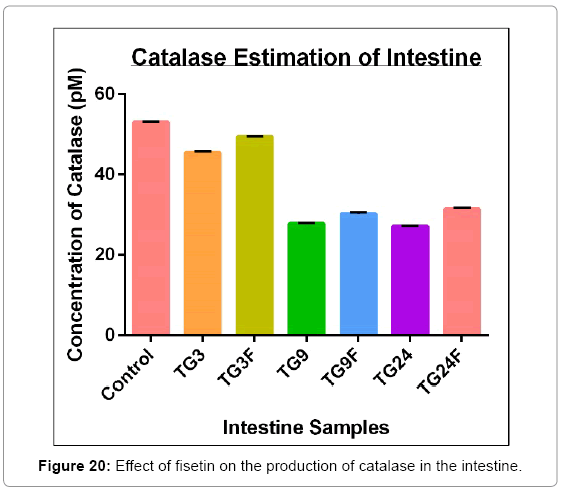
Figure 20: Effect of fisetin on the production of catalase in the intestine.
Spleen: The concentration of catalase in spleen has decreased on treatment 1.07 fold after 3 hours, 1.81 fold after 9 hours and 1.03 fold after 24 hours, with only TG, as compared to control. The catalase concentration has increased after treatment with fisetin, compared to only TG, after 3 hours (1.07 fold), 9 hours (2.71 fold) and 24 hours (1.46 fold) (Table 20, Figure 21).
| Spl | Catalase Concentration (pM) | Fold change, with respect to | |
|---|---|---|---|
| Control | TG | ||
| Control | 15.62 ± 0.13 | ||
| TG3 | 14.64 ± 0.19 | -1.07 | |
| TG3F | 15.71 ± 0.15 | 1.07 | |
| TG9 | 8.61 ± 0.27 | -1.81 | |
| TG9F | 23.29 ± 0.39 | 2.71 | |
| TG24 | 15.18 ± 0.12 | -1.03 | |
| TG24F | 22.17 ± 1.49 | 1.46 | |
Table 20: Concentration of catalase produced in spleen.
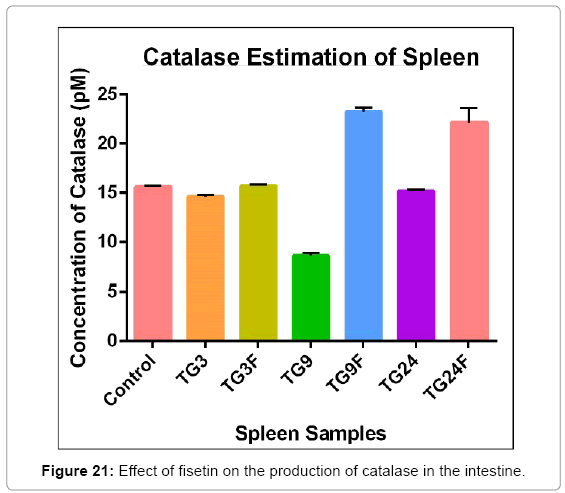
Figure 21: Effect of fisetin on the production of catalase in the intestine.
Ascorbic acid estimation
Ascorbic acid content gives an idea about the anti-oxidant effects of a product. TG causes a decrease in the ascorbic acid content of the tissues, which is restored by fisetin.
Peritoneal fluid: The concentration of ascorbic acid in peritoneal fluid has increased 1.06 fold after 3 hours, 1.02 fold after 9 hours and 1.05 fold after 24 hours, on treatment with only TG, as compared to control. The ASA concentration has increased significantly (p<0.05) after treatment with fisetin, compared to only TG, after 3 hours (1.38 fold), 9 hours (1.44 fold) and 24 hours (2.19 fold) (Table 21, Figure 22).
| PF | ASA Concentration (nM) | Fold change, with respect to | |
|---|---|---|---|
| Control | TG | ||
| Control | 13.36±0.12 | ||
| TG3 | 14.09±0.16 | 1.06 | |
| TG3F | 19.48±0.73 | +1.38* | |
| TG9 | 13.68±0.25 | 1.02 | |
| TG9F | 19.70±0.30 | +1.44* | |
| TG24 | 13.98±0.06 | 1.05 | |
| TG24F | 30.63±2.37 | +2.19* | |
Table 21: Concentration of ASA produced in peritoneal fluid. There is a 1.38 fold increase (p<0.05) after 3 hrs, a 1.44 fold increase (p<0.05) after 9 hrs and a 2.19 fold increase (p<0.05) after 24 hrs of fisetin treatment.
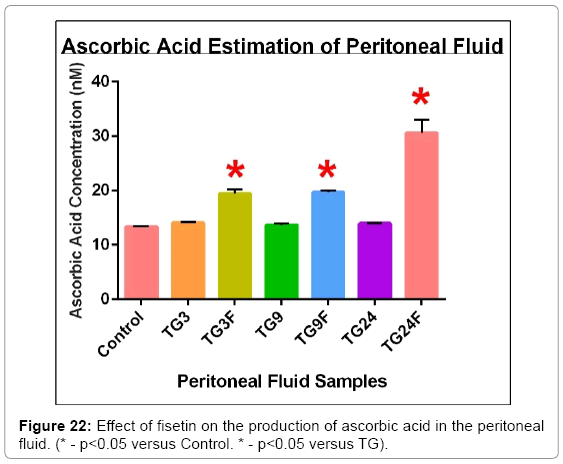
Figure 22: Effect of fisetin on the production of ascorbic acid in the peritoneal fluid. (* - p<0.05 versus Control. * - p<0.05 versus TG).
Bone marrow: The concentration of ascorbic acid in bone marrow has decreased 1.11 fold after 3 hours (p<0.05) and 1.02 fold after 9 hours, on treatment with only TG, as compared to control. It has increased slightly after 24 hours (1.03 fold). The ASA concentration has increased significantly (p<0.05) after treatment with fisetin, compared to only TG, after 3 hours (1.14 fold), 9 hours (1.50 fold) and 24 hours (1.47 fold) (Table 22, Figure 23).
| BM | ASA Concentration (nM) | Fold change, with respect to | |
|---|---|---|---|
| Control | TG | ||
| Control | 15.27±0.07 | ||
| TG3 | 13.79±0.09 | -1.11* | |
| TG3F | 15.65±0.15 | +1.14* | |
| TG9 | 14.91±0.16 | -1.02 | |
| TG9F | 22.37±0.13 | +1.50* | |
| TG24 | 15.77±0.22 | 1.03 | |
| TG24F | 23.23±0.37 | +1.47* | |
Table 22: Concentration of ASA produced in bone marrow. There is a 1.14 fold increase (p<0.05) after 3 hrs, a 1.50 fold increase (p<0.05) after 9 hrs and a 1.47 fold increase (p<0.05) after 24 hrs of fisetin treatment.
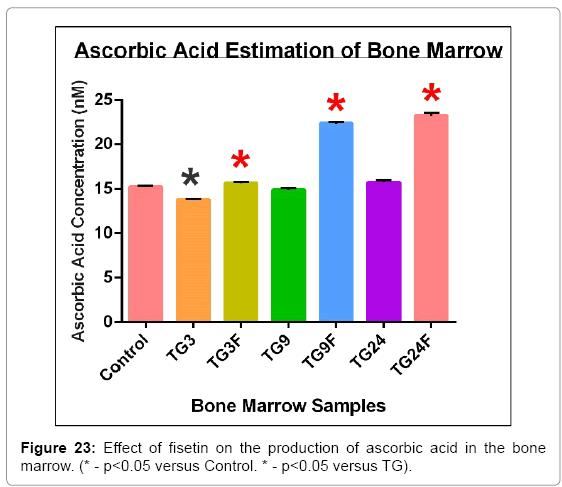
Figure 23: Effect of fisetin on the production of ascorbic acid in the bone marrow. (* - p<0.05 versus Control. * - p<0.05 versus TG).
Serum: After treatment with only TG, as compared to control, the concentration of ascorbic acid in serum has decreased 1.01 fold, 3 hours after treatment, but has increased after 9 hours (1.07 fold) and 24 hours (1.03 fold). The ASA concentration has increased significantly (p<0.05) after treatment with fisetin, compared to only TG, after 3 hours (1.15 fold), 9 hours (1.69 fold) and 24 hours (1.47 fold) (Table 23, Figure 24).
| Ser | ASA Concentration (nM) | Fold change, with respect to | |
|---|---|---|---|
| Control | TG | ||
| Control | 22.42±0.22 | ||
| TG3 | 22.18±0.31 | -1.01 | |
| TG3F | 25.45±0.55 | +1.15* | |
| TG9 | 23.97±0.22 | 1.07 | |
| TG9F | 40.39±1.61 | +1.69* | |
| TG24 | 23.05±0.17 | 1.03 | |
| TG24F | 33.91±0.35 | +1.47* | |
Table 23: Concentration of ASA produced in serum. There is a 1.15 fold increase (p<0.05) after 3 hrs, a 1.69 fold increase (p<0.05) after 9 hrs and a 1.47 fold increase (p<0.05) after 24 hrs of fisetin treatment.
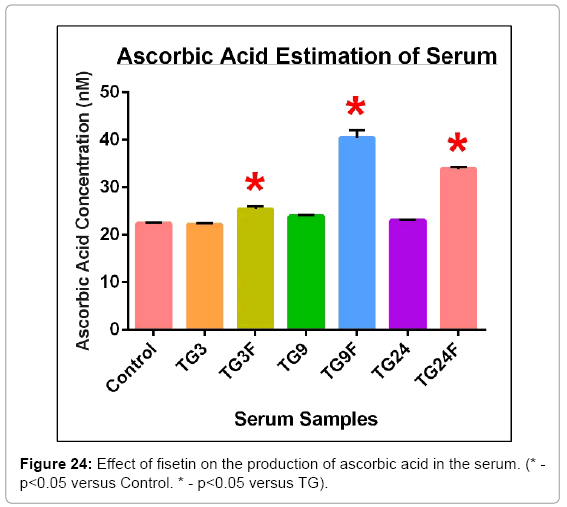
Figure 24: Effect of fisetin on the production of ascorbic acid in the serum. (* - p<0.05 versus Control. * - p<0.05 versus TG).
Payer’s patch: The concentration of ascorbic acid in Payer’s patch has decreased significantly (p<0.05) on treatment with only TG, as compared to control, 3 hours (1.07 fold), 9 hours (2.16 fold) and 24 hours (1.79 fold) after treatment. The ASA concentration has increased 1.05 fold after 9 hours and 1.52 fold after 24 hours (p<0.05) after treatment with fisetin, compared to only TG, but has decreased 1.12 fold after 3 hours (Table 24, Figure 25).
| PP | ASA Concentration (nM) | Fold change, with respect to | |
|---|---|---|---|
| Control | TG | ||
| Control | 61.06±0.12 | ||
| TG3 | 57.21±0.22 | -1.07* | |
| TG3F | 50.99±1.01 | -1.12 | |
| TG9 | 28.27±0.17 | -2.16* | |
| TG9F | 29.80±0.60 | 1.05 | |
| TG24 | 34.14±0.08 | -1.79* | |
| TG24F | 51.73±1.47 | +1.52* | |
Table 24: Concentration of ASA produced in Payer’s patch. There is a 1.05 fold increase (p<0.05) after 9 hrs and a 1.52 fold increase (p<0.05) after 24 hrs of fisetin treatment.
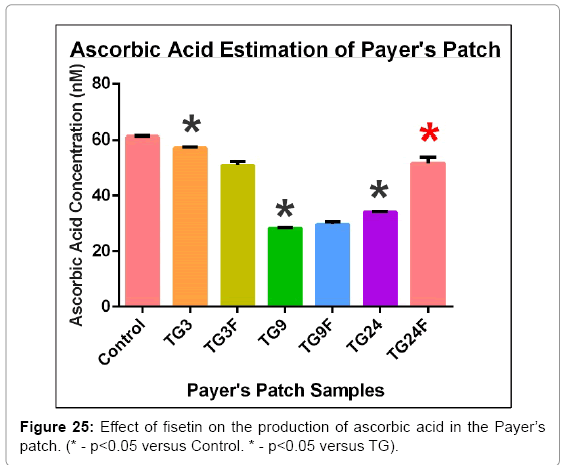
Figure 25: Effect of fisetin on the production of ascorbic acid in the Payer’s patch. (* - p<0.05 versus Control. * - p<0.05 versus TG).
Intestine: The concentration of ascorbic acid in intestine has decreased significantly (p<0.05) on treatment with only TG, as compared to control, 3 hours (1.36 fold), 9 hours (3.21 fold) and 24 hours (1.91 fold) after treatment. The ASA concentration has increased significantly (p<0.05) after treatment with fisetin, compared to only TG, after 3 hours (1.30 fold) and 9 hours (1.27 fold), but has decreased after 24 hours (1.11 fold) (Table 25, Figure 26).
| Ins | ASA Concentration (nM) | Fold change, with respect to | |
|---|---|---|---|
| Control | TG | ||
| Control | 75.25±0.20 | ||
| TG3 | 55.22±0.13 | -1.36 | |
| TG3F | 72.01±0.19 | +1.30* | |
| TG9 | 23.46±0.12 | -3.21 | |
| TG9F | 29.85±0.25 | +1.27* | |
| TG24 | 39.32±0.18 | -1.91 | |
| TG24F | 35.38±0.43 | -1.11 | |
Table 25: Concentration of ASA produced in intestine. There is a 1.30 fold increase (p<0.05) after 3 hrs and a 1.27 fold increase (p<0.05) after 9 hrs of fisetin treatment.
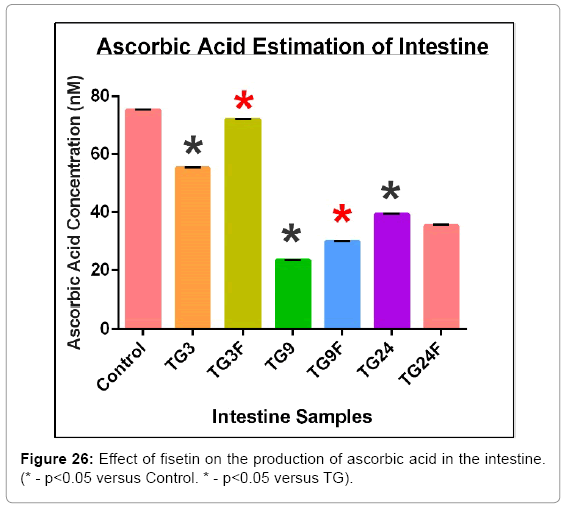
Figure 26: Effect of fisetin on the production of ascorbic acid in the intestine. (* - p<0.05 versus Control. * - p<0.05 versus TG).
Spleen: The concentration of ascorbic acid in spleen has decreased significantly (p<0.05) on treatment with only TG, as compared to control, 3 hours (1.44 fold), 9 hours (1.17 fold) and 24 hours (1.13 fold) after treatment. The ASA concentration has increased significantly (p<0.05) after treatment with fisetin, compared to only TG, after 3 hours (1.90 fold), 9 hours (2.92 fold) and 24 hours (1.76 fold) (Table 26, Figure 27).
| Spl | ASA Concentration (nM) | Fold change, with respect to | |
|---|---|---|---|
| Control | TG | ||
| Control | 16.24±0.09 | ||
| TG3 | 14.19±0.11 | -1.44* | |
| TG3F | 26.95±0.05 | +1.90* | |
| TG9 | 13.93±0.06 | -1.17* | |
| TG9F | 40.74±0.66 | +2.92* | |
| TG24 | 14.35±0.13 | -1.13* | |
| TG24F | 25.28±0.32 | +1.76* | |
Table 26: Concentration of ASA produced in spleen. There is a 1.90 fold increase (p<0.05) after 3 hrs, a 2.92 fold increase (p<0.05) after 9 hrs and a 1.76 fold increase (p<0.05) after 24 hrs of fisetin treatment.
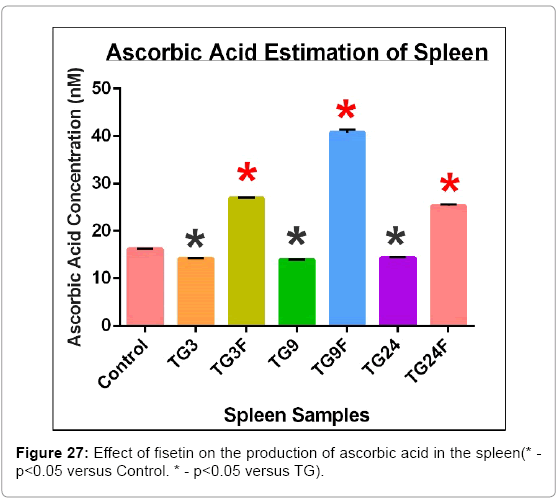
Figure 27: Effect of fisetin on the production of ascorbic acid in the spleen(* - p<0.05 versus Control. * - p<0.05 versus TG).
In this present study, we have induced peritonitis in C57BL/6J mice using thioglycollate, and then assessed the anti-inflammatory effects of plant flavonoid, fisetin, when administered prophylactically, by in vitro and in vivo assays. We have also induced inflammation on RAW macrophages, and seen the effect of fisetin on them. We have used fisetin which is traditionally used to treat different inflammationrelated diseases. We found that fisetin had a positive prophylactic effect on the peritonitis. This is the first evidence showed that fisetin may have prophylactic effect against thethioglycollate-induced peritonitis in mice.
Intraperitoneal infection known as peritonitis is a major killer in the practice of clinical surgery and it is also one of the most frequent diagnoses in a surgical intensive care unit (ICU) leading to severe sepsis [31]. Intra-abdominal sepsis, although it affects all age groups, takes a greater toll on the elderly population than it does on younger populations. In approximately 80% of the patients with a secondary peritonitis, the initial surgical intervention may sanitize the abdominal cavity from the infectious lesion. The remaining patients develop a persisting peritonitis with a considerable number of subsequent surgical interventions, infectious complications, a high rate of severe sepsis, and septic shock as well as mortality double as high ranging between 30 and 63% [32-34]. Hospital acquired infections especially the tertiary peritonitis (TP) have the highest mortality. High mortality is the consequence of the large number of difficult clinical courses and high rates of severe sepsis and septic shock. Several authors defined TP as a diffuse, therapy-resistant peritonitis with fungi or low-grade pathogenic bacteria in the absence of a well-defined infective focus after apparently adequate therapy [35-38]. Primary peritonitis is also known as spontaneous bacterial peritonitis and has a low incidence on surgical ICUs as it is managed purely without any surgical intervention and mostly by physician. Secondary peritonitis is the most common entity in critical surgical patients and is defined as an infection of the peritoneal cavity resulting from hollow viscous perforation, ischemic necrosis, or other injuries of the gastrointestinal tract [39]. There is significant difference between the microbial flora in tertiary and secondary peritonitis and tertiary peritonitis comprises of mostly opportunistic and nosocomial facultative pathogenic bacteria and fungi (e.g., Enterococci, Enterobacter and Candida). The development of multidrug resistance has also been observed in microbes causing TP due to use of broad spectrum antibiotic therapy [15]. Due to the character of disease, medical treatment for secondary and tertiary peritonitis differs considerably.
Peritonitis remains as a serious complication influencing patients’ mortality [40]. In the process of peritonitis, bacteria are the main source of local and systemic infections. Bacterial pathogens and their products trigger the inflammatory response by transcriptional activation of inflammatory genes, leading to the release of large number of inflammatory mediators, including cytokines, chemokines, adhesion molecules, reactive oxygen and so on, which can easily cause sepsis when they are uncontrolled and excessive [41]. Previous investigators found that acute peritonitis was associated with the activation of the transcription factor NF-κB in various organs and tissues, which can regulate the synthesis of TNF-α, IL-6 and many other molecules involved in the inflammatory reaction [42-45]. The spectrum of peritonitis in India continues to differ from western countries.
Flavonoids are polyphenol compounds, widely distributed in plant foods, which may exert beneficial effects in various diseases. Many of the biological actions of flavonoids have been attributed to their antioxidant properties [46]. The highest levels of fisetin, a flavonoid compound (160 μg/g) are found in strawberries with 5–10 fold lower levels in apples and persimmons and smaller amounts in kiwi fruit, peaches, grapes, tomatoes, onions and cucumbers [47,48]. Emerging data from in vitro and in vivo studies indicate that fisetin possesses antiproliferative properties against several cancers [49,50].
In our study, cells treated with inflammatory agents like LPS and PMA lose their viability and their proliferative capacity. Fisetin has been shown to prevent the loss of viability when given prophylactically, and at low concentrations. Cellular uptake studies have shown that, cells take up the fisetin, so it can act from within the cell, although the exact mechanism is not yet known. We also found that, total cell recruitment increases with the administration of TG, showing that it has induced inflammation, and the body is synthesizing more immune cells to counter the infection. Cell recruitment was successfully inhibited by fisetin. Nitric acid is produced by macrophages as a defence against oxidative stress. Catalase is produced by cells to break down harmful ROS. Ascorbic acid, an antioxidant, is normally present in the body to protect against ROS. In case of inflammation, both NO and catalase content are expected to increase, but ascorbic acid content is expected to decrease. Our assays have shown this to be the case, except with catalase. The NO content of the tissues have increased with TG challenge, and has decreased with fisetin. The ASA concentration has decreased with TG, and has increased significantly with fisetin treatment. These results confirm the anti- inflammatory properties of fisetin. Plant-derived natural products contributed significantly to drug discovery in the past and still provide an effective source for new drug development. Although fisetin is not particularly abundant in many fruits and vegetables, the incorporation of significant quantities of fisetin-rich foods into the diet of diseased patients might provide an alternative approach.
In conclusion, peritonitis continues to be an important problem in the health care system. Fisetin, has recently received some attention for its beneficial effects against several diseases. Our research study showed that the use of fisetin could effectively reduce the severity of acute peritonitis in our rodent model. Further studies need to be done to verify the effect of flavonoid compound, explore the mechanisms and promote the clinical use. An accurate biomarker for the early identification of peritonitis would be of great diagnostic value. An early finding of the correct diagnosis of peritonitis and the subsequent effective initiation of an appropriate treatment may help to lower the complication rate and to improve the prognosis.
KM performed all experiments, SM analyzed data, SB gave valuable input to the manuscript, AS and NRJ have prepared the MCN, and ERB initiated the project with her idea, designed the experiments, analyzed all data and wrote the manuscript.
The authors wish to acknowledge UGC for providing fellowship and contingency grant to SM, ICMR for providing a Research Associate ship to SB and to WB DBT, and SERB for funding the project of which ERB is the PI, and provide funds for infrastructure development and necessary funds to undertake expenses related to the project. The authors also acknowledge Sattar Sekh and Manisha Murmu for technical help and Priyanka Dutta for her support for all purchase and accounts related activities critical for the smooth running of the project.