Research Article - (2012) Volume 1, Issue 1
Inflammatory Breast Cancer (IBC) is arguably the most severe form of breast cancer with a very high mortality rate. IBC is distinct from other forms of breast cancer expressing unique cell surface markers such as hypoglycosylated MUC1. However, treatment options for IBC are limited. Calcitriol is a potential treatment for IBC due to its potential role as a therapeutic in other forms of cancer. Our previous research demonstrated that calcitriol inhibits the metastatic ability of the SUM149 IBC cell line. However, high concentration of calcitriol would be required for treatment. This may result I serious side effects such as hypercalcemia. Targeting calcitriol directly to the tumor site would allow for treatment without toxic levels of calcitriol. Here we developed SM3MUC1 antibody conjugated calcitriol bound QDs as a novel nanoparticles probe. We demonstrate that these particles can be used to target to MUC1 over-expressing IBC cells in vitro and in vivo. Therefore these particles can be used to determine the localization of IBC emboli in vivo and maybe used as a potential vehicle to deliver high doses of calcitriol to the IBC tumors and metastasis.
Keywords: Inflammatory Breast Cancer (IBC); Calcitriol; Quantum dots; Mucin-1 (MUC1); Antibody
With its aggressive nature and high mortality rate, Inflammatory Breast Cancer (IBC) is arguably the most deadly form of breast cancer [1]. Even with new multimodality treatments, <45% of those treated with combined chemotherapy, radiation, and surgery survive 5-years after diagnosis [1,2]. Approximately 1/3 of IBC tumors are triple negative since they do not express the estrogen, progesterone, and HER-2 receptors and therefore have fewer options for adjuvant therapy [2]. IBC is molecularly unique from other forms of breast cancer, having expression trends opposite that of conventional breast cancers [3]. Of note, expression MUC1 tends to be increased in IBC while lost in other breast cancers [3]. IBC tumors are highly metastatic, invading the dermal lymphatic vessels of the skin overlying the breast [1-3]. The presence of tumor emboli in the dermal lymphatic vessels is a hallmark of IBC and thought to contribute to the rapid and prolific spread of the disease [2,3]. Therefore, treatments that prevent cell migration and prevent or disrupt the formation of emboli could be effective for IBC.
Due to its potential role as a therapeutic in other cancer types, calcitriol, the active form of Vitamin D3, was explored by our laboratory as a possible treatment for IBC [4,5]. Using the triple negative IBC cell line SUM149, compared with the MDA-MB-231 cell-type of originmatched non-IBC cell line, we demonstrated that 100 nM calcitriol significantly decreases in vitro migration and invasion of IBC SUM149 cell line, without significant effect against the non-IBC cell line [5]. Calcitriol also has significant effects decreasing the size of IBC emboli grown in vitro and reducing the number of experimental metastasis in vivo [5].
Healthy serum levels of calcitriol are below 50 pg/ml (0.12 nM) and higher levels result in hypercalcemia [6,7]. A dose of 0.25 μg of calcitriol can be taken safely daily as a treatment, while higher doses of 0.5 μg leading to hypercalcemia [7]. In our previous study 100 nM calcitriol is used on the IBC cells to exert its effect, the equivalent of 250 μg of calcitriol, which would lead to hypercalcemia in a patient. Therefore, methods for specifically targeting calcitriol to the tumor are needed in order to get a biological response without hypercalcemia.
Mucin-1 (MUC1) is a glycoprotein that is expressed apically on the surface of epithelial cells [8]. The amount of O-linked glycosylation on MUC1 often decreases in epithelial carcinomas as they increase in the severity of the metastasis [8,9]. This characteristic of altered glycosylation can be exploited for cancer therapy. Antibodies against the various glycosylated forms of MUC1 have been developed and are highly specific. IBC over expresses a hypoglycosylated form of MUC1 that is recognized by the SM3 MUC1 monoclonal antibody clone [9,10]. If calcitriol is linked to this antibody, it can be targeted to IBC cells. The HMPV clone of MUC1 is a monoclonal antibody that can be used as a positive control since it targets all forms of MUC1 [11]. We have created a successful protocol for conjugating calcitriol to MUC1 antibodies via a QD scaffold.
Previously, we developed a stable biologically active fluorescent probe that allows the direct imaging of calcitriol in vitro [12]. Calcitriol is conjugated to quantum dots (QDs) using an esterification reaction to create CalQDs [12]. Quantum dots are semiconductor nanoparticles and have been used for in vivo imaging and when injected subdermally or intravenously in mice they localize in the liver, lymph nodes, kidney, and spleen [13-17]. However, it is has been hypothesized that the QD coating may have an impact on their localization [13]. Additionally, QDs may be toxic due to the CdSe core. However, recent studies showed no toxic side effects in monkeys after three months to one year [18]. In order for CalQDs to be effectively explored as a treatment in vivo, the CalQDs must be targeted directly to the tumor site to avoid potential hypercalcemia and toxicity that results from high levels of calcitriol in serum. Antibodies have been successfully conjugated to QDs with functional targeting ability [19]. Conjugating CalQDs to antibodies that target the tumor site would allow much lower levels of Calcitriol to be added to serum while still retaining a high concentration at the treatment site. So, we developed SM3 MUC1 conjugated CalQDs (SM3 CalQDs) and HMPV MUC1 conjugated CalQDs (HMPV CalQDs) as a control [20].
In this current study we determined if we could specifically target calcitriol to IBC tumors using quantum dots conjugated to calcitriol and the SM3 antibody. Therefore we tested the ability of SM3 CalQDs to induce biological activity in vitro and to target to IBC cells in vitro and in vivo. We examined the distribution of SM3 CalQDs in vivo. Here we demonstrate that SM3 CalQDs accumulate in tumor tissue in vivo. This suggests that targeted calcitriol can potentially be used as therapeutic for IBC.
Cell culture
C2C12 (ATCC Manassas, VA) mouse myoblast cell lines are grown with DMEM media with 10% FBS, 1% L-Glutamine (Fisher Scientific, Pittsburg, PA), and 1% Penicillin/Streptomycin (100 IU/ml Penicillin, 100 μg/ml Streptomycin, Fisher Scientific, Pittsburg, PA) at 37°C and 5% CO2.
SUM149 IBC cell lines are grown with Ham’s F12 media with 5% FBS, 1% L-Glutamine (Fisher Scientific, Pittsburg, PA), 0.1% Hydrocortisone (Sigma-Aldrich, St. Louis, MO), 1% Antibiotic/ Antimycotic (Gemini Bio-products, West Sacramento, CA), 1% ITS Cocktail (Thermo Scientific HyClone, South Logan, UT), and 1% Penicillin/Streptomycin (100 IU/ml Penicillin, 100 μg/ml Streptomycin, Fisher Scientific, Pittsburg, PA) at 37°C and 5% CO2.
Conjugation of calcitriol to quantum dots
Qdot® 525 ITK™, Qdot® 605 ITK™, Qdot® 655 ITK™, and Qdot® 800 ITK™ and carboxyl Quantum Dots (QDs) were purchased from Invitrogen, Carlsbad, CA, 8 μM). Calcitriol was obtained from (Cayman Chemical Co., Ann Arbor, MI) dissolved in dimethylsulfoxide (DMSO, Fisher Scientific, Pittsburg, PA) to yield a 5 mM stock solution. N,N’- Dicyclohexylcarbodiimide (DCC, AnaSpec, Inc., Freemont, CA), was prepared in DMSO fresh as a 17 mM stock solution.
In order to conjugate calcitriol to QDs, 800 nM solution of QDs in PBS (pH 7.2) and 100 μM calcitriol were mixed in a total volume of 50 μl of DMSO. 340 μM of DCC in DMSO was added to initiate the coupling process. As a control, unbound QDs and DCC were mixed in the absence of calcitriol. When additionally conjugated with antibodies, 50 μM of calcitriol and 50 μM of SM3 Mucin-1 antihuman mouse antibody (eBioscience Inc., San Diego, CA) or HMPV Mucin-1 anti-human mouse antibody (BD Biosciences, San Jose, CA) are added in place of 100 μM calcitriol. The reaction was carried out at room temperature for 30 minutes and excess DCC was removed by adding 100 μl of PBS. Separation of calcitriol linked QDs from unspecific reactants was achieved by size exclusion chromatography using Sephadex G-50 (Pharmacia Fine Chemicals St. Louis, MO) and sterile water.
Transfections
Cells were grown to 95% confluency before replacing media with media lacking serum (FBS). After 18 hours serum starvation, the media was changed to normal media and they were transfected or mock transfected with 2 μg of VDRE-luc (Promega, Madison, Wisconsin) and PRL-luc (Promega, Madison, Wisconsin) per 1.5 ml of media for reporter gene assays using Turbofect (Fermentas, Glen Burnie, ML) according to the manufacturers protocol. After four to six hours of transfection, the media is changed. After 24 hours the cells were stimulated with 10 nM MUC1 conjugated QDs, calcitriol bound QDs, calcitriol (Cayman Chemical Co. Ann Arbor, MI), or Control QDs (Invitrogen, Carlsbad, CA).
Reporter gene assay
After 24 hours after stimulation, cells were lysed with 1X Passive Lysis Buffer (Biotium, Hayward, CA). Reporter gene assay was performed using the Firefly and Renilla Luciferase Assay Kit (30005-2) (Biotium, Hayward, CA). Luciferase activity was measured in triplicate using the MicroLumat LB 96P plate reader. Luminosity values were calculated by averaging the three trials with the three triplicates, and normalizing to a non-stimulated control.
Live cell imaging
Cells were plated onto glass bottom dishes and grown to 95% confluency at 37°C and 5% CO2 for two days. Cells were treated with 3 nM MUC1 conjugated calcitriol bound QDs (SM3 CalQDs or HMPV CalQDs) or CalQDs (CalQDs) prepared as stated previously 2 hours before imaging. As a control, QDs not coated with calcitriol were used (ConQDs). Some cell dishes were left untreated as the control. 20 minutes before imaging cells were stained with 20 μM of Hoechst 33342 (Thermo Scientific, West Palm Beach, FL) fluorescent nucleus stain. Cells were stained with 158 μM Fm4-64 (Invitrogen, Carlsbad, CA) membrane stain. They were then imaged on the Zeiss LSM 510 Live5 Confocal Microscope and z-stacks of healthy cells were performed. Images were collected using Plan-Apochromat 100x/1.40 DIC M27 and are 90.0 μm × 90.0 μm in size. The following settings were used: Filters were used: Track 2 Ch1, 668-700 Track 1 Ch2 : BP 420- 480, Track 2 Ch3 : BP 505-550. Beam splitters: MBS : HFT 405/488/561, DBS1 : NFT 635 VIS, and DBS2 : NFT 490. The Lasers were: Track 1 405 nm: 2.5 %, Track 2 488 nm: 5.0%. Images were taken using lasers of 405 nm wavelength for the Hoechst stain and 488 nm for the FM 464 stain and the 525 nm QDs. The pinhole was set to: Track 2 Ch1 :134 μm, Track 1 Ch2 :134 μm, Track 2 ChS1 :134 μm. Cells with good membrane and nucleus stains that best represent what was generally seen for each treatment were selected.
3D imaging and measurements
In LSM Image Examiner, selected z-stacks were made into projection images with all image slices put together into one image. ImageJ was used to create image slices of the selected z-stacks and to adjust the brightness and contrast of the images. A plug-in for ImageJ called Volume Viewer was used to create vertical image slices showing the side views of selected cells. The maximum and minimum displayed values of the channels were altered to better visualize the cells. The image slices were formatted in Coral Photo-Paint X4 with an adjustment to the tone curve to enhance the brightness and contrast of the channels. The channel displaying QDs was set at a level to better display the difference between ConQD and CalQD treatments, so that ConQDs were set to show a very low intensity. The channel adjustments were kept constant for each figure.
The z-stacks were put into Volocity 5.5, where they were made into three dimensional projection images with all image slices put together into one image. Volocity 5.5 was used to measure the mean pixel intensity of the CalQDs in the cytoplasm, which was calculated by subtracting the dark field from the mean intensities. Cytoplasmic and nuclear auto-fluorescence was subtracted from the green intensity values with the green 525 nm QDs (Invitrogen, Carlsbad, CA). The control treatments with no QDs were set at zero by subtracting their mean intensity from each treatment.
QD standard curve of QDs on the IVIS lumina
100 μl of QDs at 525 nm, 605 nm, 655 nm, and 800 nm at varying concentrations were placed in microcentrifuge tubes under the Vivo Vision IVIS Lumina (Xenogen) and imaged for 1 minute with small binning and a fluorescent Fstop of 4. They were imaged with the GFP/ ICG emission excitation filters for 800 nm, the GFP/DsRed for 605 nm and 655 nm, and the GFP/GFP for 525 nm. ImageJ was used to measure the values of the pixels in the images taken, which was given as the intensity of the QDs.
Injection of SM3 CalQDs, CalQDs and ConQDs into nude mice with IBC tumors
Nineteen 13-16 week old female female athymic nude mice (Nu/ nu) (Charles River, Wilmington, MA) were divided into 3 random groups and injected subdermally on the left flank with 5×10⁵ SUM149 cells per mouse. The SUM149 cell line has a 60% tumor-take rate. Those mice bearing tumor were allowed to continue with tumors grown to 80 mm3. Mice without palpable tumor were included in the experiment as a comparison. After 6 weeks the mice were intravenously injected via tail vein with Infrared 800 nm 100 μl 40 nM Control QDs synthesized without calcitriol, SM3 conjugated calcitriol bound QDs, or calcitriol bound QD. The synthesized particles were diluted with 10% 10X PBS and sterile water. Mice were imaged on the Vivo Vision IVIS Lumina (Xenogen) for 3 minutes with small binning and a fluorescent Fstop of 1 with the GFP/ICG emission excitation filters once a day for 3 days, then sacrificed on day 4. The settings were adjusted to ensure that the intensity observed on the IVES lumina system fell within the linear region of the calibration curve for the QDs. The lungs and tumors were isolated and imaged on the IVIS Lumina. Images were adjusted for brightness and contrast in ImageJ. The mean fluorescent pixel intensity of lungs was measured using the histogram function in ImageJ.
Histology
Mice were euthanized using Carbon dioxide (CO2) followed by cervical dislocation for confirmatory measures. Organs were extracted within 1 hour of sacrifice and fixed in for 48 hrs in 10% neutral buffered formalin and was stored in 70% ethanol (EtOH) until paraffin embedding. Sections of 6 μm thick were cut using a microtome from the paraffin embedded blocks. The tissue sections were dehydrated and deparaffinized using xylene treatments and were washed with EtOH to remove xylene [21-23]. Sections were stained with for nucleus with Hoechst dye and Muc-1 using the antibodies described above.
Organs and imaging
The lung and tumor cross-section images were collected using W Plan-Apochromat 20X/1.0 DIC M27 75 mm and are 423.87 μm × 425.03 μm in size. To confirm the accumulation of SM3-QDs in the tumor emboli in the lungs, z-stacks were collected using 63x/1.4 oil immersion objectives. The images were 146 μm × 146 μm in size. For both objectives the following settings were used: Filters were used: Track 1 Ch1, 493 – 628, Track 1 Ch2 : 638 – 747, Track 2 ChS1 : 430- 683. Beam splitters: Track 1 MBS : MBS 488, Track 1 MBS_InVis : PlateTrack 1, DBS1 : Mirror Track 2, MBS : Plate, Track 2 MBS InVis : MBS-405, and Track 2 DBS1 : Mirror. Lasers for 63X objective: Track 1 488 nm: 15.0%, Track 2405 nm: 2.0 % Lasers for 20x objective: Track 1488 nm: 6.0%, Track 2 405 nm: 2.0%. Images were taken using lasers of 405 nm wavelength for the Hoechst stain and 488 nm for the 800 nm QDs, autofluorescence, or the SM3 MUC1 antibody stain. The pinhole was set to: Track 1 Ch1 : 304 μm, Track 1 Ch2 : 304 μm, Track 2 ChS1 : 302 μm. Images collected in the Ch2 were corrected for autofluorescence. As control images were taken of control tumors from mice without injection. No signal was detected in the red channel (data not shown).Images were created using ImageJ software.
To target calcitriol to IBC cells, CalQDs were conjugated with two clones of anti-human mouse MUC1 antibodies, SM3 and HMPV. The SM3 clone was used to target IBC cells, while the HMPV clone was used to target normal and cancerous epithelial tissue [9,11].
Uptake of CalQDs and SM3-QDs into SUM149 cells in vitro
First we examined the uptake of the particles to confirm their ability to enter SUM149 cells, an IBC cell line and C2C12 cells (myotubes) as a control cell line. QDs treatments were added to Sum149 and C2C12 cells two hours before imaging.
When tested in vitro, the SM3 CalQDs and HMPV CalQDs had a significantly higher intensity of QDs in the cytoplasm and nucleus of SUM149 cells than the unconjugated control quantum dots (ConQDs; Figure 1). Also, the CalQDs conjugated with either of the MUC1 antibodies had a slightly greater cytoplasmic and nuclear intensity than the CalQDs alone.
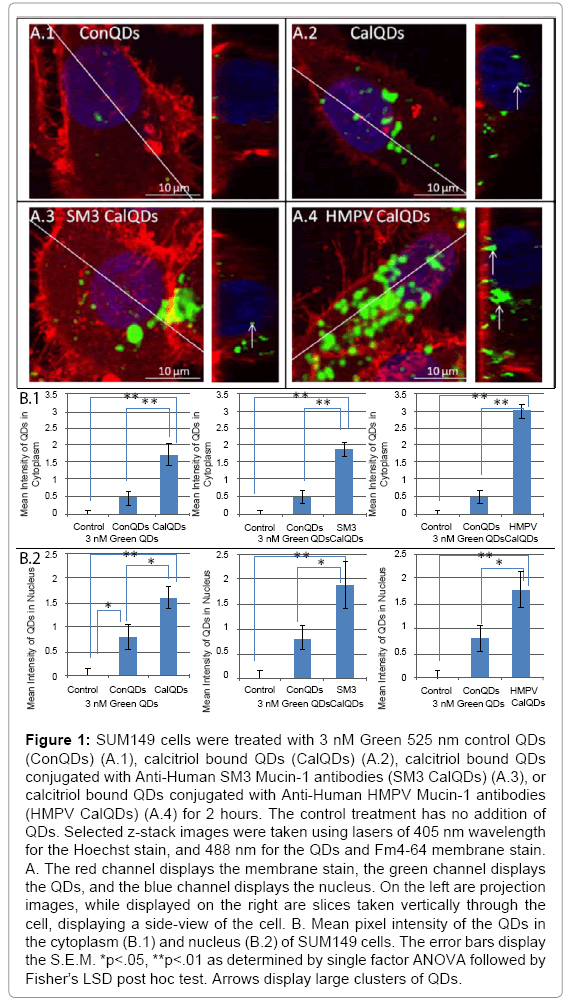
Figure 1: SUM149 cells were treated with 3 nM Green 525 nm control QDs (ConQDs) (A.1), calcitriol bound QDs (CalQDs) (A.2), calcitriol bound QDs conjugated with Anti-Human SM3 Mucin-1 antibodies (SM3 CalQDs) (A.3), or calcitriol bound QDs conjugated with Anti-Human HMPV Mucin-1 antibodies (HMPV CalQDs) (A.4) for 2 hours. The control treatment has no addition of QDs. Selected z-stack images were taken using lasers of 405 nm wavelength for the Hoechst stain, and 488 nm for the QDs and Fm4-64 membrane stain. A. The red channel displays the membrane stain, the green channel displays the QDs, and the blue channel displays the nucleus. On the left are projection images, while displayed on the right are slices taken vertically through the cell, displaying a side-view of the cell. B. Mean pixel intensity of the QDs in the cytoplasm (B.1) and nucleus (B.2) of SUM149 cells. The error bars display the S.E.M. *p<.05, **p<.01 as determined by single factor ANOVA followed by Fisher’s LSD post hoc test. Arrows display large clusters of QDs.
When the MUC1 antibody conjugated CalQDs were added to mouse C2C12 myoblast cells, which are not targets of anti-human antibodies, while they had a significantly greater cytoplasmic intensity of QDs (p<0.05) than ConQDs, the SM3 CalQDs did not have a significantly greater intensity in the nucleus. The HMPV CalQDs intensity maintained significance compared to the ConQDs. In comparison, the CalQDs had a significantly greater intensity of QDs in the cytoplasm (p<0.01) and nucleus (p<0.05) than the ConQDs (Figure 2).
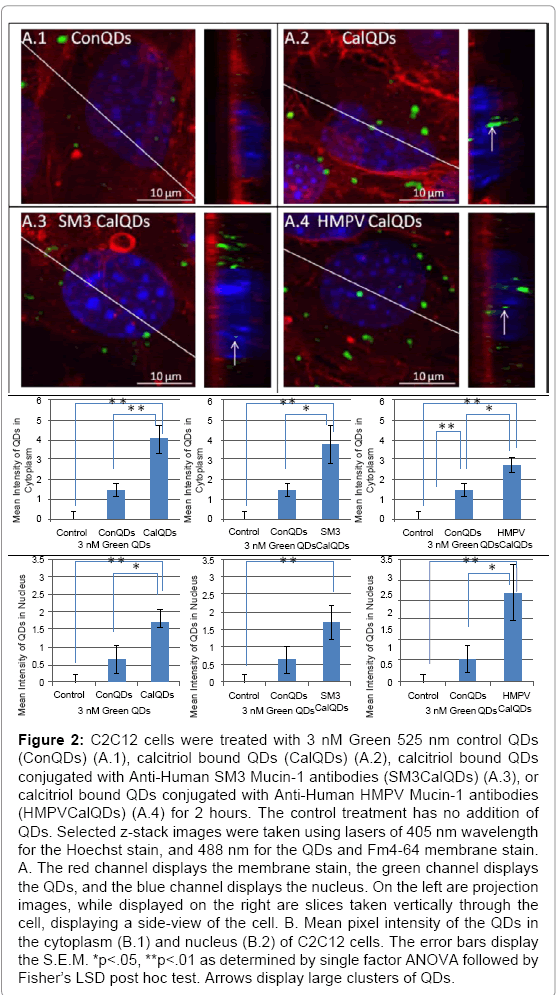
Figure 2: C2C12 cells were treated with 3 nM Green 525 nm control QDs (ConQDs) (A.1), calcitriol bound QDs (CalQDs) (A.2), calcitriol bound QDs conjugated with Anti-Human SM3 Mucin-1 antibodies (SM3CalQDs) (A.3), or calcitriol bound QDs conjugated with Anti-Human HMPV Mucin-1 antibodies (HMPVCalQDs) (A.4) for 2 hours. The control treatment has no addition of QDs. Selected z-stack images were taken using lasers of 405 nm wavelength for the Hoechst stain, and 488 nm for the QDs and Fm4-64 membrane stain. A. The red channel displays the membrane stain, the green channel displays the QDs, and the blue channel displays the nucleus. On the left are projection images, while displayed on the right are slices taken vertically through the cell, displaying a side-view of the cell. B. Mean pixel intensity of the QDs in the cytoplasm (B.1) and nucleus (B.2) of C2C12 cells. The error bars display the S.E.M. *p<.05, **p<.01 as determined by single factor ANOVA followed by Fisher’s LSD post hoc test. Arrows display large clusters of QDs.
Determining the Biological Activity of SM3-QDs
In order for the SM3 CalQD probe to be an effective therapeutic against IBC, the biological activity of the calcitriol within the complex must be functional. To determine this, a reporter gene assay was performed using VDRE-Luc construct, which responds to the activation of VDR and is therefore sensitive to calcitriol [20]. So, we stimulated SUM149 cells transfected with VDRE-Luc with SM3 CalQDs, as a positive control, CalQDs, or as a negative control, QDs.
The reporter gene assay showed that the SM3 CalQDs induced similar luciferase reporter expression as CalQDs and calcitriol alone, and had significantly more luciferase expression than the ConQDs (Figure 3). These results suggest that CalQDs conjugated with MUC1 antibodies are successfully taken up by the cells and induce calcitriolmediated biological activity.
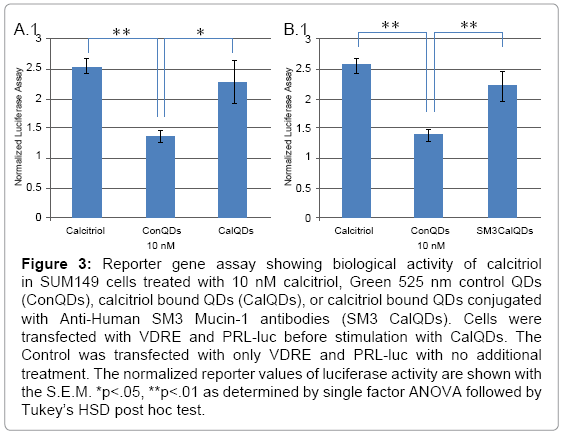
Figure 3: Reporter gene assay showing biological activity of calcitriol in SUM149 cells treated with 10 nM calcitriol, Green 525 nm control QDs (ConQDs), calcitriol bound QDs (CalQDs), or calcitriol bound QDs conjugated with Anti-Human SM3 Mucin-1 antibodies (SM3 CalQDs). Cells were transfected with VDRE and PRL-luc before stimulation with CalQDs. The Control was transfected with only VDRE and PRL-luc with no additional treatment. The normalized reporter values of luciferase activity are shown with the S.E.M. *p<.05, **p<.01 as determined by single factor ANOVA followed by Tukey’s HSD post hoc test.
Development of SM3-QDs for in vivo imaging in mice
The QD with the greatest fluorescence was determined so that the QD would be the most detectable in vivo. QDs with four different emissions were tested for their visibility under the in vivo Imaging System (IVIS) Lumina. A serial dilution of the QDs was prepared. The microcentrifuge tubes with 100 μl of QD solution were imaged under the IVIS. The average pixel intensity of each solution was measured.
As shown in Figure 4, the 800 nm QDs had the highest fluorescent intensity, reached pixel saturation at a 100 μl volume at 60 nM, and was selected for in vivo use. The QDs were conjugated to calcitriol and the SM3 antibody clone as described in materials and methods and used for in vivo experiments.
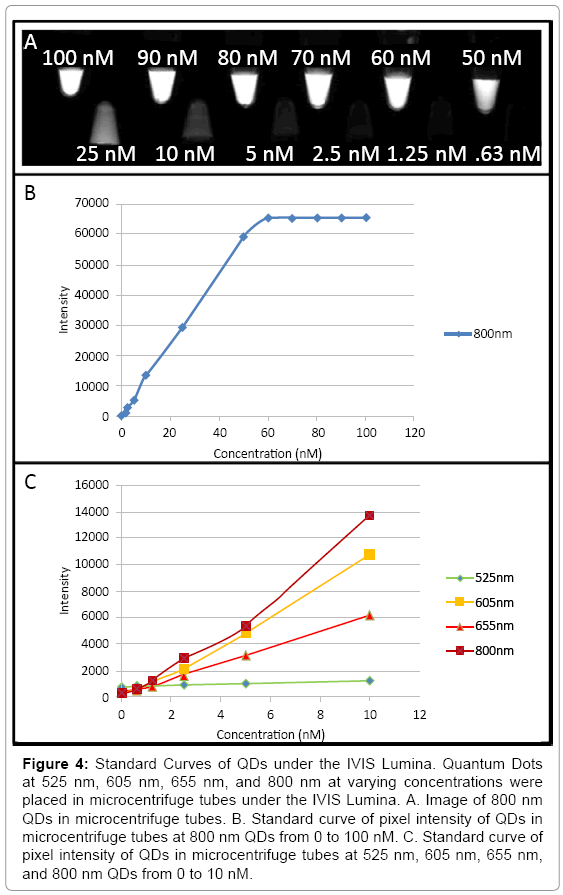
Figure 4: Standard Curves of QDs under the IVIS Lumina. Quantum Dots at 525 nm, 605 nm, 655 nm, and 800 nm at varying concentrations were placed in microcentrifuge tubes under the IVIS Lumina. A. Image of 800 nm QDs in microcentrifuge tubes. B. Standard curve of pixel intensity of QDs in microcentrifuge tubes at 800 nm QDs from 0 to 100 nM. C. Standard curve of pixel intensity of QDs in microcentrifuge tubes at 525 nm, 605 nm, 655 nm, and 800 nm QDs from 0 to 10 nM.
In vivo imaging of SM3-QDs tissue accumulation in mice using the IVIS Lumina system.
The concentration of fluorescent QDs was measured in mouse organs in vivo, in order to determine the ability of SM3 MUC1 to be directly targeted to IBC tumors. Orthotopic SUM149 tumors were established in the mammary fat pad of 13-16 week old female athymic nude mice. Mice were injected once with CalQDs, SM3 CalQDs, or ConQDs via the tail vein.
Treated mice were imaged daily on the IVIS and in general IBC tumor-bearing had high concentrations of retained QDs with the highest concentration at Day 2 (Figure 5A). At Day 2, while the tumor uptake appeared to be minimal in all treatments, CalQD and SM3 conjugated CalQD treatments appeared to have been concentrated in the lungs in tumor-bearing mice as compared to the Control QDs, which appeared diffusely dispersed though the body (Figure 5A). When observed at Day 2, tumor-bearing mice treated with SM3 CalQDs had a significantly higher fluorescent intensity in the lungs than with mice with no palpable tumor (Figures 5B and 5C). SM3 CalQDs were retained longer with more apparent at Day 3 than the other treatments (Figure 5A). This suggests that the presence of the SM3 MUC1 antibody, allows the QD to remain longer in tissues before being cleared. The tumors did not show visible fluorescence when observed in mice (Figure 5).
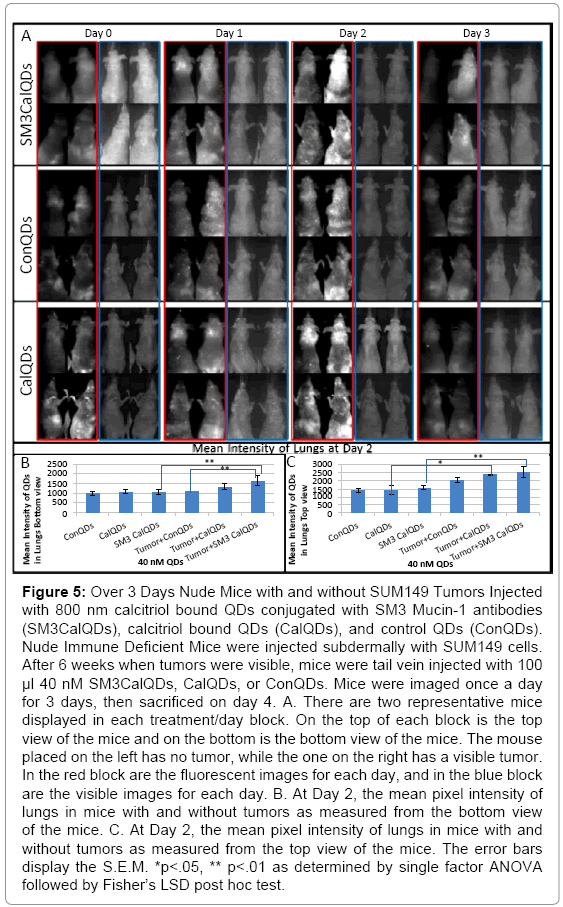
Figure 5: Over 3 Days Nude Mice with and without SUM149 Tumors Injected with 800 nm calcitriol bound QDs conjugated with SM3 Mucin-1 antibodies (SM3CalQDs), calcitriol bound QDs (CalQDs), and control QDs (ConQDs). Nude Immune Deficient Mice were injected subdermally with SUM149 cells. After 6 weeks when tumors were visible, mice were tail vein injected with 100 μl 40 nM SM3CalQDs, CalQDs, or ConQDs. Mice were imaged once a day for 3 days, then sacrificed on day 4. A. There are two representative mice displayed in each treatment/day block. On the top of each block is the top view of the mice and on the bottom is the bottom view of the mice. The mouse placed on the left has no tumor, while the one on the right has a visible tumor. In the red block are the fluorescent images for each day, and in the blue block are the visible images for each day. B. At Day 2, the mean pixel intensity of lungs in mice with and without tumors as measured from the bottom view of the mice. C. At Day 2, the mean pixel intensity of lungs in mice with and without tumors as measured from the top view of the mice. The error bars display the S.E.M. *p<.05, ** p<.01 as determined by single factor ANOVA followed by Fisher’s LSD post hoc test.
Determining the accumulation of SM3-QDs at day 4 in organs after removal from the mice.
In order to determine the in vivo accumulation of fluorescent particles further, mice were euthanized and the tumors and lungs were removed at Day 4. Tumors and lungs were analyzed by IVIS Lumina system and fluorescence was quantified. There was significantly higher fluorescence in tumors treated with any QD treatment as compared to the untreated control (Figure 6A). This indicates that QDs are significantly taken up into the tumors. Analysis of the organs on Day 4 also demonstrated that in tumor-bearing mice, when treated with any form of QDs, the lungs had a significantly higher fluorescent intensity than the untreated control lungs (Figure 6B). These results suggest that IBC tumor-bearing mice injected with any of the QD treatments have significantly more QDs in the lungs than mice without tumors (Figures 5 and 6). However, the overall fluorescence of an organ is not conclusive evidence that the probe is localized to tumor tissue.
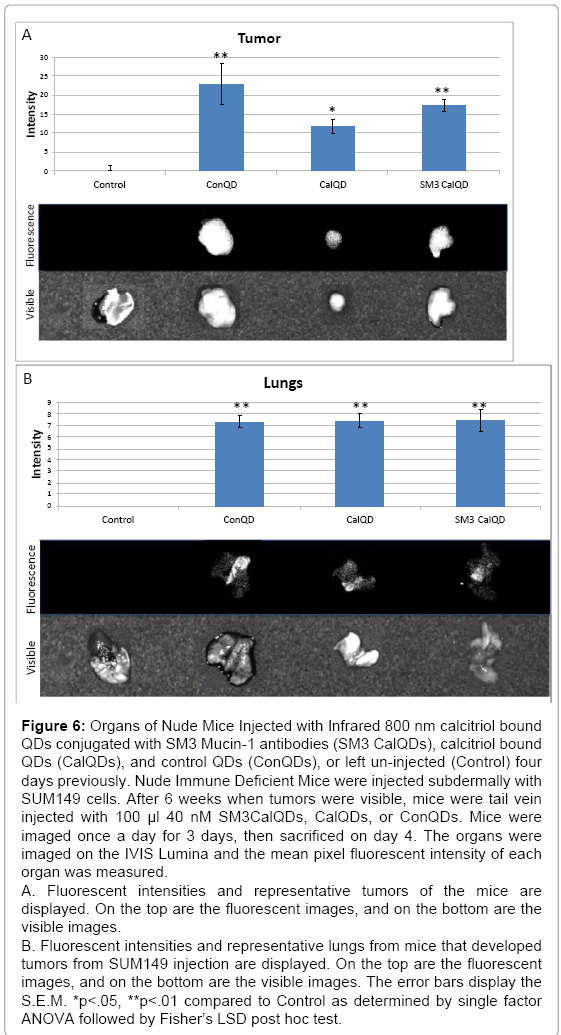
Figure 6: Organs of Nude Mice Injected with Infrared 800 nm calcitriol bound QDs conjugated with SM3 Mucin-1 antibodies (SM3 CalQDs), calcitriol bound QDs (CalQDs), and control QDs (ConQDs), or left un injected (Control) four days previously. Nude Immune Deficient Mice were injected subdermally with SUM149 cells. After 6 weeks when tumors were visible, mice were tail vein injected with 100 μl 40 nM SM3CalQDs, CalQDs, or ConQDs. Mice were imaged once a day for 3 days, then sacrificed on day 4. The organs were imaged on the IVIS Lumina and the mean pixel fluorescent intensity of each organ was measured.
A. Fluorescent intensities and representative tumors of the mice are displayed. On the top are the fluorescent images, and on the bottom are the visible images.
B. Fluorescent intensities and representative lungs from mice that developed tumors from SUM149 injection are displayed. On the top are the fluorescent images, and on the bottom are the visible images. The error bars display the S.E.M. *p<.05, **p<.01 compared to Control as determined by single factor ANOVA followed by Fisher’s LSD post hoc test.
Histology of tumors and lungs to determine the localization of SM3QDs in these tissues.
To determine if the conjugated QDs are targeting IBC tumor tissue, we took sections of the tumors and lungs treated with ConQDs, CalQDs, or SM3 CalQDs. Lungs are the primary site IBC tumors metastasize to in mice. We examined the localization of QDs in these sections. For this we sectioned the tissues and stained them for nucleus (Figures 7A-7C). The nuclear stain reveals that treatment with CalQDs appears to affect the morphology of the cell, resulting in smaller nuclei; however the other treatments do not appear to impact the cell morphology (Figure 7). As shown in Figure 7A, the SM3 CalQDs and ConQDs are localized in the sections of the tumors. In the mice injected with CalQDs, a few CalQDs are visible in the tumor sections. ConQDs localized to areas where no cells are located (absent blue staining), while SM3CalQDs accumulated within the tissue. All three particles ConQDs, CalQDs and SM3 CalQDs were found to accumulate in the lungs (Figure 7B). High magnification confocal microscopy showed that the SM3 CalQDs targeted specifically to the MUC-1 positive tumor cells (green), while CalQDs and ConQDs accumulated randomly within cells (Figure 7C). These data demonstrate that the SM3 CalQDs can be used to specifically target calcitriol to tumor emboli and tumor metastasis.
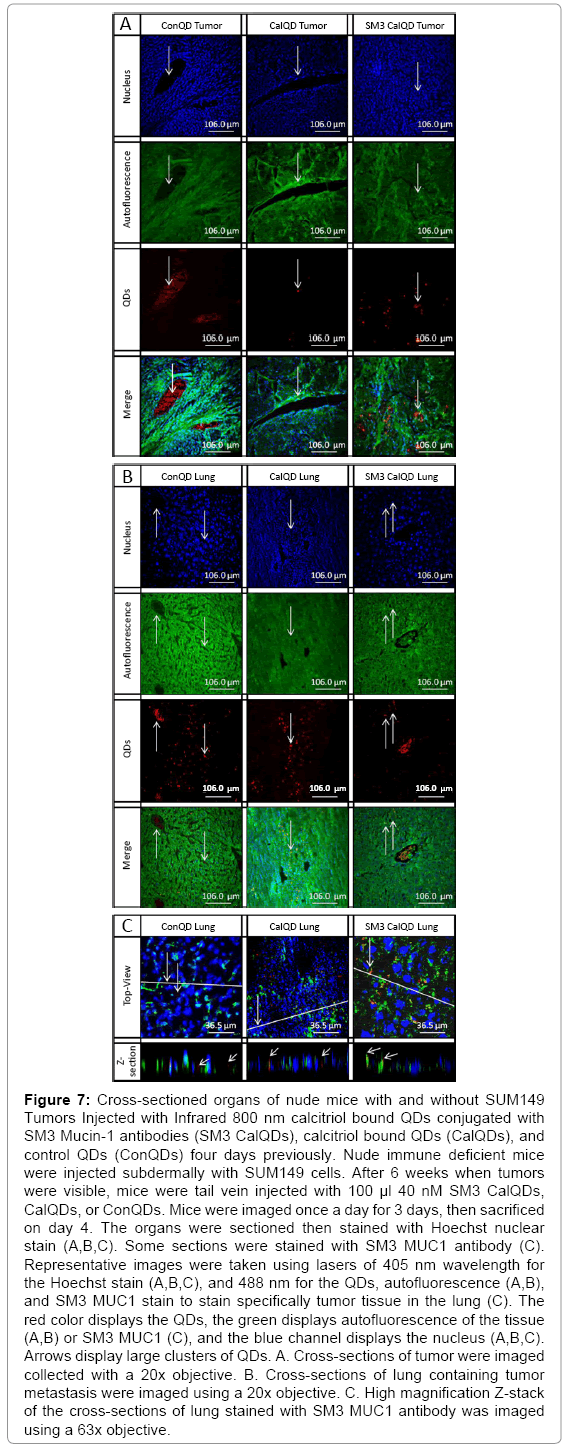
Figure 7: Cross-sectioned organs of nude mice with and without SUM149 Tumors Injected with Infrared 800 nm calcitriol bound QDs conjugated with SM3 Mucin-1 antibodies (SM3 CalQDs), calcitriol bound QDs (CalQDs), and control QDs (ConQDs) four days previously. Nude immune deficient mice were injected subdermally with SUM149 cells. After 6 weeks when tumors were visible, mice were tail vein injected with 100 μl 40 nM SM3 CalQDs, CalQDs, or ConQDs. Mice were imaged once a day for 3 days, then sacrificed on day 4. The organs were sectioned then stained with Hoechst nuclear stain (A,B,C). Some sections were stained with SM3 MUC1 antibody (C). Representative images were taken using lasers of 405 nm wavelength for the Hoechst stain (A,B,C), and 488 nm for the QDs, autofluorescence (A,B), and SM3 MUC1 stain to stain specifically tumor tissue in the lung (C). The red color displays the QDs, the green displays autofluorescence of the tissue (A,B) or SM3 MUC1 (C), and the blue channel displays the nucleus (A,B,C). Arrows display large clusters of QDs. A. Cross-sections of tumor were imaged collected with a 20x objective. B. Cross-sections of lung containing tumor metastasis were imaged using a 20x objective. C. High magnification Z-stack of the cross-sections of lung stained with SM3 MUC1 antibody was imaged using a 63x objective.
IBC is one of the most severe form of breast cancer with a very high mortality rate even with multimodality treatment [1]. With its therapeutic potential demonstrated in several types of cancer, calcitriol was explored as a treatment against IBC [4,5]. It appears to have an effect against the metastatic ability of IBC cells [5]. Calcitriol’s potential as a therapeutic against IBC, a disease that has a very poor prognosis even with prompt treatment, needs to be further explored [5]. However, calcitriol’s use as a therapeutic agent is limited due to its ability to cause hypercalcemia at the doses required to reduce metastasis [5-7].
Direct targeting of calcitriol directly to the tumor site would allow a lower dose to be applied, while still achieving a high concentration at the tumor site. Calcitriol bound QDs were previously developed to image calcitriol in vitro and in vivo [12]. QDs can be successively conjugated to antibodies and targeted to specific areas [19]. Therefore, calcitriol bound QDs conjugated with antibodies can be used to direct calcitriol to specific sites and have the additional benefit of being able to visualize the location of the calcitriol probe in vivo. Mucin-1 (MUC1) antibodies were conjugated to Calcitriol bound QDs. The SM3 antibody clone, which recognizes the hypoglycosylated form of human MUC1 can be used to directly target calcitriol bound QDs to IBC cells [9]. The HMPV antibody clone was used as a control since it recognizes an epitope on all forms of MUC1 [11]. In this study, SM3 CalQDs were tested for their potential as a targeted treatment against IBC by examining their ability to be targeted to IBC cells in vitro and in vivo, while still retaining their ability to induce biological activity.
In the in vitro assays the SM3 conjugated CalQDs were taken up by human IBC SUM149 cells at a slightly higher concentration than the CalQDs. Using the mouse C2C12 line as a negative control, SM3 CalQDs showed less significant uptake when compared to ConQDs (p<0.05 cytoplasm, p>0.05 nucleus) and the CalQDs (p<0.01 cytoplasm, p<0.05 nucleus).This data confirms the specificity of the anti-human MUC1 antibodies not recognizing MUC1 on the mouse cells and suggest that conjugation of the antibody to the QDs facilitates specific uptake. The SM3 CalQDs also induced biological activity in SUM149 cells at similar levels as calcitriol and CalQDs suggesting that the biological activity is conserved. This success in vitro demonstrated that SM3 CalQDs were successfully conjugated in a way that they could be targeted to the IBC cells with their biological activity intact.
Injection of SM3 CalQDs into mice with tumors in vivo demonstrated a clear difference between the clustered SM3 CalQD distribution compared to the random distribution of the ConQD and CalQDs. The SM3 CalQDs appeared to persist in the tissues longer than CalQDs, since the fluorescent intensity was greater in the tumor-bearing mice treated with SM3 CalQDs 3 days after treatment. Interestingly, all QD types were present in the tumors perhaps due to the leaky vasculature associated with tumors. Using the IVIS to visualize the distribution of the particles in the lung, the CalQDs, SM3 CalQDs and ConQDs showed similar amounts accumulated in the tissue. However histology showed that only the SM3 QDs specifically targeted to tumor emboli in the lung tissue, where IBC cells are known to metastasize [5]. In sharp contrast, the CalQDs and ConQDs showed a random distribution in the lung. Therefore, while ConQDs are directed to the tumor, they remain in the blood vessels and outside the cells. In the lung the CalQDs and ConQDs accumulate in all cell types unspecifically. Therefore these results suggest that SM3 CalQDs can successfully be used to target calcitriol to IBC cells. With the ability to concentrate calcitriol to tumor sites demonstrated, future work will explore the ability of SM3 CalQDs to act as a therapeutic for IBC.
Special thanks to Dr. Jeff Caplan and Dr. Kirk Czymmek for their help with confocal imaging and analysis at the Delaware Biotechnology Institute.