Research Article - (2018) Volume 6, Issue 1
Keywords: Adaptation; Climate change; Climate variability; Local community perception; Western Oromia
The scientific evidence has shown that climate change is a global challenge facing humans and their socio-economic activities, livelihood, health, and food security [1-4]. Climate change threatens various sectors of economic development including natural resources, agriculture and food security, tourism, manufacturing and health [5,6]. Climate change imposes constraints to development especially among smallholder farmers whose livelihoods mostly depend on rain-fed agriculture [7]. Negative impacts of extreme events such as floods and droughts are expected to be high in developing countries especially in rural areas [8,9]. Adverse effects of climate change continue to be a major threat to rural livelihoods [7-11]. This poses a challenge of developing innovative technologies to improve rural livelihoods and environmental conservation and ensuring adoption of such technologies. Sub-Sahara Africa is among the most vulnerable continents or regions to climate change impacts, because the majority of the Sub-Sahara African population lives in abject poverty, and are heavily dependent on rain fed agriculture for their economic and livelihood sustenance. Therefore, variations in rainfall patterns and temperature adversely impact their economic and social survival. Reports also indicated that climate change will cause a wide-ranging decline in most of the crops such as sorghum, maize, millet and groundnuts in several countries such as Ethiopia, Eritrea, Sudan, Zambia, Ghana, Sudan and Gambia. Yields from rain - fed crops could drop by 50% by 2020 and dwindle net revenues from crops by 90% by 2100 in some countries, worsening food insecurity and putting millions of people at risk of hunger, with Africa expected to account for the majority by 2080s particularly small scale farmers [12,13]. Because the main long-term impacts include significant changes in rainfall patterns and temperature which affect agriculture, there is a projected significant reduction in food security; worsening water security; decrease in fish resources in large lakes due to rising temperature; increase in vector-borne diseases; rising sea level affecting low-lying coastal areas with large populations; and rising water stress African Partnership Forum [14]. Climate change is perceived to have adverse ecological, social and economic impacts [15]. Smallholder farmers face numerous risks to their agricultural production. 95% of respondents opine that there is frequent crop failure over the areas due to erratic distribution and dwindling rainfall quantum. According to Menberu [16], increasing temperature, decreasing rainfall and abnormal precipitation distribution were observed over past 32 years. Likewise, the livelihood vulnerability indices (LVIs) calculated for agricultural land and climatic exposure indicators revealed that households are increasingly vulnerable to climate change risks. Also the study by Negash [17] show that; farmers’ perception towards rainfall variability, on average 80% of the respondents opined that there were rainfall variability in magnitude and frequency, while 11% perceived as no change in rainfall pattern and 4% responded that they do not know whether it exists or not over the past 20 years. Majority of the respondents (80%) agree that the rainfall variability is due to combined effect of natural and man-induced impacts. Climate change and variability has negatively affected the well-being of most rural smallholder farmers through its adverse impacts. According to the study in Zimbabwe; Smallholder farmers in rural areas have been experiencing low agricultural productivity, crop failure, human disease outbreak, pest and diseases, lack of water, shortages of agriculturalbased food items at a household level and food insecurities [18]. Understanding of extreme weather events, their significant impacts on crop and livestock production will enable rural farmers to prepare a local response to the anticipated impacts of climate change [19-22]. The problem of climate change in Ethiopia has the potential of undermining sustainable development efforts; if steps are not taken to respond to its adverse consequences. This measure depends on farming community perception and response. But there is no available information concerning perception and experiences on climatic variability.
Therefore, undertaking this research would provide important understandings; with regard to the climate change and farmers’ perceptions about climate change in order to adapt and mitigate the adverse effects of climate change in western Oromia, Ethiopia.
Assess local community experience of climate variability and climate change on crop production and responses made to overcome impacts of climate change and variability.
Study area description
The study area lies between 80 00’ to 100 00’ N and 36000’ to 370 50’E and the elevation range from 1200 to 3200 m (Figure 1). The study was carried out with in six (6) selected districts of western Oromia: Diga (Lalisa Dimtu and Demeksa PAs), Jimma Arjo (Abote Didessa and Hindhee PAs), Gida Ayana (Anger Gutin PA), Sibu Sire (Cari PA), Bako Tibe (Sedan kite and Biqiltu Leku PAs) and Cheliya (Jarso Dire and Tulu kosoru PAs).

Figure 1: Location of study area.
The annual precipitation over western Oromia ranges from 1000 mm to 2100 mm. The study area experiences annual temperature ranging from 100°C to 300°C, with mean annual temperature of 190°C, where the highlands and mountainous areas in the region receive lowest mean annual temperature, while lowlands and valley bottoms get highest mean annual temperature records [23,24]. Western Oromia wet season runs from May/June to August/September; this is also regarded as the main agricultural summer growing season. Most rainfall occurs in June, July and August. The least rainfall is in September when the summer agricultural crops are mostly at maturity stage.
Data type, sources and methods of collection
The household survey was carried out using a standard structured questionnaire applying both qualitative and quantitative methods of data collection. The survey assessed demographic characteristics, perceptions of extreme weather events, changes in rainfall, temperature in the last 10-15 years, how changes in climate have affected their crop production and the changes made by farmers on their agricultural farms because of climate changes. Farmers selected for interview were those individuals living in the sample districts, who are knowledgeable and elderly people who likely represent the opinion of the community. A total of 204 sampled farmers were interviewed using a structured questionnaire with closed and open ended questions.
The study on local community’s perceptions, responses and knowledge of climate variability, climate change impact on crop farming and adaptive strategies at the household levels were gathered through key informants’ interviews and personal interviews. Data was collected from smallholder farmers, combined with historical climate data to assess farmers’ perception of climate change and variability and compare the perceptions of historical trends from meteorological data. Meteorological data were collected from meteorological stations available in the study area. Two types of data were used in this study, primary and secondary data. The data was described and summarized quantitatively and qualitatively, which was collected from the National Meteorological Agency (NMA). In this study the selected meteorological stations were no missing data. Available historical climate data on precipitation and temperature of western Oromia covers a period of 30 years from 1980 to 2014. The primary data were collected from the household’s survey through two complementary approaches, namely (i) Key informant interviews) and (ii) Farmer interviews using semi-structured household questionnaires. Meteorological stations were purposively selected, based on the availability of daily rainfall, minimum temperature and maximum temperature data in the study area. Household data and historical meteorological were used in descriptive statistics, to show farmers’ perceptions on climate variability and climate change impact on crop production.
Purposive sampling techniques were used in the selection of study site and sample households. At the first stage, Digga & Gida Ayana from kola (lowland), Sibu sire & Bako Tibe from woinadega (midland) and Jimma Arjo & Cheliya from highland agro-ecologies were selected. The criteria considered for the selection of study area were: representativeness, prevalence of the problem, availability of relevant data and proximity to meteorology station. Most of the people in the area are engaged in mixed agriculture. Crop cultivation and livestock production is practiced. Crop production is entirely rain fed, except in very specific and small areas where vegetables are cultivated based on traditional and small-scale irrigation. To ascertain if farmers’ perceptions of climate change and variability correspond to actual long term climatic records, climatic data for the selected stations of western Oromia were analyzed and compared with the survey results.
Climate variability
The study integrated both qualitative and quantitative methods to build on their complementarities for cross-checking information received from the respondents and analyzed available historical climate data covering the period 1980 to 2014 from National Meteorology Agency (NMA). Coefficient of variation (CV) was calculated as the ratio of standard deviation to the mean and in order to study the monthly variability of rainfall in the study area, a modified version of [25] Precipitation Concentration Index (PCI) was used. This index described as:
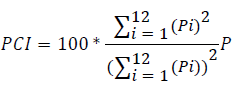
Where: Pi is the rainfall amount of the itch month; and Σ is summation over the 12 months PCI values of less than 10 indicate uniform monthly distribution of rainfall, values between 11 and 20 indicate high concentration, and values above 21 indicate very high concentration [25]. Standardized anomalies of rainfall were calculated and used to assess frequency and severity of drought [26]. Further, as indicated by Agnew and Chappell [26], the standardized rainfall anomalies were calculated and graphically presented to evaluate inters annual fluctuations of rainfall in the study area over the period of observation, described as:
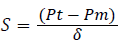
Where: SRA is standardized rainfall anomaly, Pt is an annual rainfall in year t,
Pm is long term mean annual rainfall over a period of observation and
σ is the standard deviation of annual rainfall over the period of observation.
The drought severity classes are extreme drought (SRA < -1.65), severe drought (-1.28>SRA>1.65), moderate drought (-0.84>SRA>-1.28), and no drought (SRA>-0.84).
In order to observe the trend of temperature and rainfall, a time series data for temperature and rainfall were used for the analysis.
Survey data analysis
Survey data were analyzed using the statistical package for social sciences (SPSS). Descriptive statistical tools such as, mean, percentages, frequencies and standard deviations were used to summarize and categorize the information gathered. Crosstabs, F-test, chi-square test and a one-way ANOVA tests were employed to compare group means.
Characteristics of respondents
From total 204 respondents included in the survey, 79.4% were male and the rest 20.6% were female. The ages of household head respondents were ranges from 30 to 75 years old. Around 44.1% of the respondents were below 40 years old and about 55.9% were above 50 years old. Marital statuses of respondents were; 91.7% married, 2.9% single, 2.4% widowed and 2% divorced from the sampled households. From the total respondents around 23% can read and write and 36.8% household heads respondents were illiterate with no formal education (Table 1).
| Characteristics of the respondents | Frequency | % respondents | |
|---|---|---|---|
| Sex of households | Male | 162 | 79.4 |
| Female | 41 | 20.1 | |
| Marital status of households | Single | 6 | 2.9 |
| Married | 187 | 91.7 | |
| Widowed | 5 | 2.4 | |
| Divorced | 4 | 2 | |
| Educationallevels | Illiterate | 75 | 36.8 |
| Read & Write | 47 | 23 | |
| First cycle complete | 54 | 26.5 | |
| Secondary education complete | 15 | 7.4 | |
| High school complete | 10 | 4.9 | |
| Higher education | 2 | 1 | |
| Ages of households | 19-30 | 14 | 6.9 |
| 31-40 | 76 | 37.3 | |
| 41-50 | 62 | 30.4 | |
| 51-60 | 29 | 14.2 | |
| 61-70 | 23 | 11.3 | |
Table 1: Characteristics of the respondents (N=204).
Local community response to climate change
The communities perception on climate variables such as temperature and precipitation behavior of the area in past was investigated. The results reveal that a slightly higher proportion of farmers claimed that temperature is increasing and rainfall is decreasing, and noted extreme weather change in the frequency of floods and droughts.
Results showed that 100% of the respondents perceived that the existence of change precipitation in western Oromia in the last 20 years. Local communities have been experiencing decrease in precipitation and change in timing of precipitation over the past 20 years. Almost 49% and 39% respondents confirmed that the decrease in precipitation and change in timing of precipitation, respectively in the study area western Oromia (Figure 2). Only 7% perceived increased precipitation. Local communities also perceived increase temperature (81%), decrease temperature (9%) and extreme temperature (9%) (Figure 3). In the last 20 years majority of the local communities (more than 80.5% of the respondent) were responded that they have experienced change in climate with an increasing temperature in western Oromia.

Figure 2: Community’s response on rainfall variability.

Figure 3: Community’s response on temperature variability.
In this study, local community was asked to tell what indicators they have been using to perceive changes in rainfall over the last 20 years. Their responses revealed that decline of agricultural yields (27%), rainfall comes early or lately (26%), loss of some animal and plant species (20%), decreased available water (11%), Increased drought and flood frequency (10%) and growing period shortened (6%) were reported (Figure 4). The results revealed clearly that the main climate attributes that had changed in this area were rainfall and temperature. This finding was in agreement with several studies that had shown farmers perception with regard to climate variability and change [15-17,19,22,27].

Figure 4: The perceived local indicators to evaluate the rainfall trends.
Climate variability
To ascertain if farmers’ perceptions of climate change and variability correspond to actual long term climatic records, climatic data of selected meteorological stations for western Oromia was analyzed. The mean annual maximum and minimum temperature generally shows a warming trend ranging from 0.25 to 0.86°C and 0.05 to 0.46°C per decade respectively over the last 30 years (Figure 5). The precipitation concentration index (PCI) value is more than 12% for most of the stations and highlights the seasonality in rainfall distribution. The PCI of the area indicated that the area have strong rainfall seasonality. Based on the results of the study, annual and seasonal rainfall variability for selected stations ranged between 12% and 25%. This shows high annual and seasonal rainfall variability (Figure 6). Belg rainfall showed higher variability compared to annual and Kirmet. Generally, the PCI of the area indicated that kiremt season was more uniform than both Belg and Bega seasons. Thus, accordingly, the PCI of rainfall in the area generally shows moderate to high annual concentration. In this case most of the stations show an increase in PCI values, which indicates an increase in the variability of the distribution of annual rainfall. A plot of the three average climate variables (precipitation, maximum temperature, and minimum temperature) shows that temperature has been increasing while average annual rainfall has been decreasing in western Oromia (Figure 7).

Figure 5: Change in observed temperature per decade over the last 20 years.

Figure 6: Annual, Belg and kiremt rainfall variability (PCI).

Figure 7: Average time series and trends for precipitation, minimum and maximum temperatures in western Oromia.
Agricultural drought is a situation when rainfall and soil moisture are inadequate during the crop growing season to support healthy crop growth to maturity, causing crop stress and wilting. Drought is directly a response to the shortage of rainfall. Standardized rainfall anomaly index calculated for a period of (1980-2013) for the selected stations also indicate that the annual rainfall of selected districts of western Oromia, exhibit cyclic wet and dry conditions with positive and negative anomalies. By using Standardized Rainfall Anomaly (SRA) time series against drought index gives a good indication of the temporal drought history for the selected station. It was to be noted that the major drought years were identified as 1980, 1984, 1985, 1986, 1988, 1989, 1990, 1991, 1994, 1995, 1999, 2000, 2002, 2003, 2004, 2006, 2008, 2009, 2011, 2012 and 2013 in the study area (Figure 8). This shows selected districts of western Oromia were mostly affected by drought. The result reveals that almost all station indicted that there was drought index in the study area even though the drought severity degree was different. In this study the dry and wet periods for selected districts of western Oromia were identified. Accordingly, the average dry periods identified were 1980, 1984, 1986, 1988, 1989, 1990, 1991, 1994, 1995, 1999, 2000, 2001, 2002, 2003, 2009, 2011, 2012, 2013 and the wet periods were 1981, 1982, 1983, 1985, 1987, 1992, 1993, 1996, 1997, 1998, 2004, 2005, 2006, 2007, 2008 and 2010. As indicated in the Figure 8 below drought will occur once every one to four years with the extent of moderate to severe drought. Therefore, drought prediction and assessment are important, mainly for farmers to prepare and establish a good agricultural plan to tackle the effect of drought.

Figure 8: Drought index for the selected districts of western Oromia.
Perceived impacts of climate change on agricultural production
The study results revealed decline in crop yield, increase in pest and disease, reduced seedling, delayed in seedling and delayed in maturity as the major impacts of climate change and variability on crop production in the western Oromia. The dominant crops for subsistence and cash for the communities in western Oromia are maize, wheat, teff, barley, finger millet, sorghum beans, peas and potatoes. However, crop yields in all areas is on a declining due to climate change, land degradation, pests and diseases, high cost of inputs and decreasing land sizes. The results revealed that the farmers perceived various impacts of climate change: About 98% of respondents were perceived soil erosion problem in over the last 10 years. The types of soil erosion persist in the study area were include: Sheet erosion (58.71%), created rills in the farm (22.40%), sediments formed in ditches (11.44%) and furrows and gullies created in their farm land (7.46%). while major one was sheet erosion (58.71%) according to respondents perception.
Deforestation and minimal practices of soil and water conservation give the impression to cause more serious problems in soil erosion. However, recently, larger number (43%) of respondents started to adopt soil and water conservation measures through soil bunds. That means, different soil and water conservation measure options have been undertaken to minimize the problem of soil erosion, which include ditches/trenches (22%), contour planting (19%), terraces (10%), stone dams (3%) and check dams (2%). Some of the adaptations induced by perceptions of changing rainfall pattern seem to differ from those induced by perceptions of changing temperature. About 100% of respondents were perceived soil fertility problem in over the last 10 years.
The indicators of soil fertility problem in the study area include: yield decline and increased in input demand. The major indicator of soil fertility problem was decline in crop yield 58% respondents were perceived. Different management practices were undertaken to minimize the problem of soil fertility. These include crop rotation (34%), manure application (23%), fertilizer (14%), intercropping (12%), fallowing (11%), Legume trees (4%) and mulching (2%).
Respondents mentioned various aspects of climate change inducedvulnerabilities’ in the past 15-20 years such as increase in pest and disease, soil erosion, drought, flood and landslide.
A more quantitative analysis on perceived climate change inducedvulnerabilities’ showed that increase in pest and disease by 34% and soil erosion by 30% was the most prevalent induced problem mentioned by the respondents.
When respondents were asked about the adverse impacts of climate change on agriculture (Table 2), they pointed out several things. For example: 45% of the respondents claimed that, one of the impact of the climate change among other was decrease in crop yields due to changes in temperature and rainfall over the last 20 years. While many of respondents (21%) claimed crop failure due to climate change. Based on survey data/findings, we suggest that climate change impacts negatively upon crop production in selected districts of western Oromia. Due to above listed problems; about 49% of the farmer’s perceived reduced in crop yield. The findings suggest that climate change impacts negatively upon crop production in selected woreda of western Oromia (Table 3) and climate adaptation and mitigation measures are required to reduce the long term vulnerability and food security of the area.
| Areas of Assessment | Frequency | Percent |
|---|---|---|
| Crops are sometimes failing | 43 | 21.1 |
| Crops are totally failing | 5 | 2.5 |
| Production per ha is decreasing | 92 | 45.1 |
| Production per ha is increasing | 3 | 1.5 |
| Crop disease and weeds are increasing | 30 | 14.7 |
| Increased problem of livestock disease | 20 | 9.8 |
| Increased problem of seasonal flooding | 11 | 5.4 |
Table 2: Perceived adverse impacts of climate change on agriculture (n=204).
| Areas of Assessment | Frequency | Percent |
|---|---|---|
| Total crop loss | 14 | 6.9 |
| Reduced yield | 99 | 48.5 |
| Reduced seeding area | 23 | 11.3 |
| Delayed seeding | 7 | 3.4 |
| Delayed maturity | 15 | 7.4 |
| pest/ disease | 46 | 22.5 |
Table 3: Perceived impacts of climate change on crop production (n=204).
Coping and adaptation measure to climate change and variability
Climate adaptation measures are crucial if the long term impacts of climate change on crop production and livelihoods of farmers are not to be compromised. In an attempt to investigate the extent of adaptation to climate change, farmers were questioned on their adaptation measures.
Most respondents (93%) in the study area have adjusted their farming practices to long-term climate change. Only 7% have not adjusted (Figure 9). The adaptation measures identified were soil and water conservation, crop rotation, crop varieties selection, adusting planting dates, diversification of crop types and varieties, building water harvesting schemes and use of irrigation.

Figure 9: Adaptation measure to Climate Change and Variability
Similarly, descriptive statistics results have shown that communities in western Oromia have adapted to the impact of climate variability and change through a number of mechanisms. Particularly, sample respondents in the study area have multiple strategies for adapting to the impacts of climate variability and change. Majority of sample households adapting to impacts of climate change and variability through soil and water conservation (57%) and the rest adapting through crop rotation, crop variety selection, adjusting planting dates, diversification of crop types and varieties, build water harvesting schemes, irrigation and intercropping (Figure 10).

Figure 10: Distribution of households by coping and adaptation measures.
Most respondents in the study area point out that climate change can be mitigated through afforestation practice on the degraded land, farm land and home garden. Respondents also explained the advantage of afforestation in terms of moisture conservation, protecting soil erosion and improve soil fertility, availability of enough rainfall and optimal temperature for agriculture. Accordingly adaptation strategies proposed by the respondents to resist climate change impact on agriculture were:
• Changing/adjusting planting date to rain pattern change
• Use drought resistant and short maturity crop variety
• Tree planting
• Stop burning trees for charcoal
Barriers to climate change adaptation
Communities were facing various barriers that can make the adaptation strategies ineffective at the local level. The sample households listed a number of interrelated serious barriers associated with adaptation strategies that made their lives very difficult besides the presence of unpredictable rainfall and other climate related impacts. These were lack of information (43.59%), shortage of labor (22.05%), and lack of capital (21.54%) and others (Figure 11). These barriers act interdependently to restrict the ability of communities to adapt to climate change and variability. The government could build the capacity of agricultural extension systems [28] and make available climate change education scheme [29], with ICT innovations such as cell phone applications. Therefore, policy makers need to plan a holistic and coordinated approach in dealing with these barriers. This studies providing empirical evidence to deepen community understanding of the barriers that challenge small-scale farmers in their attempt to implement appropriate adaptation strategies to manage the negative impacts of climate change and variability.

Figure 11: The main barriers to climate change adaptation measures.
This study draws upon both quantitative and qualitative approaches to investigate the smallholder farmers’ perception of climate change impacts on crop production in western Oromia and compare their perceptions to historical meteorological data. Mainly, the study established the of climate change/variability evidence in the study area through analysis of historical meteorological data, over the past 30 years. The study results revealed that climate change has a negative impact on livelihoods of smallholder farmers. The study revealed that perception of most farmers was an existence of increase pattern in temperature and decrease pattern in precipitation in study area for past 20 years. The results shown that there had been a change in temperature and rainfall over time and there was support between farmers’ experiences and the analyzed historical meteorological data.
Small holder farmers have experienced extreme weather events such as reduced rainfall, increased in temperature and frequent droughts, crop failures events due to prolonged droughts and negative effect in their crop production.
The study revealed that most farmers perceived an increase in temperature and decrease in precipitation in study area. Major impacts of climate change were perceived as decline in crop yield, flood and drought problem, livestock diseases, increase in pest and disease, reduced seedling, delayed in seedling and delayed in maturity.
Generally, from this findings we concluded that the impacts of climate change on crop production in western Oromia is negatively affected whereas farming community practiced some adaptation measure that include soil and water conservation, crop rotation, adjusting planting dates and variety selection to overcome impact imposed by climatic change. On the other hand this finding identified some serious barriers including lack of information, shortage of labor, lack of capital, lack water potential for irrigation that affect level of adaptation measure to climate change.
Therefore based on this conclusion we draw the following recommendation to strengthen local skill to ward climate change adoption and to introduce new adoption measure.
• Capacity building and awareness creation is vital to support climate change adaptation process especially in rural communities.
• Development of participatory adaptation strategy that encompass local community in decision making and planning stage.
• Reforming policies regarding issues that strengthen climate change adaptation and mitigation practices through different anticipatory adaptation strategies like Soil and water conservation practices, crop varieties selection, water harvesting techniques and others.
• Improving access for varieties and other agricultural inputs
• Developing network for easy agro met advisory and other information transfer for communities those affected by climate change impact.
The author thanks Oromia Agricultural Research Institute for their financial support.
