Research Article - (2018) Volume 6, Issue 3
Meteorological drought are difficult to avoid but could be monitored, and their adverse impacts could be alleviated. This study investigated invisible drought in Abeokuta, Southwest Nigeria using Standardized Precipitation Index (SPI) based on the reconstruction of rainfall events into one and three time scales. The study revealed that although there is an increase in the trend of annual rainfall, large amount of severe drought occurred between January, December, February, November and March, in descending order of frequency. While exceptionally dry periods that were missed in the one month time scale were caught in the 3 months scale for January in 1984, 1986, 1987, 1991, 1992, 1993, 1995, 1996, 2000, 2001, 2004, 2007, 2008, 2010 and 2011. The study concluded that invisible droughts are creeping within the months of December and March in the study area. Policy measures that can support adaptation should be put in place to forestall unexpected crisis while extension services be strengthened to assist the farmers in cushioning these effects.
Keywords: Meteorological droughts; Rainfall; SPI; Policy measures; Mitigation
Meteorological drought is a short lived, recurring natural disaster, which originate from the lack of precipitation and can bring significant economic losses [1]. Invisible meteorological droughts are difficult to avoid because they are influenced by numerous meteorological variables such as sunshine duration, wind speed, evapotranspiration, rainfall and many other variables which are random in nature. In contrast, they could be monitored, and their adverse impacts could be alleviated [2].
Most of African countries have very low resilience and limited capabilities to mitigate drought effects. For example, the long sequence of droughts in the sub-Sahel region during the 1970s and 1980s [3], and the recent drought that afflicted the Horn of Africa between 2010 and 2011 [4] had severe humanitarian consequences. Consequently, monitoring and forecasting both the length and geographical extension of droughts is a key component of increasing resilience [4].
The Standardized Precipitation Index (SPI) is an index widely used for drought monitoring purposes [5]. The Standardized Precipitation Index (SPI) is a tool developed by McKee [6] for the purpose of defining and monitoring local droughts. It was conceived to identify drought periods and the severity of droughts, at multiple time scales. Shorter or longer time scales may reflect lags in the response of different water resources to precipitation anomalies [5]. SPI computation requires the preliminary fitting of a probability distribution to monthly precipitation aggregated at different time scales.
Drought must be considered as a relative, rather than absolute condition, it can occur in both high and low rainfall area. When they occur in high rainfall areas such as Abeokuta they could be considered as invisible drought. It is based on this that this study seeks to investigate invisible drought using multiple times scales of one to three months.
Abeokuta is the capital of Ogun State, situated in the South- Western region of Nigeria (Figure 1). It is an area covering approximate of about 40.63 km2. Abeokuta lies between latitude 7°06’ N and 7° 13’N and longitude 3°15’E and 3°25’E. The terrain varies with and is characterized by two types of landforms - sparsely distributed low hills and knolls of granite and other rocks of the basement complex and nearly flat topography.

Figure 1: Map of the Study Area.
The rugged rock-strewn relief is prominent towards the north, in the central and south-eastern parts of the city. Abeokuta is drained by two major rivers, which are Ogun and Oyan and many smaller streams. Some of these streams take their source from local rocky hills while some are tributaries to the two major rivers.Abeokuta is one of the areas in Nigeria with equatorial climate.
Two main climatic conditions exit, the rainy season lasting for between seven to eight months between April and October with an interruption in August, and the dry season; running through November till February. Having an annual rainfall of about 1193.0 mm, temperature ranging from 26°C to 34°C, and the annual relative humidity of about 81%.The vegetation of the study area can be broadly grouped into two: The tropical rainforest and savanna.
The savanna are mainly of the derived savanna type which they are derived or developed from forest vegetation owing to such factors as high population densities, shifting cultivation and annual bush burning which have all combined to degrade the original forest vegetation. Thus, the derived savanna has come into existence as a result of the cultural practices of the people. Important tree species found in this vegetation type includes Lophira lanceolata: Daniellia oliveri and Afzolia africana. The common grass species is the Andropogon.Abeokuta is largely on the ferralitic soil group, it is set amidst a group of granite rocks of precambrian formation the central one of which is the famous Olumo rock.
The major crops grown are cassava, yam, maize, palm- oil, timber, rubber, rice, cotton, other fruits, and shea butter are the chief articles of trade. It is a key export location for cocoa, palm products, fruit, and kola nuts and fruit vegetables.
Materials
A thirty year rainfall monthly data (1983 - 2013) for Abeokuta was obtained from Nigerian Meteorological Society (NIMET) Abeokuta, Ogun and used for this study. To compute the Standardized Precipitation Index (SPI), rainfall data were grouped into one month and three month time scales for different monthly cumulative rainfall. One category of the ground includes SPI_1 for the 12 months, while the other includes SPI_3 for January, April, September and October.
Standardized Precipitation Index (SPI)
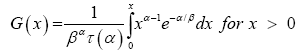
The most commonly used distribution for SPI calculation is the two-parameter gamma distribution with a shape and scale parameter, which is defined by its probability density function:
 (1)
(1)
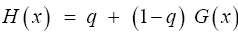
Where α is the shape parameter, β is the scale parameter, x is the precipitation value and  is the gamma function. The gamma distribution is undefined for x = 0, but the precipitation may have zero value, so the cumulative probability distribution given a zero value is derived as follows:
 (2)
(2)
Where q is the probability of the zero precipitation value. The cumulative probability distribution is then transformed into the standard normal distribution to calculate SPI. The value of SPI indicates the strength of the anomaly.
Positive SPI values indicate greater than median precipitation and negative values indicate less than median precipitation. Drought periods are represented by relatively high negative deviations. Normally, the ’drought’ part of the SPI range is arbitrary split into moderately dry (-1.0 > SPI >-1.49), severely dry (-1.5 > SPI > -1.99) and extremely dry conditions (SPI < -2.0). A drought event starts when SPI value reaches -1.0 and ends when SPI becomes positive again [6]. This function uses the SPI range defined by National Climatic Data Center (NCDC) (Table 1).
| Category | SPI values |
|---|---|
| Exceptionally moist | SPI >= 2.0 |
| Extremely moist | 1.60 <= SPI < 1.99 |
| very moist | 1.30 <= SPI < 1.59 |
| Moderate moist | 0.80 <= SPI < 1.29 |
| Abnormally moist | 0.51 <= SPI < 0.79 |
| Near normal | -0.50 <= SPI <= 0.50 |
| Abnormally dry | -0.79 <= SPI < -0.51 |
| Moderately dry | -1.29 <= SPI < -0.80 |
| Severely dry | -1.59 <= SPI < -1.30 |
| Extremely dry | -1.99 <= SPI < -1.60 |
| Exceptionally dry: | SPI <= -2.0 |
Table 1: Dryness/wetness categories according to SPI values.
Seasonal rainfall
The Figure 2 shows the monthly trend of rainfall in the study area. The figure depicts that the rainy season began in April and ends in November; while the sharp decline in monthly rainfall experienced in August suggests existence of August break. The chart also suggests that double peak rainfall exists in Southwest Nigeria. This is evident in that the highest average monthly rainfall occurred in the month of July and October with 190.86 mm and 186.79 mm respectively; while, the lowest average rainfall were experienced in the months of January, February, November and December.

Figure 2: Trend of Average Monthly Rainfall in Abeokuta (1982-2011).
Annual rainfall of Abeokuta
As depicted in Figure 3, the highest annual rainfall for the study period occurred in year 2011 with a value of 1777.3 mm, while the lowest rainfall occurred in the year 2008 with a value of 848.9 mm. The chart also shows from the trend that there was a positive increase from 1982 to 2011. In addition, the analysis of the annual rainfall for the study period shows that out of the 30 years the annual rainfall for 18 years were greater than the average annual rainfall of 1174.26 mm which was termed wet years occurred while the remaining 12 years where the annual rainfall were below the average was termed Dry years. This goes to show that there was increase in rainfall from 1982 to 2011 as well as there were more wet years during the study period.

Figure 3: Trend of Annual Average rainfall in Abeokuta.
Frequency and intensity of drought based on one month time scale
Table 2 shows the frequency and intensity of drought in the study area. The table shows that large amount of severe drought occurred January, December, February, November and March, in descending order of frequency. This implies that invisible drought is expected to occur in these months in the study area. Figure 4 further confirms the assertion that invisible drought have high probability to occur within the dry season. The figure also shows that there was a longer duration of severe drought in the month of January between 2005 and 2011.
| S.No. | Abeokuta Station | Jan | Feb | Mar | Apr | May | Jun | July | Aug | Sep | Oct | Nov | Dec |
|---|---|---|---|---|---|---|---|---|---|---|---|---|---|
| 1 | Exceptionally moist | 0 | 0 | 1 | 1 | 0 | 3 | 9 | 2 | 6 | 1 | 0 | 0 |
| 2 | Extremely moist | 0 | 0 | 0 | 0 | 4 | 4 | 4 | 3 | 7 | 2 | 0 | 0 |
| 3 | very moist | 0 | 0 | 0 | 1 | 1 | 1 | 4 | 4 | 2 | 0 | 0 | 0 |
| 4 | Moderate moist | 0 | 0 | 1 | 1 | 8 | 3 | 3 | 5 | 7 | 4 | 0 | 0 |
| 5 | Abnormally moist | 0 | 1 | 5 | 6 | 12 | 17 | 4 | 6 | 9 | 13 | 0 | 1 |
| 6 | Near normal | 3 | 13 | 17 | 16 | 5 | 1 | 5 | 9 | 5 | 9 | 12 | 4 |
| 7 | Abnormally dry | 3 | 2 | 1 | 0 | 0 | 0 | 1 | 1 | 0 | 1 | 4 | 3 |
| 8 | Moderately dry | 4 | 5 | 3 | 0 | 0 | 0 | 0 | 1 | 0 | 0 | 5 | 3 |
| 9 | Severely dry | 20 | 9 | 3 | 0 | 0 | 0 | 0 | 0 | 0 | 0 | 6 | 19 |
| 10 | Extremely dry | 0 | 0 | 0 | 0 | 0 | 0 | 0 | 0 | 0 | 0 | 0 | 0 |
| 11 | Exceptionally dry | 0 | 0 | 0 | 0 | 0 | 0 | 0 | 0 | 0 | 0 | 0 | 0 |
Table 2: Summary of drought frequency and intensity for one month time scale.

Figure 4: Intensity of Drought in Abeokuta Southwest Nigeria.
Frequency and Intensity of Drought Based on Three Months’ Time Scale
Figure 5 shows that by reconstructing the rainfall into three month time scales.

Figure 5: Intensity of Drought Based on Three Months’ Time Scale.
Exceptionally dry periods that were missed in the one month time scale were caught in the 3 months scale for January. Figure 5 goes to show that exceptionally dry period occurred in 1984, 1986, 1987, 1991, 1992, 1993, 1995, 1996, 2000, 2001, 2004, 2007, 2008, 2010 and 2011.
The season variation of the rainfall observed in this study corroborates Hamilton and Archibold as well as Adejuwon and Odekunle [7,8]. They posited that Southwest Nigeria experiences marked wet and dry seasons associated with, moist Tropical Maritime and dry Tropical Continental currents, respectively. The mean monthly rainfall revealed that two seasons are distinguishable in the study area, a dry season from November to March, and a wet season between April and October. The annual rainfall that ranged from 848.9 mm to 1777.3 mm is in line with past researches on southwest Nigeria where annual rainfall was expected to range between Mean annual rainfall ranges from 900 mm in the north to 2000 mm towards the south.
The trend analysis of the annual rainfall at Abeokuta station showed an increase from the beginning to the end of the study period this is similar to other researchers work in other parts of Southwest Nigeria. For instance, Akinsanola and Ogunjobi concluded rainfall has been on the increase and its anomaly revealed that there was a composite nature in which some of dry years were mixed with wet years and vice versa and this occurred in all seasons in all stations [9].
In this study, the overall meteorological drought variability in Abeokuta was assessed by reconstructing historical occurrences of droughts at varying time steps and drought categories by employing the SPI approach. The basic idea is that this can be a guide to the decision makers in Nigeria to develop strategies of water resources management in the context of drought. Drought occurrences in Abeokuta have been investigated based on the frequency of the events for each drought category at multiple-time steps. The long-term record (30 years) of rainfall for different time scales of Abeokuta was fitted to a gamma probability distribution that is then transformed into a normal distribution, which, by definition, has zero mean and unit variance. Hence the SPI indicates the number of standard deviations that a particular event deviates from normal conditions. Consequently this study revealed that majority of the rainfall falls within the near normal which shows that they did not deviate largely from normal, as a result the mean value of 1174.26 mm could be generalized for water resources management and planning.
The study also corroborates Mosaad et al. on the advantage of using several time steps when applying the SPI approach [5]. Since drought missed in individual months have been detected in the cumulative of three months. The study further revealed that exceptionally dry period occurred in 1984, 1986, 1987, 1991, 1992, 1993, 1995, 1996, 2000, 2001, 2004, 2007, 2008, 2010 and 2011. Droughts in these periods have been confirmed by various researchers. For instance, Kasei et al. used SPI to detect drought in Western African countries such as Burkina Faso, Ghana, Mali, Togo, Volta Basin in 1961, 1970, 1983, 1984, 1992, 2001 [10]. Elagib and Elhang detected drought in Sudan during the periods of 1969–1970, 1972–1973, 1979–1985, 1990–1991, 2002–2008 [11]. Ouassou et al. detected drought in Morocco during 1904–1905, 1917–1920, 1930–1935, 1944–1945, 1948–1950, 1960–1961, 1974– 1975, 1981–1984, 1986–1987, 1991–1993, 1994-1995 and 1999–2003 [12]. Drought has also been detected in Southern African Countrries; Rouault and Richard (2005) detected drought in this region during the period of 1906, 1916, 1924,1933, 1949, 1970, 1983, 1984, 1992, 1993, 1995, 1996, 2002, 2003, 2004 [13].
The study has revealed that invisible droughts are creeping within the months of December and March in Abeokuta, Southwestern Nigeria. This time of the year represent the time with low rainfall and high temperature and evapotranspiration in the study area. Most of the wells as well as rivers equally dry up during this time. This study therefore calls for stakeholders’ consideration of comprehensive adaptation measures that can strengthen the resilience of the common man against the drought. Also, the implementation of the climate change policy by Federal and State Government must take into consideration the need to carry out extensive research on the existence of drought throughout the country irrespective of the rainfall and vegetation classification. Serious cushion effect should be provided while policy measures toward discouraging deforestation, uncontrolled urbanization and population growth as well sustainable water resources practices should be put in place.
