Review Article - (2015) Volume 3, Issue 2
Keywords: Climate regulation; Temperature extremes; Convective processes
In several previous papers we have documented a cutoff in minimum 500 mb temperatures at high latitudes [1-3] using observational data from reanalyses and rawinsondes. The 500 mb level is both meteorologically significant (for example in frontal analysis and jet stream dynamics) and climatologically significant (e.g. the signatures of long term changes in frontal and jet stream structure as well as any general warming signals would be expected to extend throughout the lower atmosphere). We also proposed a physical mechanism for the observed minimum limit based on convective processes originating from the minimum sea surface temperature of about –2°C. We provided observational data and model simulations which supported this mechanism. In the present paper we: 1) update the observational time series for the minimum 500 mb temperatures; 2) document for the first time a similar cutoff in maximum 500 mb temperatures; 3) discuss potential alternate physical mechanisms for the bracketing of mid-tropospheric temperatures between these cutoff points.
Figure 1 shows the area of the –40°C (left panel) and –42°C (right panel) isotherm for regions north of 60N from NCEP-NCAR reanalysis data [4] versus month and year. Notable features in these figures is that the area of –40°C begins to grow usually in November (non-purple regions to the right in each figure, reaches a maximum usually in January, and never grows larger despite the limited solar energy inputs during the rest of the Arctic winter. Such behavior suggests a physical limit on the minimum temperature at this atmospheric level. The right panel (area of –42°C isotherm) emphasizes this limit as the area reaching –42°C is quite a bit smaller than that of –40 (note smaller contour interval). The area of –44°C (not shown) is near zero in all years. These Figures are updated through 2013 and show some indication of a decrease in the area of the –40 and –42°C isotherms towards the end of the time series.
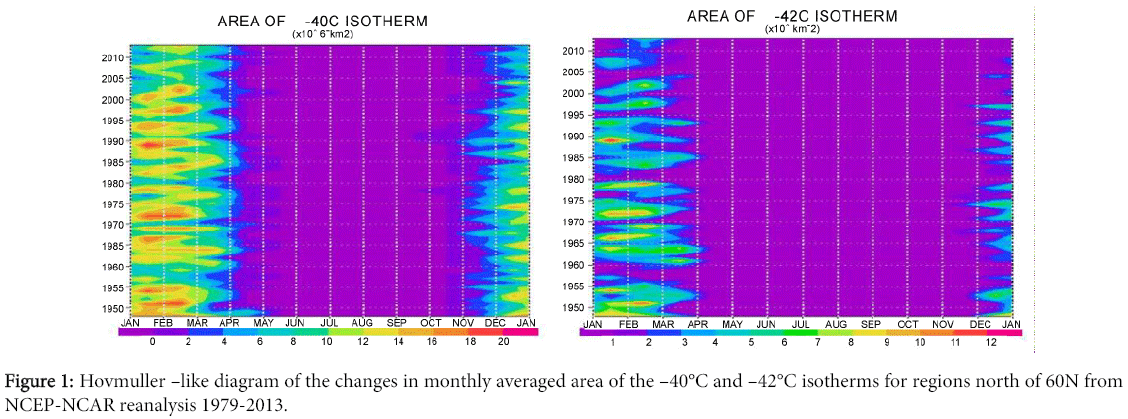
Figure 1: Hovmuller –like diagram of the changes in monthly averaged area of the –40°C and –42°C isotherms for regions north of 60N from NCEP-NCAR reanalysis 1979-2013.
Proposed physical mechanism
In several previous papers, [1-3] we provided observational and modeling evidence that the minimum Northern Hemisphere 500 mb temperature limit was convectively controlled. –42°C is the temperature expected from the moist adiabatic ascent of a convectively rising air mass after a shallow dry ascent from a surface temperature of –2.0°C, the coldest unfrozen seawater. We proposed that very cold air masses developing radiatively over frozen regions in winter would, following the general Arctic circulation, not infrequently encounter relatively warm, unfrozen seawater. Convective processes would lead to a moist adiabatic vertical temperature profile with a 500 mb temperature of approximately –42°C depending on the exact temperature of the sea surface and the details of any dry ascent. We further proposed that such an air mass, should it again move over frozen regions and whose temperature characteristics began to be dominated by radiative cooling would cool from the surface upward. The resulting stability of the air mass would leave the 500 mb temperature approximately constant thus maintaining the observed cutoff of –42°C. Observational and modeling evidence for both the warming and cooling phase of this mechanism was provided in the papers cited above.
Alternate physical mechanisms
While the above cited work has supported the explanation that minimum temperatures are convectively controlled, we have considered alternative mechanisms:
Supercooled water
Perhaps the most likely alternate explanation is that cloud processes are responsible for the observed minimum temperature in high latitudes. This is because there is a clear temperature which can be attached to the physical process. Homogeneous nucleation of water also occurs at approximately –42°C which might be an indication that cloud processes are responsible for the –42°C cutoff temperature. We reject this hypothesis for two reasons. First, the total amount of heat extracted from such phase changes must be minimal and cannot be large enough to regulate temperature over such large regions. Second, the existence of supercooled water is limited in both space and time in the Arctic and therefore can be of only local or perhaps regional importance [5,6]. It appears to us that this mechanism cannot control the minimum Arctic temperature.
Poleward heat transport
Alternatively, poleward heat transport could be responsible for the observed minimum. While it is well documented that energy is transported poleward by both the atmosphere and ocean, there is no plausible mechanism by which the specific temperature of –42°C should be a lower limit. We find no evidence of enhanced poleward transport once the northerly air masses cooled to –42°C or below.
Adiabatic sinking:
Similarly, one could imagine a role for adiabatic sinking in the Arctic atmosphere in regulating the minimum temperature. But again, the physical mechanism responsible for the particular cutoff point of –42°C is unconvincing. For a strong cutoff to occur any air mass sinking would have to cease almost immediately after the –42°C minimum temperature was reached. Moreover, with some areas of subsidence, to conserve mass, there must also be other areas with ascent, and thus further cooling in those locations. The sharp cut off of temperatures indicates such colder areas are, at most, infrequent.
Analogous to minimum 500 mb temperatures being observed in winter at high latitudes, maximum 500 mb temperatures are expected in tropical and mid-latitude regions in the warmer seasons. The vertical temperature structure of the tropical atmosphere is well known to be convectively controlled [7]. Maximum sea surface temperatures in tropical regions are observed to be about 32°C which is illustrated in the snapshot of SSTs for November 8th, 2014 in Figure 2. A moist adiabatic ascent from 32°C to 500 mb does indeed give a 500 mb temperature of –3°C, again assuming an initial, near surface, dry ascent.
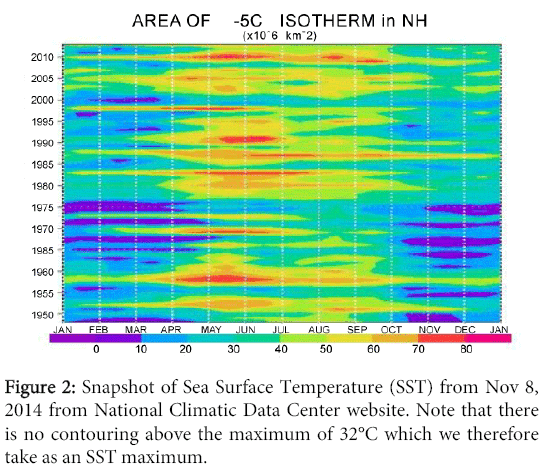
Figure 2: Snapshot of Sea Surface Temperature (SST) from Nov 8, 2014 from National Climatic Data Center website. Note that there is no contouring above the maximum of 32°C which we therefore take as an SST maximum.
Figure 3 is similar to Figure 1 except it shows the areal extent of the –5 and –3°C (i.e. maximum) isotherm in the Northern Hemisphere. In this case the –5°C isotherm begins to appear in Northern Hemisphere spring (April), but does not warm further as the northern summer proceeds; an indication of a physical limit. A further indication of this physical limit is that the area of the –3°C isotherm is near zero in almost every year.
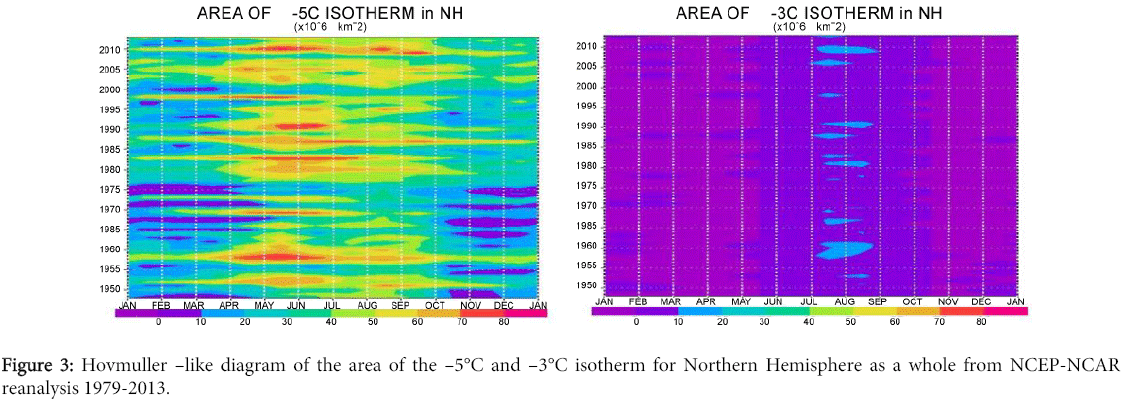
Figure 3: Hovmuller –like diagram of the area of the –5°C and –3°C isotherm for Northern Hemisphere as a whole from NCEP-NCAR reanalysis 1979-2013.
We have updated the progress of the minimum 500 mb temperatures at high northern latitudes (approximately –42°C). The limit has been maintained over the time period of the study. There does appear to be a decrease in the area of minimum temperatures in the last few years of the time series. We have also documented the existence of a maximum 500 mb temperature of approximately –3°C which appears in lower northern latitudes in the summer season. 500 mb is chosen because of its meteorological and climatological significance but represents the mid-troposphere as a whole. Therefore, northern hemisphere 500 mb temperatures are bracketed between about –42°C and –3°C.
The brackets appear to be maintained by convective activity in both cases; a result expected for the maximum in the tropics but less intuitive in the high latitude case. We reject several alternative hypotheses for the existence of the minimum temperature and conclude that convective activity effectively brackets northern hemisphere 500 mb temperatures.
This study has important implications for climate studies. We have given multiple lines of evidence here, and in preceding papers, that a natural self-regulation of the mid-troposphere exists which brackets temperatures in this atmospheric region within a band of –3°C to –42°C. Because jet stream dynamics, fronts, and baroclinic storm development are a response to the equator to pole gradient of layer averaged tropospheric temperatures [8], long-term trends in these weather processes, and therefore trends in climate variability, are constrained by this self-regulation. This will continue until SST significantly changes to warmer than –2°C in high latitudes, warmer than 32°C in the tropics, or both.
Chase received support for this work from a CIRES Innovative Research proposal grant. Pielke Sr. received support from NSF Grant 1549616. We thank both.
