Research Article - (2016) Volume 5, Issue 1
Background: Endogenous triggers such as voluntary breath-holding induce various cardiovascular responses typically including modification of blood CO2. During dynamic exercise these responses may have a negative impact on performance or may associate with cardiovascular risk subjects. Therefore, we hypothesized that voluntary breathing tests induce changes in cardiovascular (CV) oxygenation that lead to cardiovascular-functional changes, measured by a complex of integrated cardiovascular parameters and their interactions. So the aim of the study was to determine the impact of the voluntary breath-holding on changes and interplay of cardiac and peripheral parameters.
Method: 18 girls (average age: 23.4 ± 1.3 years) performed 2 voluntary breath-holdings to failure, with a 5 min rest. Cardiac functional parameters were recorded using the electrocardiogram (ECG) analysis system “Kaunas-load”. The blood flow in the calf was determined by venous occlusion plethysmography. Near-infrared spectroscopy (NIRS) was used for non-invasive monitoring of oxygen saturation in tissues (StO2).
Results: Throughout the first breath-holding, heart rate (HR) increased from 89.5 ± 3.9 bpm to 107.6 ± 4.2 bpm (P<0.05). The ECG JT interval decreased at the onset of breath-holdings, the intervals ratio (JT/RR) increased (P<0.05), and the ST-segment depression was not altered significantly. Arterial blood flow (ABF) was reduced from 3.5 ± 0.47 mL/100 mL/min to 1.64 ± 0.38 mL/100 mL/min (P<0.05) at the end of the first breath-holding. The StO2 of the calf muscles decreased during both breath-holdings. Within 60 s of recovery time, StO2 exceeded baseline 9.5% (P<0.05).
Conclusion: Breath-holding impact changes in the systemic (central) circulation and caused significant peripheral changes, i.e., decrease in arterial blood flow and oxygen saturation. The most essential alteration occurred between the HR and arterial blood pressure (ABP) parameters. The strongest interaction observed between HR and ABP, and in calf muscles - between ABF and StO2.
Keywords: Breath-holding; Cardiovascular response; Dynamic interactions
Breath-holding manoeuver as a sequence of physiological adjustment typically involve the nervous, cardiovascular, and respiratory systems acting in a manner that induces O2 conservation and the diversion of blood flow to vital organs such as the brain and heart [1]. Regular and optimal physical load increases the amount of oxygen delivered to the tissues and elimination of CO2 from the body. Respiratory efficiency is improved by increasing the strength of diaphragm and intercostal muscles, and by increasing the number of alveoli. Therefore inclusion of breath-holding exercises into the complex of athlete’s or non-athlete’s training plan could be a beneficial reinforcement of training process and could cause an improvement of ventilatory function and vital functions of the body, which lead to a good quality of life. The functional state of the body can be derived from the dynamical changes in functional parameters of the cardiovascular system during various testing manoeuvres and exercise workloads [2- 4]. Breath-holding tests (BHT) are used as an approximate parameter of cardiopulmonary reserve. BHT results of less than 20 seconds duration indicates reduced cardiac or pulmonary reserve.
As breathing is a reflex and, at the same time, voluntary action, the conscious interchange of breathing intensity and breath-holding can significantly affect the body’s vegetative functions [5,6]. The venous outflow induced by skeletal muscle contraction has been investigated by many researchers, who established that blood flow to the heart is caused by rhythmic contractions, together with coherent limb muscle contraction, and that this mechanism is even more pronounced when the heart is positioned above the contracting muscle [7,8]. Some authors provided inexact assumptions considering the cross-sectional area of vessels because of the interaction between the pumps of skeletal and respiratory muscles [9], and possibly it is in regard to unmeasured respiratory muscle pressure [8,10]. Other studies suggest that the pressure produced by the respiratory and skeletal muscle pumps is not the only factor involved in the respiratory modulation of venous return from the lower limbs, as the capacitance and compliance of the venous vasculature seem to influence this mechanism.
The data of numerous studies confirm that the respiratory muscle pump is one of the main factors that influence venous blood return to the heart. Reduced cardiac output, peripheral vasoconstriction, increased arterial blood pressure and bradycardia are the main characteristics of the human diving response [11]. The immersion of the face into cold water affects cardiovascular markers of the human diving response, which is initially enforced by apnea [12]. Because of lowered stroke volume and heart rate during apnea, the output also decreases [13]. Arterial vessel contraction influences the decrease of peripheral blood flow [13], whereas the blood flow in the carotid artery increases [14], supporting the assumption of the redistribution of blood flow toward vital organs induced by apnea. The same response is observed during exercise [15-17]. Regular physical training enhances the respiratory efficiency by increasing the strength of diaphragm, the number of alveoli and intercostal muscles. It enhances the vital capacity and prolongs the breath-holding time, thus breath-holding test is used as index of cardiopulmonary reserve, as well as endogenous vasodilator in order to reveal the dynamics of central and peripheral circulatory system parameters.
Separate indices show only a particular functionality issue; therefore, research was initiated on the correlation between integral indicators of the body’s functional performance and health indices and physical working-capacity changes. Muscles with different functions are involved in physiological testing. The body-function compatibility [18] and coherence between central and peripheral mechanisms of functional systems plays a significant role [19]. Although there are some studies, which have analysed the functioning of the central and peripheral cardiovascular mechanisms, but the extent and sequence of activation of the central and peripheral regulatory mechanisms of the circulatory system, as well as their interrelations, remain unclear. Traditional methods (i.e., correlation analysis) are suitable for the analysis of stationary objectives or to analyse each separately taken parameter, in the particular moment, when measurements are taken. All of this requires large data sets and usually conclusions are derived from averaged data on condition that biological systems’ dynamics is not considered. However, biological systems are dynamic, as they adjust to different conditions, and the relationships between their elements are constantly changing. The dynamics of the parameters and functional changes of the body system or its separate parts are largely dependent on these interactions. The matrix analysis, which allows the analysis of the dynamics of interparametric interactions, is applied when two or three synchronized parameters are co-integrated into the matrix, using only three data points from each [20]. In this study, co-integration of the following central and peripheral parameters were analysed: HR, the JT interval, JT/ RR, ST-segment depression, StO2, systolic ABP, diastolic ABP and ABF. According to our hypothesis, voluntary breath-holding induces changes in cardiovascular-functional changes, which are even more pronounced in dynamical interactions between measured cardiovascular parameters. The present study was conducted to provide a better understanding of cardiovascular response to breath-holding as well as to determine the impact of the voluntary breath-holding on dynamical changes of cardiac and peripheral parameters and interplay of these parameters.
Subjects and protocol of the trial
The subjects were 18 healthy non-athletes women with an average age of 23.4 ± 1.3 years, a height of 168.2 ± 1.1 cm, a body mass of 61.9 ± 2.5 kg, a body mass index of 21.9 ± 0.9 and vital lung capacity 3.3 ± 0.1 l. The present study was approved by the Ethics Committee of the Lithuanian University of Health Sciences (No. BEC-SRFO (M)-87. 31- 12-2012) and was conducted in accordance with the principles outlined in the Declaration of Helsinki. Prior to the initiation of the study, each of the participants read an informed consent form and signed it as an agreement to engage in all testing procedures. All participants without initial training in performance of breathing exercises were placed in a sitting position and under sudden command performed two voluntary breath-holdings (a nose clip was used to ensure the breath-holding during the apnea) to failure, with a 5 min rest interval between them (Table 1). The ambient temperature and relative humidity were kept stable at 20–21°C and 46–55%, respectively.
| Adaptation in the state of rest | 20 min | |
| Recording peripheral and systemic functional indices before the first breath-holding | Before breath-holding | Continuous plethysmography, NIRS, ECG and ABP |
| Assessment of peripheral and systemic functional indices during breath-holding | Every 15 s | |
| Assessment of peripheral and systemic functional indices after breath-holding | Every 15 s | |
| Passive rest | After breath-holding and until the recording of indices; 5 min | |
| Recording of peripheral and systemic functional indices before the second breath-holding | Before breath-holding | Continuous plethysmography, NIRS, ECG and ABP |
| Assessment of peripheral and systemic functional indices during breath-holding | Every 15 s | |
| Assessment of peripheral and systemic functional indices after breath-holding | Every 15 s |
Table 1: Protocol of the trial.
Cardiac functional parameters were recorded using the ECG analysis system “Kaunas-load”. Twelve-lead synchronized standard ECG was recorded, from which the following parameters were analysed: heart rate (HR), the JT interval, the JT and the RR interval ratio index (JT/RR), and ST-segment depression (negative-amplitude sum of all 12 leads). ECG monitored continuously from the baseline up to the end of recovery. Each cardiovascular parameter’s record was averaged by 15 s intervals.
The JT interval is one of the ECG intervals, the beginning and end of which are the J point and T wave, respectively. The point is the junction of the QRS complex and the ST- segment depression. The JT interval reflects the duration of ventricular repolarization. During physical activity, the duration of the JT interval decreases. During physical load, the JT interval is shortened because of the increased intensity of metabolic processes. According to the model of integrated evaluation, the JT/RR ratio describes the relationship between the supplying and regulatory systems.
The evaluation of changes in the RR ECG interval was based on the formula RR =HR/60. The RR interval reflects the HR and heart rhythm. To evaluate the adaptation rate, first the JT interval changes were compared with the alteration of the RR interval, which is presented as the difference between those two indices. ST-segment depression during physical load is associated with the emergence of myocardial ischemic events.
A standard ABP measurement was performed using a pneumatic cuff while listening to “Korotkov tones”. All cardiovascular functional parameters were recorded before the trial, during breath-holding and during recovery. All parameters were recorded every 15 s during and after the first and second breath-holdings.
The blood flow in the calf was determined by venous occlusion plethysmography. Changes in calf volume were determined using a modified Dohn’s plethysmograph [21]. The air-filled latex measuring cuff (width, 5 cm; pressure, 40 mm H2O) was fitted around the thickest part of the calf. Venous occlusion in the distal part of the thigh was achieved via a cuff that was inflated to a pressure of 70 mm Hg. The third cuff, which was fixed on the ankle, closed off the circulation of the foot during the measurements. During the study, which was performed in a sitting position, breath-holding duration was recorded.
Near-infrared spectroscopy was used for the non-invasive monitoring of oxygen saturation in tissues (StO2). The InSpectra Standard System Model 325, which was developed by Hutchinson Technology Inc. (Hutchinson, MN, USA), was used for this purpose. This is a non-invasive monitoring system that was designed to measure an approximated percentage of StO2. A 25 mm probe spacing (between sending and receiving fibres) on the tissue sample was used. StO2 dynamical changes were monitored continuously (every 3.5 s) during breath-holding and recovery [22]. The InSpectra sensor was placed on the calf, just below the sensor of the plethysmograph, on the medial head of the gastrocnemius muscle. Individual initial values of StO2 recorded before breath-holding were normalized as equal 100%. The dynamics of each breath-holding was calculated from the baseline and is presented as a percentage.
The evaluation of the interaction of the dynamics of the two physiological systems was performed using two synchronously recorded time series, xn (n=0, 1, 2...) and yn (n=0, 1, 2...), which corresponded to the variables analysed (xn and yn are real numbers). The initial data were normalized according to the minimum and maximum values of physiological indices. Subsequently, the variables were described using mathematical links [20].
The numerical characteristics of the second-order matrix were calculated as:

and then the main components were calculated, from which discriminant of the matrix (Dsk) as the most informative were the analysed:

A discriminant value close to zero suggests that the interaction between the system’s parameters analysed is strong and that the informativeness of individual time series is decreased.
Statistical analyses were performed using the statistical software package SPSS, version 20.0. The recorded variables exhibited parametric and non-parametric distributions. Each analysis of registered data was divided into three stages: rest, breath-holding and recovery. First, we compared samples of the first and second breath-holding. It was determined that the HR, JT/RR and StO2 of the first sample exhibited a normal distribution. The differences in HR between the breath-holding and recovery states were evaluated. Differences between particular stages were tested using Tukey’s HSD test.
The significance of differences in other indices, which did not exhibited a normal distribution, was assessed using non-parametric criteria (Kruskal–Wallis test). The correlation between the following pairs of dependent variables was also determined: HR and JT/RR, HR and StO2 and StO2 and JT/RR.
In the second analysis, we assessed the differences between SBP at rest and during breath-holding using ANOVA. Non-parametric tests were applied to the evaluation of the significance of differences between the DBP values at rest and during breath-holding. The correlation between HR and JT/RR and other variable pairs was evaluated. Finally, a comparison between all averaged indices of both trials (HR, JT/RR, JT interval, ST-Segment Depression, ABF, StO2, SBP and DBP) during breath-holding and recovery was performed.
Values are presented as means ± SE. Difference between compared parameters or trials was statistically significant, when P<0.05.
During the voluntary breath-holding test to failure, the duration of the second repeated breath-holding was greater (Table 2). During the first breath-holding, participants were able to interrupt their breathing up to60 s (45.0 ± 2.7 s), whereas in the second attempt, three participants continued to hold their breath up to 75 s (50.8 ± 3.5 s).
| Duration (s) | 15 | 30 | 45 | 60 | 75 |
| 1st breath hold (n) | 18 | 18 | 13 | 5 | 0 |
| 2nd breath hold (n) | 18 | 18 | 15 | 7 | 3 |
Table 2: Number of subjects and duration of the voluntary breath-holding.
HR. During the first breath-holding, HR (15 s) increased up to 107.6 ± 4.2 bpm (P<0.05) compared with the baseline (89.5 ± 3.9 bpm). This was followed by a decrease in HR, which decreased to 80.2 ± 6.9 bpm after 60 s. The increase in HR detected in the initial 15 s of the first breathholding was significantly higher than that of the second attempt. Other measurements of HR during the second breath-holding exhibited a pattern that was similar to that of the first breath-holding (Figure 1).
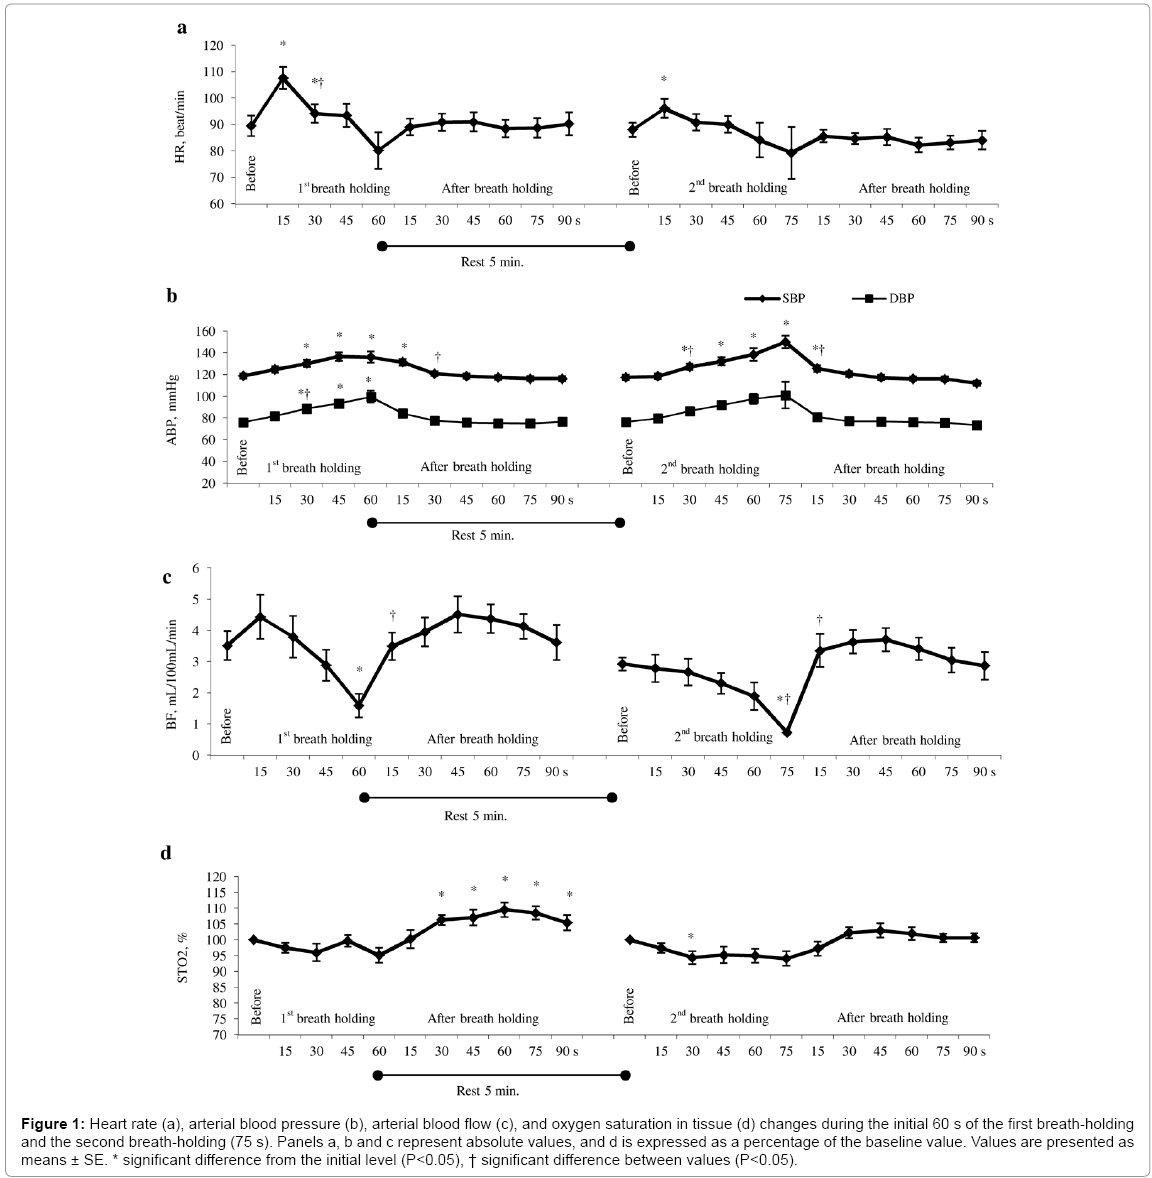
Figure 1: Heart rate (a), arterial blood pressure (b), arterial blood flow (c), and oxygen saturation in tissue (d) changes during the initial 60 s of the first breath-holding and the second breath-holding (75 s). Panels a, b and c represent absolute values, and d is expressed as a percentage of the baseline value. Values are presented as means ± SE. * significant difference from the initial level (P<0.05), † significant difference between values (P<0.05).
JT interval duration. The ECG JT interval duration during the initial 15 s of the first breath-holding decreased from 0.26 ± 0.01 s to 0.24 ± 0.01 s (P<0.05). At the end of the first respiratory hold, JT interval values had increased to 0.27 ± 0.01 s; however, this increase was not statistically significant. During the second breath-holding, the JT interval duration decreased from 0.26 ± 0.01 s to 0.25 ± 0.01 s; however, this decrease was not statistically significant. Subsequently, JT interval duration increased insignificantly. The ECG parameters of the subjects are shown in Table 3.
| Indication | JT intervals | JT/RR ratio | ST-segment depression, mV | ||||
|---|---|---|---|---|---|---|---|
| Breath-holding | Time (s) | 1st | 2nd | 1st | 2nd | 1st | 2nd |
| Before breath- holding | 0.26 ± 0.009 | 0.26 ± 0.006 | 0.38 ± 0.009 | 0.38 ± 0.007 | 0.01 ± 0.022 | 0.08 ± 0.017 | |
| Breath-holding | 15 | 0.24 ± 0.006* | 0.25 ± 0.006 | 0.42 ± 0.010* | 0.39 ± 0.006 | 0.18 ± 0.051 | 0.13 ± 0.042 |
| 30 | 0.25 ± 0.006 | 0.25 ± 0.005 | 0.39 ± 0.007† | 0.38 ± 0.007 | 0.13 ± 0.035 | 0.10 ± 0.029 | |
| 45 | 0.25 ± 0.007 | 0.26 ± 0.006 | 0.38 ± 0.010 | 0.38 ± 0.006 | 0.13 ± 0.036 | 0.10 ± 0.026 | |
| 60 | 0.27 ± 0.013 | 0.26 ± 0.008 | 0.36 ± 0.015 | 0.37 ± 0.017 | 0.12 ± 0.060 | 0.11 ± 0.044 | |
| 75 | – | 0.27 ± 0.012 | – | 0.38 ± 0.017 | – | 0.15 ± 0.101 | |
| After breath-holding | 5 | 0.26 ± 0.005 | 0.27 ± 0.006 | 0.38 ± 0.010 | 0.37 ± 0.008 | 0.12 ± 0.023 | 0.08 ± 0.015 |
| 30 | 0.26 ± 0.006 | 0.27 ± 0.005 | 0.38 ± 0.008 | 0.37 ± 0.006 | 0.10 ± 0.019 | 0.07 ± 0.012 | |
| 45 | 0.26 ± 0.006 | 0.27 ± 0.006 | 0.38 ± 0.009 | 0.37 ± 0.008 | 0.11 ± 0.025 | 0.08 ± 0.021 | |
| 60 | 0.26 ± 0.006 | 0.27 ± 0.006 | 0.38 ± 0.008 | 0.36 ± 0.007 | 0.10 ± 0.023 | 0.08 ± 0.017 | |
| 75 | 0.26 ± 0.006 | 0.27 ± 0.006 | 0.38 ± 0.008 | 0.37 ± 0.007 | 0.12 ± 0.027 | 0.07 ± 0.014 | |
| 90 | 0.26 ± 0.008 | 0.26 ± 0.007 | 0.38 ± 0.009 | 0.36 ± 0.010 | 0.10 ± 0.026 | 0.06 ± 0.015 | |
Values are presented as (means ± SE). * Significant difference from the initial level (P<0.05),† significant difference between values (P<0.05).
Table 3: ECG parameters (JT interval duration, JT/RR interval ratio and ST-segment depression) dynamics during the two breath-holdings.
JT/RR interval ratio. The ECG JT/RR ratio during the initial 15 s was significantly increased at the first breath-holding, from 0.38 ± 0.01 to 0.42 ± 0.01 (P<0.05), and at the second breath-holding, from 0.38 ± 0.01 to 0.39 ± 0.01 (P<0.05).
ST-segment depression. The ECG ST-segment depression during the initial 15 s of the first breath-holding increased from –0.1 ± 0.02 mV to –0.17 ± 0.05 mV (P>0.05). During recovery, ECG ST-segment depression changes reached the initial level. Moreover, ECG STsegment depression increased during the initial 15 s of the second breath-holding, albeit insignificantly. ST-segment depression decreased gradually during both breath-holdings. However, these ST-segment depression changes were not statistically significant in either of the cases.
ABP. The SBP recorded on the first breath-holding was essentially increased compared with the baseline (118.7 ± 2.4 mm Hg) at 15, 30, 45 and 60 s (124.8 ± 3.0 mm Hg, 130.2 ± 3.3 mm Hg, 136.5 ± 4.1 mm Hg and 136.0 ± 5.1 mm Hg, respectively). After the first breath-holding, SBP recovered to its initial level within 30 s. The results obtained for the second breath-holding time and subsequent SBP recovery were similar to those observed during the first breath-holding, but reached higher values (150.0 ± 5.8 mm Hg) (Figure 1). During both the first and second breath-holdings, DBP was altered analogously: in the first breath-holding, it increased from 76.1 ± 1.7 mm Hg to 99.7 ± 5.5 mm Hg (P<0.05); in the second breath-holding, it changed in a similar manner, although the alteration was statistically insignificant.
Arterial blood flow. The average value of arterial blood flow intensity in the calf before the first breath-holding was 3.5 ± 0.47 mL/100 mL/min. At the onset of the first breath-holding (at 15 s), ABF intensity increased to 4.4 ± 0.71 mL/100 mL/min, and then decreased, and after 60 s, it was down to 1.6 ± 0.38 mL/100 mL/min (P<0.05). During recovery, ABF changes were similar to those typical of reactive hyperemia or post-exercise hyperemia (Figure 1). ABF was lower before the second breath-holding than it was before the first one (2.9 ± 0.21 mL/100 mL/min). The ABF measured in calf muscles during the second breath-holding and its recovery were similar to those measured during the first breath-holding.
Oxygen saturation (StO2) was decreased in the calf muscles during the first breath-holding, albeit not significantly. In the 60 s recovery time, StO2 exceeded the baseline value by 9.5% (P<0.05). During the second breath-holding (at 30 s), oxygen saturation decreased by 5.6% (P<0.05). Later during the second breath-holding, StO2 values decreased, and then increased slightly during recovery.
Interactions. Considering the complexity of the human body, the effects of breath-holding impacted not only the individual dynamics of cardiovascular parameters, but also the inter-parametric changes, which were expressed in terms of second-order matrix’s discriminant values (Dsk). Figure 2a shows the body’s response to breath-holdings testing of a randomly chosen individual (representative subject A.P).
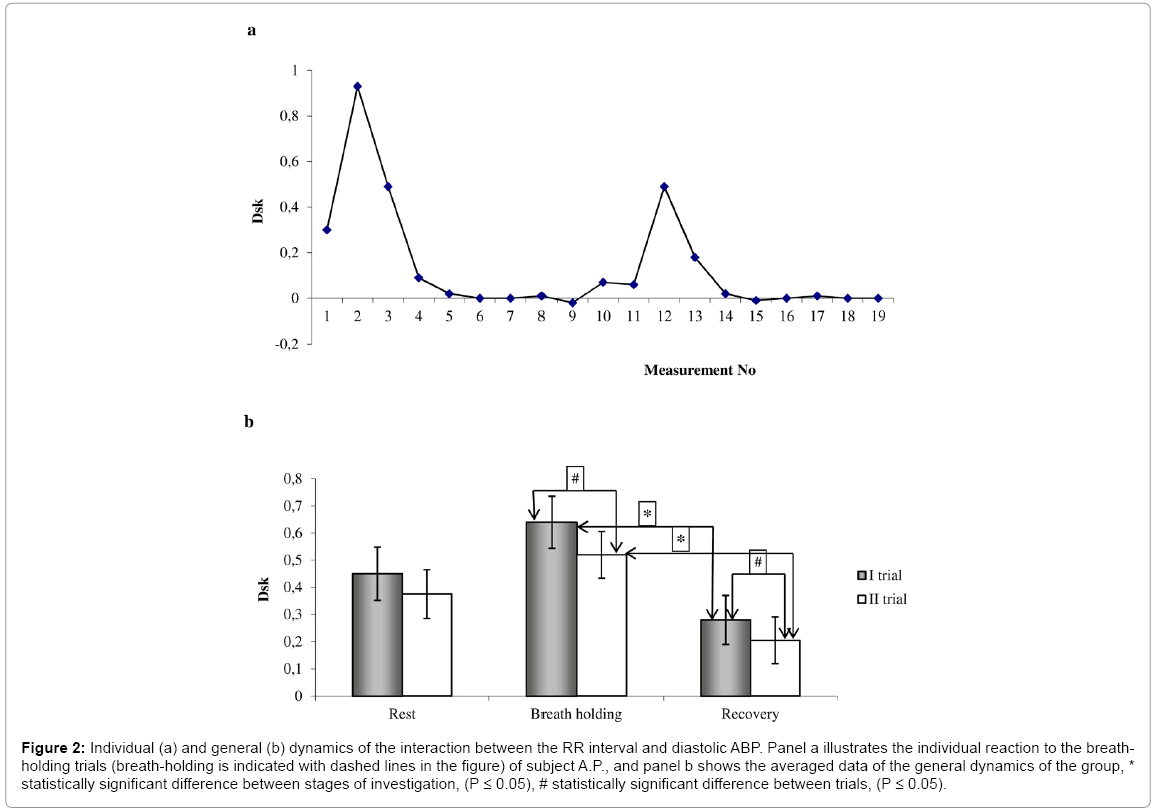
Figure 2: Individual (a) and general (b) dynamics of the interaction between the RR interval and diastolic ABP. Panel a illustrates the individual reaction to the breathholding trials (breath-holding is indicated with dashed lines in the figure) of subject A.P., and panel b shows the averaged data of the general dynamics of the group, * statistically significant difference between stages of investigation, (P ≤ 0.05), # statistically significant difference between trials, (P ≤ 0.05).
The comparison of the first and second trials’ results revealed the presence of significant changes in the assessment of different breathholding testing stages. The RR interval and DBP averaged value of discriminant of the first breath-holding were 0.642 ± 0.102, whereas after the second breath-holding, the mean discriminant value of the same interaction decreased to 0.517 ± 0.098 (P<0.05) (Figure 2b).
The comparison of the results of the first breath-holding showed that statistically significant differences were often observed between the averages of the breath-holding and recovery stages. Statistically significant changes were observed in terms of the first breath-holding for cardiovascular indices (JT interval and DBP), the discriminant value of which during breath-holding was 0.786 ± 0.105, and decreased to 0.404 ± 0.080 during the recovery time. The Dsk of the ST-segment depression and SBP during breath-holding was 0.575 ± 0.078, and increased to 0.903 ± 0.106 during the recovery time (P<0.05). The dynamics of other interactions varied in a similar fashion. The average values of the repeated breath-holdings differed significantly, not only between breathholding and recovery, but also between the rest and recovery stages. Moreover, it was established that, after repeated breath-holding testing, the greatest changes were detected in the evaluation of the dynamical relationships between central and peripheral cardiovascular parameters, e.g., between RR interval and ABF or StO2 and SBP.
The results obtained during this study confirmed the well-known statement what we can find-out in a lot of publications that that the oxygen consumption intensity of muscles depends on the change in muscle blood flow [23,24]. Alterations of the circulatory system of muscles directly affect the intensity of the oxidative metabolic processes. Thus, the perfusion of skeletal muscles at rest is relatively small, but it increases during exercise in accordance with its intensity [25]. Local blood flow increases because of central control mechanisms, resistive vascular local vasodilatation and mechanical muscle contractions. Long-term breath-holding exercises cause decreases in the blood flow of calf muscles. Of course, regular breathing exercises increase parasympathetic tone, reduce sympathetic activity, improve cardiovascular and respiratory function, reduce the effects of stress and tension in the body and improve physical and mental health [26]. This implies that yoga workouts, which accommodate paranyama exercising (suspension of breath), improve autonomic and lung functions in patients with asthma [27].
Our results revealed that StO2 changes in muscles during breathholding reflected peripheral circulatory dynamics. The intensity of the blood flow, functioning capillary volume and the associated vascular permeability, as well as the oxygen diffusion rate through the capillary membrane, are important throughout oxygen supply to the muscle chain [28,29]. Therefore, the intracellular oxygen pressure can be regarded as a certain saturation level that corresponds to the kinetic properties of oxygen consumption [30].
Holding one’s breath caused a decrease in HR, because the vasoconstriction of peripheral blood vessels increased SBP and DBP values and decreased muscle ABF intensity. Relevant peripheral vasoconstriction determines a rigorous increase in arterial blood pressure. Arterial baroreceptors are triggers that induce an extreme decrease in HR. These cardiovascular system changes could be explained by the findings of other researchers regarding the unity of the regulatory mechanisms of circulation, i.e., the following two significant principles: first, none of the numerous regulatory mechanisms work in isolation; rather, they interact synergistically. Second, almost all mechanisms directly affect the components of other regulatory mechanisms or their sensitivity: a) the quality of the heart function, b) general peripheral resistance, c) vascular capacity and d) blood volume and extracellular fluid volume, i.e., is enhanced through marked increases in both cardiac output and skeletal muscle blood flow [31,32]. As acute adaptation reactions to the breath-holding test were observed, we believe that the long-term circulation regulatory mechanisms were not affected significantly [33].
During the first breath-holding, systemic and peripheral vascular system reactions were altered ambivalently. Systemic circulation indices changed during breath-holding: HR decreased significantly because vasoconstriction of peripheral blood vessels increased SBP and DBP values, as well as ECG indices (such as the JT interval, JT/RR ratio and decreased ST-segment depression). The dynamical changes in the interaction between ST-segment depression and JT interval were statistically significant when comparing both the first and the second rest stages and breath-holding stages. The JT interval reflects the rate of metabolic processes involved in the HR. The difference in JT and RR interval changes is derived as a relative variable and indicates adaptation speed. ST-segment depression reveals ischemic events in cardiac muscle. The intensity of the peripheral blood parameters ABF and StO2 was decreased. The characteristics of functional peripheral hemodynamics were altered similarly during the second breathholding. After the first and the second breath-holding, the indices of cardiac functional condition and peripheral blood oxygen saturation recovered to the baseline values.
Due to perturbations or a set of boundary conditions, it is obtained closed-loop responses evoked in the physiologic systems that cause deviations from the equilibrium state of the human body. The dynamics of the analysed system is less complex, if dominant interactions’ responses are obtained. The dynamical changes could be used as indicator of maladaptive response to the triggers, if alter in a relatively short period of time (e.g., the onset of test or exercise, when the duration of signal oscillation is no longer than a few seconds). But loss of complexity in resting dynamics or prolonged alterations in the dynamics of assessed systems may indicate decline of physiologic system or similar malfunctions. Therefore nonlinear mathematical techniques, similar to what was used in our research, that quantify even small changes in dynamics allow revealing the onset of system’s failure.
The evaluation of the dynamics of the interaction between the RR interval and DBP revealed a significant difference between the first and second breath-holdings (P<0.05); however, their correlation was not statistically significant. The analysis of the interaction between the RR interval and the JT/RR ratio revealed a strong and significant linear relationship during the first breath-holding (rp=0.859, p=0.001) and the second breath-holding (rs=0.832, p=0.001). However, in many cases, after the second breath-holding the correlation between peripheral and systemic blood flow parameters (StO2 and SBP, DBP and JT interval, RR interval and StO2, etc.) was significantly (P<0.05) affected. In addition, the body’s mobilization rate (JT/RR) during the second breath-holding was correlated with the RR interval and was 0.832 (P=0.001). In terms of the assessment of the interrelations between these parameters, a significant difference between the first and second breath-holdings was observed.
In the analysis of breath-holdings’ effect on the cardiovascular system, many interrelated variables should be taken into account [34]. When analysing the impact of breath-holding, investigators claim that breath-holding is determined by chemical irritants, and conditioned by the metabolic activity and the respiratory response to these stimuli. The simplest way to clarify these issues or reach conclusions is to investigate each variable separately; however, the dynamics of interrelations is informative for clarification of the functional changes in the human body as a complex adaptive system [35]. In this study, we observed that breath-holding caused not only great changes in functional cardiovascular parameters, but also in their interactions, which provides additional and better insight into the changes of the analysed system and its functionality.
The analysis of the interactions between the RR interval and blood pressure indicators showed that significant changes during breathholding occurred in the interaction between the RR interval and DBP. Other authors concluded that such changes may be related to sympathetic system activity, which is directed to the sinus node [36]. As in the dynamics of the separate parameters, and in contrast with the JT interval, the JT/RR ratio during the first 15 s was increased (P<0.05) in both breath-holdings, respectively altering the interaction of these parameters, showing that physiological complexity is reduced as a consequence of low ability of the system to adapt to the abruptly changing conditions or to a stress.
Relevant ischemic events were not detected during breath-holding, so in terms of coronary circulation processes the applied breathing testing was safe (no statistically significant changes of interrelation between ST-segment depression and other parameters). Only the difference in the interaction of the ST-segment depression and JT interval between both breath-holdings was statistically relevant and that signifies the mobilisation of cardiac metabolic processes and emergency of fatigue. The decrease in calf muscle blood flow (P<0.05) during breath-holdings was also confirmed by the dynamics of the interaction between the calf muscle blood flow and DBP. Moreover, a strong connection was detected between the calf muscle blood flow and muscle oxygen saturation. Enhanced dynamical interactions between the different parameters are the sign of the decrease in complexity when the body undergoes hypoxic nature testing, which triggers regulatory mechanisms. The baroreflex, which is activated during hypoxia by the antagonistic chemoreflex, is one of the main regulatory mechanisms [36], which as we assume, that it is one of the main determinants for this kind of dynamics.
Investigation of the system with multiscale structure requires the feedback about interactions among indices that influence behaviour across multiple scales of time or space domain. HR as the determinant variable, analysed during breath-holding has been reported by other researchers [6,33], but there is a lack of studies that establish the complex approach or provide the response to breath-holdings or other influences on cardiovascular system [5,6]. When summarizing the applicability of the results obtained in this study, it should be noted that breathing exercises yielded significant changes in the cardiovascular system, not only in HR dynamics. Therefore, they seem to be an appropriate means, in addition to the arsenal of physical activity applications, to implement health-improvement measures and increase their effectiveness.
Breath-holding exercises yielded significant changes in the cardiovascular system. In the systemic (central) circulation, they caused significant changes in heart rate and arterial blood pressure, and in the peripheral circulation, they caused significant changes in arterial blood flow and oxygen saturation. The strongest dynamical interaction was observed between the heart rate and arterial blood pressure parameters. In the peripheral part of the calf muscle, arterial blood flow and arterial oxygen saturation exhibited the strongest interrelation.
This article has not been published before and it is not under consideration for publication elsewhere. This study was not supported by grants. And there is no conflict of interests for all authors.