Research Article - (2018) Volume 0, Issue 0
The issues relating to the deleterious impacts of increase temperature has serious consequences on life supporting systems in the biosphere. This study determined the role of clean energy in lowering temperature in two Niger Delta Cities (Akure and Port-Harcourt) by using statistical downscaling technique. Expost-facto research design was adopted for the study. Mean air temperature data (1986-2015) were sourced from Nigerian Meteorological Agency, and predictors data were accessed from HadCM3 archive covering 139 years and for two grid boxes (3,31 and 2,31). Statistical downscaling model version 4.2.9 was applied in downscaling analysis, while Paired‘t’ test was used for hypotheses testing. Results indicate that, predictors for temperature in Akure were MSLP (r0.75 & Pr0.63), r500 (r0.69 & Pr0.51), Rhum (r0.79 & Pr0.62) & temp (r0.86 & Pr0.72), while those for Port-Harcourt were MSLP (r0.73 & Pr0.61), r500 (r0.64 & Pr0.53), r850 (r0.68 & Pr0.52) and temp (r0.71 & Pr0.65). During model validation (2001-2015), the monthly sub-model performed better for both NCEP (Akure, r20.97, RMSE, 0.25; Port-Harcourt r20.95, RMSE, 0.34) for both locations. Downscaled mean temperature for both locations revealed that with clean technology (B2 emission-scenario), Akure temperature dropped by 2.10C, while that of Port Harcourt dropped by 0.970C. This paper therefore advocates that gas flaring in the Niger Delta Region of Nigeria be stopped and relevant laws enforced against breakers of them. Also, urban greening and the use of solar and hydro energy to supply electricity should be encouraged at all levels of government.
Keywords: Clean energy; Temperature; Downscaling; Model; Niger delta
In recent decades, there have been great concerns about the patterns and variability’s in climate parameters such as temperature [1-3]. Obviously from findings of several studies [4-7], the direction of change, is going to present severe consequences for man and his environment. It is also thought that the changes in parameters such as temperature will change the sequence and characteristic of other climate parameters such as rainfall, cloud formations etc. [8]. However, the major drivers of the changes in climate parameters have included but not limited to, anthropogenic events; bush burning; flaring of atmospheric pollutants; use of automobile engines etc. [2,9]. Besides some studies [4,10,11] claim that the observed changes in temperature characteristics globally, is traceable to the period before and the period after the industrial revolution. Ultimately, the directions of research findings are that, it is the emissions of Green-House-Gases that have exacerbated the trends of temperature globally [12-14].
Nevertheless, as a result of what the unchecked negative interactions of man with the atmosphere is capable of, intergovernmental-panel on climate change (IPCC) was established by world leaders to help observe and make available global climate information for governments of nations, so that a holistic approach to ameliorating climate issues can be achieved globally [12]. In a bid to achieve the demand for the fulfillment of the objectives establishing IPCC, several GCMs have been built to explain the past, present & future climate globally. Some of such GCMs include, HadCM2, HadCM3, BCCR_BCM2.0, CNRM-CM3, CSIRO-MK3.5, ECHam5, INMCM3_ 0, MiroC _3.2 etc [15-17] using some scenarios. Although the GCMs explains global implications of climate changes with some precision, the resolutions at which they are built are too large to explain local climate patterns [12,18-23] hence explaining with better precision what the nature of micro to mesa scale climate patterns are, there is always need to downscale [24,25]. Statistical downscaling has emerged as one of the most used methods to help connect the out puts of GCMs with local climate parameters (predictand) and therefrom to provide information required by climate impact modelers, investigators and users of climate information for other activities such as hydro-modeling, regional planning etc. [21-26]. In statistical downscaling, the major idea is to find a mathematical linkage between predictors & predictand [12,18].
Furthermore, application of the various emissions scenarios (designed by the Special Report on Emissions Scenarios; SRES), to predictand elsewhere, shows that temperature will alternate due to whichever pathway we chose. Indicating that, climate characteristics are, and will be influenced by green-house-gas emissions [4-7,21]. As a result, the developed economies are working on and are already using alternative sources of energy (not related to greenhouse gases emissions or at best reduced emissions). However, in Nigeria and other developing countries agitations are that, adopting policies on greenhouse gases emissions would undermine their quest to develop (even though they openly sign treaties on emissions reduction).
However, temperature has continued to increase due to anthropogenic activities in Nigerian cities [12]. In addition, the Nigerian government has not been serious about reducing emissions, since there is no compelling evidence that, reduction in emissions would stabilize temperature and other climate parameters locally. Mores, there are evidence emanating from downscaling literature that, depending on the level of emissions; temperature will either reduce or increase substantially [18,20,23,27-30]. These are the gaps in literature, which this study intends to fill. Therefore, this study is designed to empirically show what amount of temperature can be reduced using two emissions scenarios (A2 & B2) of the HadCM3 GCM on predictand (temperature) of two cities in the Niger Delta region, which is the hub of hydrocarbon industrial and related activities in Nigeria. It is believed that the evidence therefrom would compel the government here to do the needful in terms of emissions.
This study was carried out in two cities of the Niger Delta Region; Port Harcourt (long 6˚56'E & 7˚03'E & latitude 4˚43'N & 4˚54'N) and Akure (long 7°25’ & 7°71’ N, & latitudes 5°20’ & 5°58’ E) see Figure 1. The cities are both located in the coastal region of Nigeria with varying elevations (350 m & 16 m above sea levels for Akure and Port- Harcourt respectively) (Figure 1).
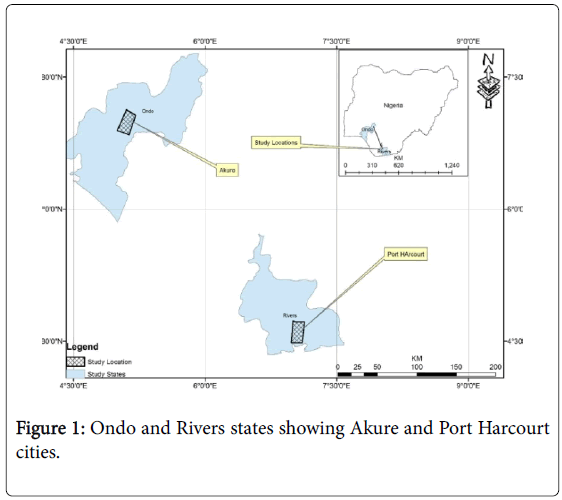
Figure 1: Ondo and Rivers states showing Akure and Port Harcourt cities.
Port Harcourt is the capital of Rivers State. It is the main city in the state and has one of the largest seaports in the Niger Delta region of Nigeria. It is the hub of industrial, commercial, administration and other activities in the state. The city lies between latitude 00231-70301 E and 50451-400151 N (Figure 1). It covers an estimated area of 1811.6 square kilometers. The city is bounded in the north by Imo and Abia States east by Akwa-Ibom State, West by Bayelsa State and south by the Atlantic Ocean. Weather systems particularly rainfall in city are primarily a result of the interplay between two major pressure and wind systems. These are the two dynamically generated sub-tropical high-pressure cells centered over Azores Archipelago (off the west coast of North Africa) and St. Hellena Islands (off the coast of Namibia). These high-pressure centers (or anticyclones) which are permanent generate and drive respectively the Northeast trade winds and the South-West winds, which are the northward extension of the re-curved Southeast trade winds of the South Atlantic Ocean. The major rainfall controls over the region are, apart from the seasonal location of the ITD, the distance inland from the coast and relief. Generally, rainfall over Nigeria diminishes with increasing distance from the moisture source in the South Atlantic. Thus, coastal areas like the Port Harcourt region, receive heavier and more persistent rainfall because the South-West wind is strong. The strength of the air mass is reduced as it penetrates inland. This also affects temperature. Ascent of air over high ground produces cooling which can lead to condensation and precipitation. This phenomenon described as orography, does not control any weather system in the region in that the area is devoid of any high lands. Pollution in the atmospheric medium travels the farthest and industrial emissions are one of the most important sources of air pollution. The implications of the location pattern of industries for pollution are many. The dominant air mass over Port Harcourt is the South West Trade Wind. Detailed wind flow characteristics over the city include periodic doses of emission from the major industrial locations around the city. The incidence of land breeze, as well as, the Harmattan factor actually transfers emissions into the city. In terms of methods the study adopted the export-facto research design and secondary data for temperature (30years-daily scale from 1986-2015) was collected from archive of the Nigerian Meteorological Agency (NIMET) for both Akure and Port Harcourt cities [29]. Both cities were purposively selected to reflect intense and non-intense hydrocarbon related industrial activity in the region. Secondly, elevation of Akure is higher (350 m above sea level) than that of Port- Harcourt; and finally, the continentally effect of the Atlantic Ocean is thought to be felt more in Akure than in Port-Harcourt. Conversely, HadCM3 predictor’s data (Table 1) were collected from the archive of Climate Change Science, Research and Data website. In all two (3, 31 and 2,31) grids boxes of HadCM3were consulted for data, owing to the spatial extent of the Niger delta region and the location of the stations after superimposing the HadCM3 grids on the region.
| Large-scale Predictor | SDSM Notation | Large-scale Predictor | SDSM Notation |
|---|---|---|---|
| Mean-sea-level pressure | MSLP | Surface-airflow | P_f |
| Surface-zonal airflow | P_U | Surface meridional-velocity | p_v |
| Surface-vorticity | P_z | Surface wind-direction | p-th |
| Surface-divergence | P_zh | 500-hpa airflow-strength | P5_f |
| 500-hpa-zonal velocity | P5-U | 500-hpa meridional | P5_v |
| 500-hpa-vorticity | P5_Z | 500-hpa geopotential-height | P500 |
| 500-hpa-wind direction | P5th | 500-hpa divergence | P5zh |
| 850-hpa-airflow strength | P8_f | 850-hpa zonal-velocity | P8_U |
| 850-hpameridional-velocity | P8_v | 850-hpa vorticity | P8-z |
| 850-hpageopotential-height | P850 | 850-hpa wind-direction | P8th |
| 850-hpa-divergence | P8zh | Relative-humidity at 500-hpa | R500 |
| Relative-humidity at 850-hpa | r850 | Near-surface relative-humidity | Rhum |
| Surface-specific humidity | Shum | Mean-temperature at 2 m | Temp |
Table 1: predictors available on the Climate Change Science, Research and Data archive.
As is with the case of other statistical downscaling practice using SDSM, the predictand data was first fed into the SDSM software, to check for quality of the data. After verification of the data quality, the predictand data were screened to find out the predictors that would best suit for calibration for SDSM operation. In which case, the correlation values and partial correlation coefficients between the NCEP predictors and predictand (local temperature) were used as yardsticks for predictor’s selection. This technique for selection of predictors for calibration was suggested by [18] and has been utilized by [12,20,29,30] with varying levels of success.
In this study the correlation and partial correlations coefficients are depicted in Table 2. In the table, it is evident that the NCEP predictors selected for calibration of the SDSM include, MSLP (r=0.75 & Pr=0.63); r500 (r=0.69 & Pr=0.51); Rhum (r=0.79 & Pr=0.62) and temp (r=0.86 & Pr=0.72) for Akure; while that for port- Harcourt were MSLP (r=0.73 & Pr=0.61); r500 (r=0.64 & Pr=0.53); r850 (r=0.68 & Pr=0.52) and temp (r=0.71 & Pr=0.65). The selected predictors also show consistency with other works on temperature downscaling globally [8,18,20,27-32].
| Predictors selected | SDSM Code | Akure | Port-Harcourt | ||
|---|---|---|---|---|---|
| Correlation coefficient | Partial correlation | Correlation coefficient | Partial correlation | ||
| Mean sea level pressure | MSLP | 0.75 | 0.63 | 0.73 | 0.61 |
| Relative humidity at 500-hpa | r 500 | 0.69 | 0.51 | 0.64 | 0.53 |
| Near surface relative humidity | Rhum | 0.79 | 0.62 | ||
| Temperature at 2 meters above sea level | Temp | 0.86 | 0.72 | 0.71 | 0.65 |
| Relative humidity at 850-hpa | r850 | 0.68 | 0.52 | ||
Table 2: Selected predictors for model calibration for Akure and Port-Harcourt metropolis.
Furthermore, the selected predictors which were based on the correlations and partial correlation values were selected for model calibration. Although, the monthly sub-model scale, performed better for both stations. During validation, the calibrated model was used to predict predictand (mean temperature) data for the remaining period of observation (2001-2015) and then the root mean square error was computed to find out the predictive capabilities of the calibrated model against observed data using the algebraic RMSE equation below.
Since the model was valid, the same predictors were used to generate ensembles for A2 (regional trade & industrial growth; high population progression & slow technological adjustments) and B2 (transitional economic expansion; temperate population rise & diverse technological change involving the use of clean technology) emissions Scenarios from 1960-2080. After which, the downscaled data generated were compared using paired t test statistics in the SPSS environment, to find out if the difference between A2 & B2 scenarios were statistically significant.
Calibration results in Table 3 indicate that the selected predictors for Akure and Port-Harcourt predict the predictand efficiently.
| Months | Akure | Port-Harcourt | ||||
|---|---|---|---|---|---|---|
| R2 | SE | P-value at 0.05 | R2 | SE | P-value at 0.05 | |
| January | 0.84 | 0.96 | 0 | 0.73 | 2.37 | 0 |
| February | 0.76 | 1.05 | 0.04 | 0.79 | 2.61 | 0 |
| March | 0.3 | 1.22 | 0 | 0.45 | 2.73 | 0 |
| April | 0.58 | 1.02 | 0 | 0.52 | 2.73 | 0 |
| May | 0.64 | 1.07 | 0 | 0.37 | 2.51 | 0 |
| June | 0.24 | 1.17 | 0 | 0.73 | 2.33 | 0 |
| July | 0.48 | 1.05 | 0 | 0.51 | 1.99 | 0 |
| August | 0.83 | 0.81 | 0 | 0.86 | 1.85 | 0 |
| September | 0.25 | 0.77 | 0 | 0.46 | 1.56 | 0 |
| October | 0.32 | 0.73 | 0 | 0.53 | 1.41 | 0 |
| November | 0.61 | 0.95 | 0 | 0.69 | 1.54 | 0 |
| December | 0.89 | 1.06 | 0.03 | 0.54 | 1.89 | 0 |
Akure: MSLP, r500, Rhum, temp Port-Harcourt: MSLP, r500, r850, temp
Table 3: Calibration for Akure and port-Harcourt (1986-2000).
The table shows that for Port Harcourt, predictand significantly depends on MSLP, r500, r850 & Temp for all months at p<0.05; and in Akure, predictand significantly depends on MSLP, r500, Rhum & Temp at p<0.05.
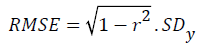
During validation (Table 4) the monthly sub-model performed better judging by the values of the R2 between modeled and observed data, RMSE, RS and P values for both Akure and Port-Harcourt. For example in Akure R2=Daily, 0.47; Monthly, 0.97 & Seasonal, 0.57; while for port-Harcourt R2=Daily, 0.67; Monthly, 0.95 & Seasonal, 0.52. Similarly, RMSE were correspondingly lower for the monthly submodel; that is 0.25 & 0.34 for Akure and Port-Harcourt respectively. This indicates that the model should be driven at the monthly submodel scale, even though at all scales the models were significant at P<0.05 for both Akure and Port-Harcourt (Table 4).
| Ncep/Had cm3 | R2 Tm | RMSE Tm | Rs Tm | P- Value at 0.05 |
|---|---|---|---|---|
| Tm | ||||
| Akure | ||||
| Daily | 0.47 | 1.02 | 1 | 0 |
| Monthly | 0.97 | 0.25 | 0.54 | 0 |
| Seasonal | 0.57 | 0.98 | 1.04 | 0 |
| Port-Harcourt | ||||
| Ncep/Had cm3 | R2 Tm | RMSE Tm | Rs Tm | P- Value at 0.05 |
| Tm | ||||
| Daily | 0.67 | 0.88 | 1 | 0 |
| Monthly | 0.95 | 0.34 | 0.98 | 0 |
| Seasonal | 0.52 | 0.99 | 1.09 | 0 |
Table 4: Validation of SDSM data for Akure and Port-Harcourt (2001-2015).
The pictorial comparison between the observed and modeled data for the validation period is revealed in Figure 2 and 3 for both Akure and port-Harcourt (Figures 2 and 3).
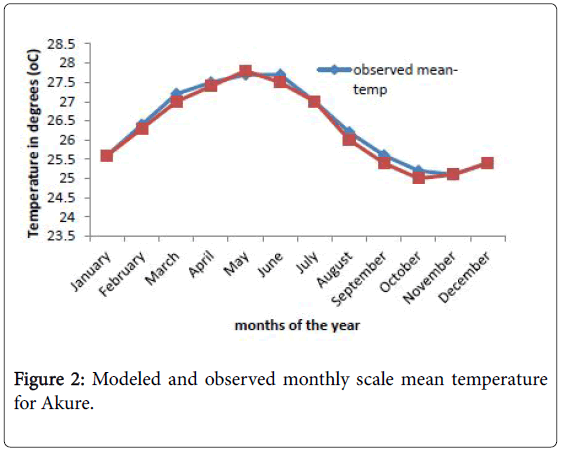
Figure 2: Modeled and observed monthly scale mean temperature for Akure.
Figure 3: Modeled and observed monthly scale mean temperature for Port-Harcourt.
In Table 5, a comparison between the downscaled A2 and B2 scenario temperature for Akure is shown. In the table mean difference between A2 & B2 is 2.1°C and the model is significant at p<0.05 t=19.95 indicating that the A2 scenario temperature is significantly higher than that of B2 scenario on an order of 2.1°C temperature difference (Table 5).
| Pair 1 | Mean | Std. Deviation | Std. Error Mean | Lower | Upper | T | df | Sig(2-tailed) |
|---|---|---|---|---|---|---|---|---|
| A2 scenario – B2 scenario | 2.081 | 1.8438 | 0.9941 | 0.7304 | 2.081 | 19.951 | 43799 | 0 |
Table 5: Paired difference between downscaled A2 and B2 mean temperature for Akure (1960-2080).
In Table 6 a comparison between the downscaled A2 and B2 scenario temperature for Port-Harcourt is shown. In the table mean difference between A2 & B2 is 0.98°C and the model is significant at p<0.05 t=17.14 indicating that the A2 scenario temperature is significantly higher than that of B2 scenario on an order of 0.98°C temperature difference (Table 6).
| Pair 1 | Mean | Std. Deviation | Std. Error Mean | Lower | Upper | T | Df | Sig(2-tailed) |
|---|---|---|---|---|---|---|---|---|
| Port-harcourt A2 – Port-harcourt B2 | 0.975 | 0.44212 | 0.00284 | 0.12319 | 0.97472 | 17.136 | 43799 | 0 |
Table 6: paired difference between downscaled A2 and B2 mean temperature for Port-Harcourt (1960-2080).
This study utilized HadCM3data sets for temperature downscaling in Port Harcourt and Akure, Nigeria. The downscaling was performed based on an empirical link between observed local temperature data collected from Nigerian Meteorological agency (predictand) and HadCM3 data sets (predictors). Two stations (Akure and Port- Harcourt) located in the Niger Delta Region were selected based on the quest of the study which is to unravel the impacts clean technology would have on temperature in the region, since the area is saddled with oil exploration and exploitation activities. Nevertheless, the rates of gas flaring though occur in both cities of the region; that of Port Harcourt is more severe than that of Akure. Therefore, the researchers thought that the characteristics of temperature and gain would therefore be different. Similarly, the continentally effect and other coastal climate controls of climate was thought would vary significantly between the two cities as port Harcourt is more of an island than Akure which is more hinterland and with varying elevations respectively.
Calibration (1986-2000) and validation (2001-2015) using the NCEP data sets & predictand was successful, indicating that the SDSM software was applicable to temperature downscaling in the region, which could also be an added advantage in understudying historical temperature patterns, since the area lacks such information. This idea corroborates that of [12]. Also, worthy of note is that the selection of predictors for model-calibration purposes, indicated that Akure temperature is influenced by MSLP, r500, Rhum & temp; while that of Port Harcourt is influenced by MSLP, r500, r850 and Temp. These predictors have also been used by researchers who downscaled temperature elsewhere [3,5,6,8]. In addition, the downscaled temperature indicates that between the daily, monthly and seasonal scales, the model performed better at the monthly sub-model scale. This therefore signifies that, the downscaled temperature data may not be suitable for analyzing heat stress, and future energy budget, but it provides a fair idea of what the future temperature sequence would look like and what influence reduction in greenhouse gases emissions and introduction of clean technology, would have on temperature. The downscaled temperature is therefore suitable for temperature forecasting, and retrospective investigation of temperature patterns in the area.
Nonetheless, what is fascinating is that the B2 scenario temperature for both Akure and Port-Harcourt are significantly lower than that of A2 emissions scenario [18-22]. There by making a case for the adoption of clean technology and other assumptions of the HadCM3 B2 scenario. Furthermore, the temperature gain for Port-Harcourt is lower than that of Akure, thereby justifying the authors need to select the two cities for investigation in the first place. The reason adducible for this variation in temperature gains include; the fact that greenhouse gases once emitted takes a longer time to clear-up from the atmosphere. Therefore, what is on ground in the region suggests that gas flaring is higher in Port Harcourt as compared with Akure; populations are significantly higher in port-Harcourt than in Akure. It is therefore logical to substantiate that Akure would have a more reduced temperature as compared with Port-Harcourt. By extension, the study suggests that the adoption of clean technology is long overdue in the region.
However, as with the case of other GCMs modeling applications, uncertainty exists in the outputs, as no model can fully reproduce a natural process without errors [33]. However, it behaves on the researcher to minimize the sources of error introduction in a model during calibration and validation. This has been done with the aid of RMSE and SE in this study. It therefore indicates that the predictions inherent in this study may not be exactly what will be experienced in the future, as temperature may be slightly lower or higher in. Finally, findings of this study necessitate application of more GCMs to temperature and other predictand in the area, so that the biases in HadCM3 data can be properly spotted and smoothened. Also, the flaring of gases in the region should be stopped and relevant laws pertaining to it, enforced. Furthermore, urban greening and the use of solar energy are needed at all levels. There is also need to intensify climate sciences in the region, while encouraging the building of Nigeria’s own GCM using local emission rates. If these are done the imminent climate, change can be ameliorated and impacts averted.
We like to express our sincere gratitude to Wilby RL & Dawson CW for making the SDSM available free download.
