Research Article - (2015) Volume 3, Issue 1
Keywords: Monsoon; Rain days; Maximum daily temperature; Recent climate trends; Climate change detection
Global average temperature has increased by 0.85°C (0.6-1.05°C) during the post-industrial period (1880-2012) with an increase over the most recent decade (2003-2012) of ca. 0.78°C (0.72-0.85°C) [1,2] and it is extremely likely that more than half of the observed increased in the latter part of the 20th century is anthropogenic [3]. The increase in global temperature is reflected at a regional scale across much of Asia [4-8]. Changes in mean temperature are accompanied by an increase in minimum temperature and in the frequency of extreme temperatures and heatwaves in many regions, including Asia [2,7]. Increases in global temperature are expected to lead to increases in precipitation [9]. Although increases in precipitation over mid-latitude land areas have been detected during the latter part of the 20th century [2], it is more difficult to detect changes in monsoon regions where high-quality records are shorter and the impact of short-term climate variability is large. Nevertheless, several studies have suggested that monsoon precipitation is increasing in parts of Asia [10,11].
Bangladesh is a predominantly agricultural country, and hence likely to be very sensitive to changes in climate. It has been predicted that Bangladesh could lose up to 17% of its land area and 30% of its food production as a result of the impacts of anticipated climate changes by 2050, while Hertel et al. [12] have suggested that Bangladesh will experience a 15% net increase in poverty by 2030 as a result of climate change. From this perspective, the Halda River Basin in south-eastern Bangladesh, is particularly important because it is the major spawning ground for Indian carp and sustains pisciculture in Bangladesh [13]. Fish constitute ca. 63% of the daily protein consumption in Bangladesh and pisciculture is responsible for 5-6% of the nation’s gross domestic product [13].
There have been several studies on the detection of climate changes in Bangladesh [14-26] but the focus has largely been on individual climate variables and there has been little attempt to determine how changes in e.g. mean temperature are related to or influence other aspects of the regional climate. Furthermore, these studies have focused on the country as a whole rather than on areas that are most important from an agricultural point of view. In this study, we examine meteorological records from south-eastern Bangladesh to determine whether there are coherent trends in climate over recent decades, taking the opportunity to extend the analyses to cover the interval to 2013. In addition to individual temperature and precipitation trends that have been the focus of previous analyses of the climate of Bangladesh, we also explore trends in related climate variables (humidity, cloud cover, wind speed) in order to explain the mechanisms underpinning the changes in temperature and precipitation.
South-eastern Bangladesh has a typical tropical monsoon climate, with most of the rainfall occurring during the monsoon season from June to September. The seasonal cycle of temperature is mediated by the monsoon, with lowest temperatures in January (ca. 16-20°C) but highest temperatures (ca. 38-40°C) in April just before the onset of the monsoon.
Daily data on maximum and minimum daytime temperature, precipitation, relative humidity, cloud cover and wind speed are available from four meteorological stations in south-eastern Bangladesh: Chittagong, Sitakunda, Rangamati and Cox’s Bazar (Figure 1 and Table 1). Mean daily temperature was derived as the average of maximum and minimum daytime temperature, and diurnal temperature range as the difference between these variables. Sunshine data was only available for 3 of the stations, and thus is not used in our analyses. The records cover the period of 1980 to 2013, except in the case of Chittagong. The Chittagong station was moved in 2003. To avoid problems of inhomogeneity, analyses were performed on data from the interval 1980 to 2002 only for this station. The climate of south-eastern Bangladesh has three distinct seasons: the pre-monsoon season is from March through May; the monsoon season is June through September; and the post-monsoon season is October through February. Monthly, seasonal and annual averages were calculated for all the climate variables. No attempt was made to infill missing values of the daily observations, and the averages were only calculated for those months, seasons or years for which there were no missing values. The number of observations used therefore varies between variables and stations (Table 1).
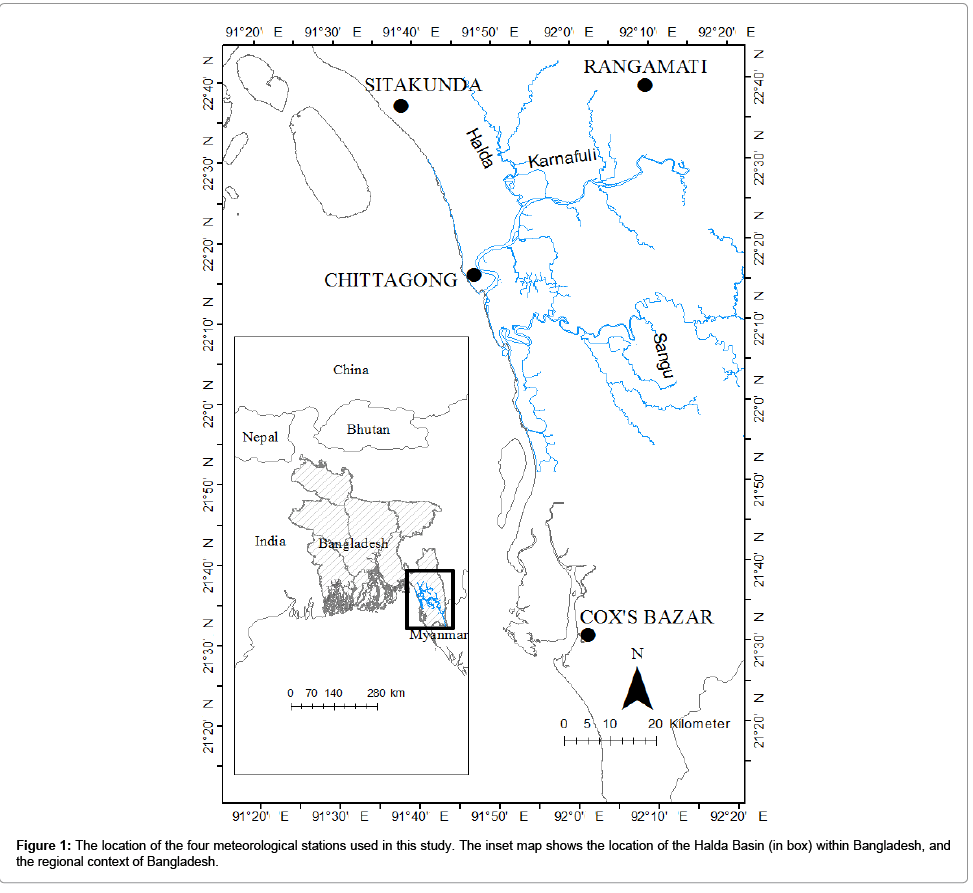
Figure 1: The location of the four meteorological stations used in this study. The inset map shows the location of the Halda Basin (in box) within Bangladesh, and the regional context of Bangladesh.
| Station | Lat (°N) | Long (°E) | Elevation (m) | Period covered | No of monthly observations | |||||||||||||||||
|---|---|---|---|---|---|---|---|---|---|---|---|---|---|---|---|---|---|---|---|---|---|---|
| Maximum temperature (°C) | Minimum temperature (°C) | Precipitation (mm) | Cloud (tenths) | Wind speed (km per h) | Humidity (%) | |||||||||||||||||
| Pre | Mon | Post | Pre | Mon | Post | Pre | Mon | Post | Pre | Mon | Post | Pre | Mon | Post | Pre | Mon | Post | |||||
| Cox’s Bazar | 21.45 | 91.97 | 2 | 1980-2013 | 83 | 106 | 136 | 84 | 122 | 154 | 86 | 127 | 108 | 99 | 131 | 164 | 99 | 132 | 165 | 99 | 131 | 164 |
| Chittagong | 22.22 | 91.80 | 6 | 1980-2002 | 55 | 79 | 102 | 60 | 82 | 100 | 58 | 86 | 82 | 65 | 88 | 109 | 66 | 88 | 110 | 65 | 88 | 109 |
| Rangamati | 22.63 | 92.15 | 69 | 1980-2013 | 87 | 125 | 161 | 98 | 133 | 164 | 90 | 130 | 113 | 98 | 132 | 163 | 99 | 132 | 165 | 98 | 132 | 163 |
| Sitakunda | 22.63 | 91.70 | 7 | 1980-2013 | 98 | 125 | 162 | 94 | 126 | 161 | 94 | 128 | 107 | 99 | 132 | 165 | 99 | 132 | 165 | 102 | 136 | 170 |
Table 1: Information about the meteorological stations. Latitude (Lat) and longitude (Long) are given in decimal degrees, elevation (Elev) in meters. Averages were only calculated for periods (months, seasons, years) when there were no missing daily observations, and therefore the number of intervals used in these calculations varies by site and by variable. The number of monthly observations within the pre-monsoon (Pre), monsoon (Mon) and post-monsoon (Post) seasons for each site and variable is given.
Linear regression between climate index and year number was used to determine whether there were trends in the observations [27,28]. The significance of the trends was determined using a t-test, with a 95% cut-off for significance (i.e. the probability of accepting the null hypothesis of no change is <0.05). A 95% cut-off, rather than a 99% cut-off, was used because of the comparatively short length of the records examined. The r2 value provides a measure of the goodness of- fit of the relationships, and is lower when there is a large scatter around the regression line. It will always be close to zero when there is no significant trend. The slope coefficients from the regressions were then used to estimate the magnitude of the change, over the length of the record, expressed as change per decade.
All of the stations show a significant increase in maximum daily temperature (Figure 2) in the annual mean over the interval of observations. This positive trend is present in all seasons (and most individual months) at Cox’s Bazar, Rangamati and Sitakunda (Tables 2 and 3). A positive trend (i.e. an increase in maximum daily temperature over the interval with observations) is also seen in every season at Chittagong, but is only significant for the monsoon and post-monsoon seasons, and for the month of April during the pre-monsoon season. The lack of significance in the pre-monsoon season overall probably reflects the shortness of the length of record (22 years) for this station. The increase in maximum daily temperature is less marked in the monsoon season than in either the pre- or post-monsoon seasons, with values in the range of 0.4 to 0.6°C per decade compared to a range of 0.5 to 0.7°C per decade in the pre-monsoon and 0.5 to 1.1°C per decade in the post-monsoon interval (absolute values per decade calculated from slope coefficients given in Table 2).
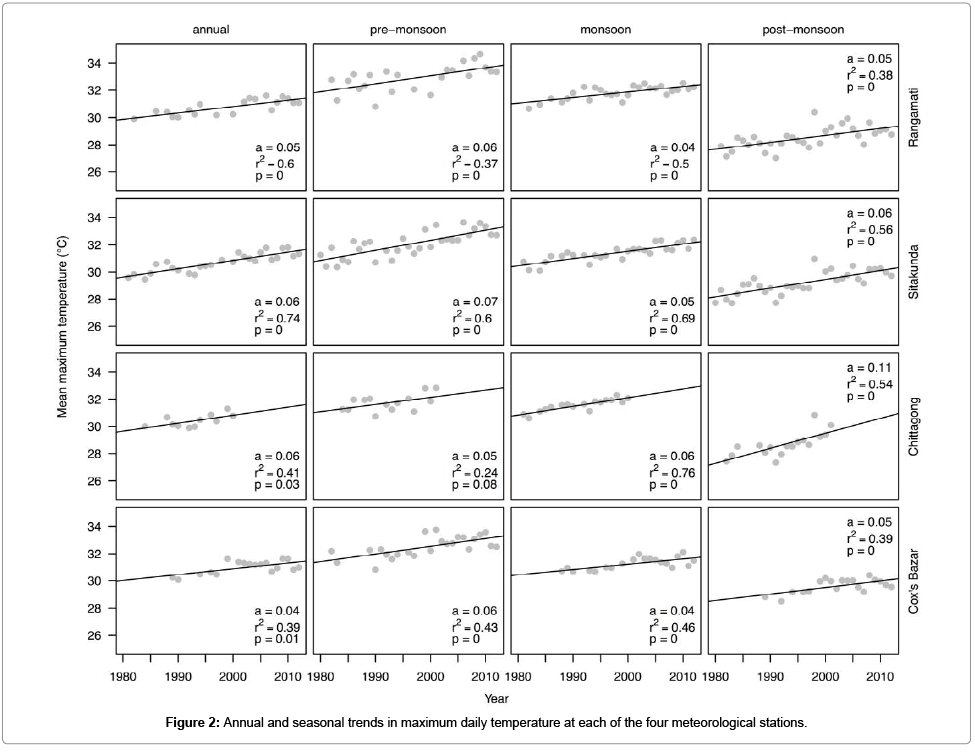
Figure 2: Annual and seasonal trends in maximum daily temperature at each of the four meteorological stations.
| Station | Variables | Code | Annual | Pre- monsoon |
Monsoon | Post-monsoon |
|---|---|---|---|---|---|---|
| Cox's Bazar | Mean daily temperature (°C) | Tmean | 0.02 | 0.02 | 0.01 | 0.01 |
| Maximum daily temperature (°C) | Tmax | 0.04 | 0.06 | 0.04 | 0.05 | |
| Minimum daily temperature (°C) | Tmin | 0.02 | 0.04 | 0.01 | 0.01 | |
| Diurnal temperature range (°C) | DTR | 0.03 | 0.03 | 0.05 | 0.03 | |
| Maximum daily precipitation (mm) | Pmax | 2.41 | 2.32 | 2.25 | 0.32 | |
| Mean daily precipitation on rain days (mm) | Pmean | 0.08 | 0.40 | 0.04 | 0.02 | |
| Total precipitation (mm) | Ptot | 12.41 | 8.13 | 6.90 | -1.88 | |
| Number of rain days | Pwet | 0.03 | 0.02 | 0.10 | -0.09 | |
| Cloud cover (tenths) | Cloud | -0.01 | -0.01 | 0.00 | -0.01 | |
| Humidity (%) | Hum | -0.02 | -0.05 | -0.04 | 0.00 | |
| Wind speed (km per hr) | Wind | -0.04 | -0.05 | -0.03 | -0.04 | |
| Chittagong | Mean daily temperature (°C) | Tmean | 0.03 | 0.02 | 0.03 | 0.04 |
| Maximum daily temperature (°C) | Tmax | 0.06 | 0.05 | 0.06 | 0.11 | |
| Minimum daily temperature (°C) | Tmin | 0.02 | 0.02 | 0.04 | 0.02 | |
| Diurnal temperature range (°C) | DTR | 0.03 | 0.03 | 0.01 | 0.05 | |
| Maximum daily precipitation (mm) | Pmax | -7.39 | 2.04 | -7.46 | 2.33 | |
| Mean daily precipitation on rain days (mm) | Pmean | 0.10 | 0.38 | 0.01 | 0.15 | |
| Total precipitation (mm) | Ptot | 7.31 | 3.37 | 0.81 | 4.31 | |
| Number of rain days | Pwet | -0.10 | -0.31 | -0.08 | 0.19 | |
| Cloud cover (tenths) | Cloud | 0.02 | 0.00 | 0.01 | 0.02 | |
| Humidity (%) | Hum | 0.12 | 0.07 | 0.02 | 0.18 | |
| Wind speed (km per hr) | Wind | -0.11 | -0.18 | -0.12 | -0.06 | |
| Rangamati | Mean daily temperature (°C) | Tmean | -0.01 | 0.00 | 0.00 | -0.03 |
| Maximum daily temperature (°C) | Tmax | 0.05 | 0.06 | 0.04 | 0.05 | |
| Minimum daily temperature (°C) | Tmin | -0.02 | 0.00 | 0.00 | -0.05 | |
| Diurnal temperature range (°C) | DTR | 0.08 | 0.06 | 0.05 | 0.10 | |
| Maximum daily precipitation (mm) | Pmax | -0.32 | -0.32 | 0.31 | 0.30 | |
| Mean daily precipitation on rain days (mm) | Pmean | -0.08 | -0.18 | -0.07 | -0.01 | |
| Total precipitation (mm) | Ptot | 6.84 | -1.72 | 9.52 | 1.23 | |
| Number of rain days | Pwet | 0.90 | 0.14 | 0.72 | 0.13 | |
| Cloud cover (tenths) | Cloud | -0.02 | -0.01 | 0.00 | -0.03 | |
| Humidity (%) | Hum | 0.07 | 0.02 | 0.03 | 0.13 | |
| Wind speed (km per hr) | Wind | -0.02 | -0.01 | -0.03 | 0.00 | |
| Sitakunda | Mean daily temperature (°C) | Tmean | -0.03 | -0.02 | -0.01 | -0.06 |
| Maximum daily temperature (°C) | Tmax | 0.06 | 0.07 | 0.05 | 0.06 | |
| Minimum daily temperature (°C) | Tmin | 0.00 | -0.01 | 0.00 | -0.02 | |
| Diurnal temperature range (°C) | DTR | 0.07 | 0.08 | 0.05 | 0.09 | |
| Maximum daily precipitation (mm) | Pmax | -0.32 | -0.24 | 1.26 | -1.15 | |
| Mean daily precipitation on rain days (mm) | Pmean | -0.02 | -0.04 | 0.20 | -0.29 | |
| Total precipitation (mm) | Ptot | 9.20 | -0.41 | 23.30 | -4.62 | |
| Number of rain days | Pwet | 0.40 | 0.07 | 0.29 | 0.02 | |
| Cloud cover (tenths) | Cloud | -0.01 | -0.02 | -0.01 | -0.02 | |
| Humidity (%) | Hum | 0.27 | 0.18 | 0.17 | 0.39 | |
| Wind speed (km per hr) | Wind | -0.05 | -0.06 | -0.05 | -0.04 |
Table 2: Observed trends in annual and seasonal climate at individual meteorological stations. The values given are the slope coefficients from the linear regression; values in bold are significant (i.e. show a trend) at the 95% confidence level.
| Station | Variables | Code | Jan | Feb | Mar | Apr | May | Jun | Jul | Aug | Sep | Oct | Nov | Dec |
|---|---|---|---|---|---|---|---|---|---|---|---|---|---|---|
| Cox's Bazar | Mean daily temperature (°C) | Tmean | 0.00 | 0.02 | 0.02 | 0.03 | 0.00 | 0.03 | 0.01 | 0.01 | 0.00 | 0.01 | 0.01 | 0.02 |
| Maximum daily temperature (°C) | Tmax | 0.04 | 0.08 | 0.08 | 0.05 | 0.04 | 0.06 | 0.03 | 0.05 | 0.04 | 0.04 | 0.05 | 0.04 | |
| Minimum daily temperature (°C) | Tmin | 0.02 | 0.03 | 0.05 | 0.03 | 0.01 | 0.02 | 0.01 | 0.01 | 0.01 | 0.02 | 0.01 | 0.04 | |
| Diurnal temperature range (°C) | DTR | 0.01 | 0.05 | 0.02 | 0.03 | 0.03 | 0.05 | 0.04 | 0.05 | 0.04 | 0.02 | 0.03 | 0.01 | |
| Maximum daily precipitation (mm) | Pmax | -0.10 | -0.17 | 0.18 | 0.18 | 2.16 | 1.80 | 1.25 | 1.22 | 0.06 | 1.62 | -1.44 | -0.34 | |
| Mean daily precipitation on rain days (mm) | Pmean | -0.02 | 0.37 | 0.08 | -0.05 | 0.49 | 0.08 | 0.21 | 0.15 | 0.00 | 0.27 | -0.72 | -0.10 | |
| Total precipitation (mm) | Ptot | -0.08 | -0.30 | -0.32 | -1.20 | 8.37 | -0.60 | 4.42 | 5.78 | 2.40 | 3.61 | -2.46 | -0.22 | |
| Number of rain days | Pwet | -0.01 | -0.05 | -0.04 | -0.06 | 0.11 | -0.06 | -0.03 | 0.09 | 0.12 | 0.10 | -0.02 | -0.02 | |
| Cloud cover (tenths) | Cloud | -0.01 | -0.02 | -0.01 | -0.02 | 0.01 | -0.01 | 0.00 | 0.01 | 0.01 | 0.01 | -0.02 | 0.00 | |
| Humidity (%) | Hum | 0.04 | -0.07 | -0.05 | -0.07 | -0.02 | -0.12 | -0.05 | -0.03 | 0.03 | 0.07 | 0.02 | 0.06 | |
| Wind speed (km/hr) | Wind | -0.05 | -0.03 | -0.05 | -0.05 | -0.05 | -0.04 | -0.05 | -0.03 | -0.02 | -0.03 | -0.06 | -0.06 | |
| Chittagong | Mean daily temperature (°C) | Tmean | -0.01 | 0.04 | 0.04 | 0.05 | 0.01 | 0.04 | 0.03 | 0.03 | 0.02 | 0.04 | 0.05 | 0.04 |
| Maximum daily temperature (°C) | Tmax | 0.04 | 0.08 | 0.08 | 0.11 | 0.01 | 0.07 | 0.05 | 0.03 | 0.05 | 0.07 | 0.08 | 0.10 | |
| Minimum daily temperature (°C) | Tmin | -0.04 | 0.03 | 0.00 | 0.04 | 0.04 | 0.04 | 0.03 | 0.04 | 0.02 | 0.04 | 0.06 | -0.01 | |
| Diurnal temperature range (°C) | DTR | 0.07 | 0.04 | 0.06 | 0.03 | -0.01 | 0.01 | 0.02 | 0.00 | 0.02 | 0.01 | 0.03 | 0.07 | |
| Maximum daily precipitation (mm) | Pmax | 0.18 | 0.83 | -0.25 | -0.74 | 2.10 | -3.91 | -4.79 | -1.89 | -0.45 | 3.06 | 0.49 | 0.15 | |
| Mean daily precipitation on rain days (mm) | Pmean | 0.30 | 0.68 | 0.00 | -0.06 | 0.72 | -0.23 | -0.15 | -0.05 | -0.08 | 0.37 | -0.51 | 0.60 | |
| Total precipitation (mm) | Ptot | 0.22 | 1.44 | -0.22 | -4.86 | 8.44 | -2.30 | -7.97 | -1.16 | 0.56 | 4.35 | 0.91 | 0.47 | |
| Number of rain days | Pwet | 0.00 | 0.01 | -0.09 | -0.24 | 0.03 | -0.02 | -0.14 | -0.06 | 0.12 | 0.24 | 0.08 | -0.02 | |
| Cloud cover (tenths) | Cloud | 0.01 | 0.02 | -0.02 | -0.04 | 0.06 | -0.01 | 0.01 | 0.01 | 0.02 | 0.07 | 0.03 | 0.00 | |
| Humidity (%) | Hum | 0.27 | 0.29 | 0.09 | 0.01 | 0.12 | -0.01 | -0.01 | 0.03 | 0.06 | 0.13 | 0.32 | 0.20 | |
| Wind speed (km/hr) | Wind | -0.11 | -0.14 | -0.11 | -0.31 | -0.12 | -0.13 | -0.15 | -0.14 | -0.06 | -0.04 | -0.06 | -0.01 | |
| Rangamati | Mean daily temperature (°C) | Tmean | -0.05 | -0.01 | 0.00 | 0.01 | 0.00 | 0.00 | 0.01 | 0.00 | 0.00 | -0.01 | -0.03 | -0.05 |
| Maximum daily temperature (°C) | Tmax | 0.04 | 0.08 | 0.09 | 0.07 | 0.04 | 0.04 | 0.05 | 0.05 | 0.05 | 0.04 | 0.05 | 0.05 | |
| Minimum daily temperature (°C) | Tmin | -0.08 | -0.06 | -0.03 | 0.00 | 0.00 | 0.01 | 0.00 | 0.00 | -0.01 | -0.02 | -0.06 | -0.07 | |
| Diurnal temperature range (°C) | DTR | 0.12 | 0.15 | 0.10 | 0.06 | 0.03 | 0.04 | 0.04 | 0.05 | 0.06 | 0.06 | 0.10 | 0.11 | |
| Maximum daily precipitation (mm) | Pmax | 0.10 | -0.75 | -0.05 | -0.69 | -0.06 | 1.76 | 0.21 | -2.45 | 0.60 | 0.48 | -0.59 | -0.18 | |
| Mean daily precipitation on rain days (mm)) | Pmean | 0.01 | -0.50 | -0.24 | -0.20 | -0.18 | 0.23 | -0.22 | -0.27 | -0.11 | 0.02 | -0.15 | -0.35 | |
| Total precipitation (mm) | Ptot | 0.13 | -1.26 | -0.39 | -1.84 | 0.62 | 6.42 | -1.85 | -2.30 | 2.23 | 2.78 | -0.99 | -0.05 | |
| Number of rain days | Pwet | 0.01 | -0.07 | 0.01 | -0.02 | 0.15 | 0.09 | 0.14 | 0.18 | 0.20 | 0.16 | 0.00 | 0.01 | |
| Cloud cover (tenths) | Cloud | -0.02 | -0.03 | -0.01 | -0.03 | 0.01 | 0.00 | 0.00 | 0.00 | 0.00 | 0.00 | -0.06 | -0.04 | |
| Humidity (%) | Hum | 0.17 | -0.07 | -0.09 | 0.02 | 0.06 | 0.04 | 0.00 | 0.04 | 0.06 | 0.15 | 0.18 | 0.19 | |
| Wind speed (km/hr) | Wind | 0.02 | 0.01 | 0.00 | -0.03 | -0.01 | -0.01 | -0.03 | -0.06 | -0.03 | -0.03 | -0.02 | 0.00 | |
| Sitakunda | Mean daily temperature (°C) | Tmean | -0.08 | -0.05 | -0.02 | -0.01 | -0.01 | -0.01 | -0.01 | -0.01 | -0.02 | -0.03 | -0.05 | -0.07 |
| Maximum daily temperature (°C) | Tmax | 0.05 | 0.09 | 0.09 | 0.07 | 0.06 | 0.05 | 0.06 | 0.05 | 0.05 | 0.07 | 0.06 | 0.05 | |
| Minimum daily temperature (°C) | Tmin | -0.05 | -0.03 | -0.02 | -0.02 | 0.00 | 0.00 | 0.01 | 0.00 | 0.00 | 0.00 | -0.01 | -0.02 | |
| Diurnal temperature range (°C) | DTR | 0.10 | 0.14 | 0.10 | 0.09 | 0.05 | 0.05 | 0.05 | 0.05 | 0.06 | 0.06 | 0.08 | 0.07 | |
| Maximum daily precipitation (mm) | Pmax | 0.10 | -0.18 | -0.70 | -0.64 | 0.37 | 1.08 | 1.05 | 1.79 | 1.06 | -0.11 | -0.90 | -0.23 | |
| Mean daily precipitation on rain days (mm) | Pmean | 0.01 | 0.06 | -0.53 | -0.14 | 0.06 | 0.22 | 0.06 | 0.12 | -0.08 | -0.24 | -0.71 | -0.39 | |
| Total precipitation (mm) | Ptot | 0.14 | -0.25 | -1.60 | -2.32 | 3.52 | 4.25 | 2.45 | 4.73 | 2.88 | -0.72 | -1.64 | -0.20 | |
| Number of rain days | Pwet | 0.01 | -0.04 | -0.02 | -0.05 | 0.13 | 0.01 | 0.05 | 0.08 | 0.17 | 0.10 | 0.00 | 0.00 | |
| Cloud cover (tenths) | Cloud | -0.01 | -0.02 | -0.02 | -0.04 | -0.01 | -0.01 | -0.01 | 0.00 | 0.00 | 0.00 | -0.03 | -0.02 | |
| Humidity (%) | Hum | 0.47 | 0.28 | 0.17 | 0.18 | 0.19 | 0.18 | 0.12 | 0.16 | 0.21 | 0.31 | 0.42 | 0.52 | |
| Wind speed (km/hr) | Wind | -0.04 | -0.02 | -0.04 | -0.09 | -0.05 | -0.05 | -0.06 | -0.06 | -0.05 | -0.03 | -0.05 | -0.04 |
Table 3: Observed trends in monthly climate at individual meteorological stations. The values given are the slope coefficients from the linear regression; values in bold are significant (i.e. show a trend) at the 95% confidence level.
Although the recent change in maximum daily temperature is coherent at all four stations, the trends in minimum daily temperature differ between the southern (Cox’s Bazar, Chittagong) and northern (Sitakunda, Rangamati) stations (Figure 3). There is a significant increase in minimum daily temperature at Cox’s Bazar, both in annual average and in the pre-monsoon season. Minimum daily temperatures also increase during the monsoon and post-monsoon seasons, but the trend is not statistically significant although the trend for some individual months (August in the monsoon, October in the postmonsoon season) within each season is significant. The increase in both maximum and minimum daily temperature results in an overall increase in mean daily temperature at Cox’s Bazar, which is significant in annual, and pre-monsoon and post-monsoon season, and positive though not significant in the monsoon season (Figure 4). Increases in minimum daily temperature are also recorded at Chittagong; although a positive trend is seen in all seasons, the trend is only significant during the monsoon season (Figure 3). Again, the increase in both maximum and minimum daily temperature results in an overall increase in mean daily temperature at the Chittagong station, in all seasons although the trend is only significant for the monsoon and post-monsoon seasons (Figure 4).
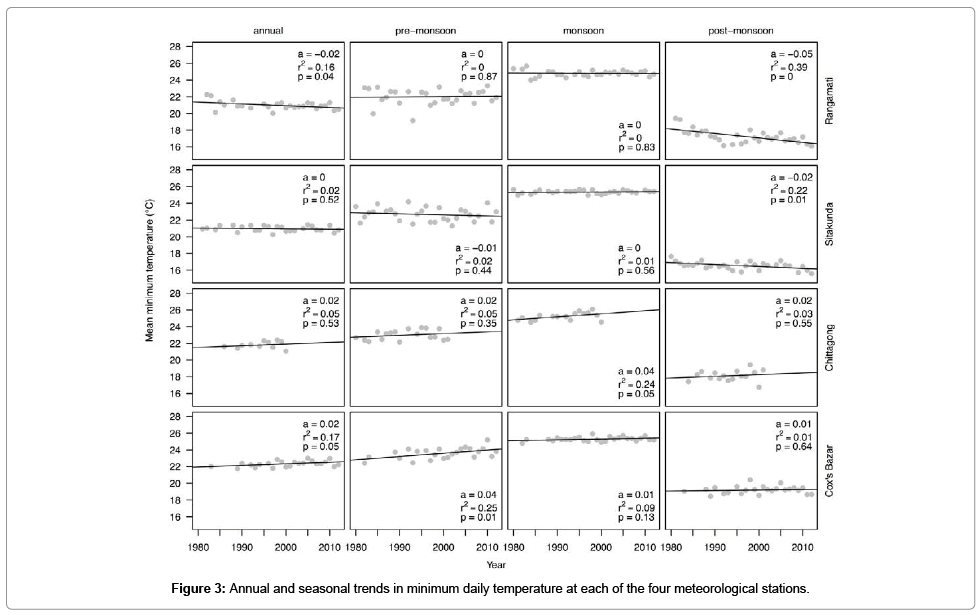
Figure 3: Annual and seasonal trends in minimum daily temperature at each of the four meteorological stations.
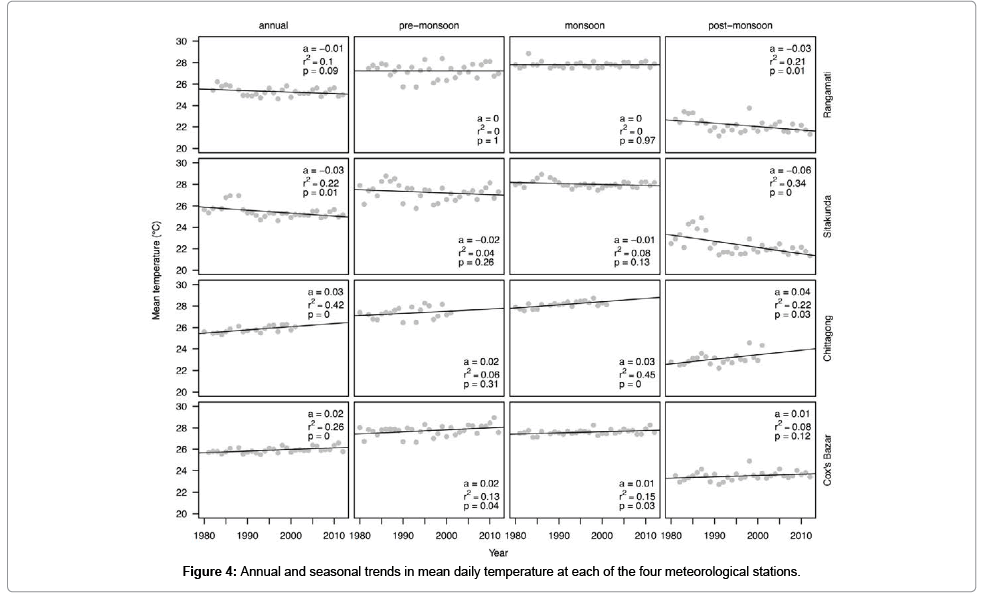
Figure 4: Annual and seasonal trends in mean daily temperature at each of the four meteorological stations.
In contrast to the two southern stations, both Rangamati and Sitakunda show no significant changes in minimum daily temperature during the pre-monsoon and monsoon seasons (Figure 3). However, they both show a significant decrease in minimum daily temperature during the post-monsoon season. This change is larger than the increase in maximum daily temperature, and as a result the mean daily temperature during the post-monsoon season is reduced by 0.3°C per decade at Rangamati and 0.6°C per decade at Sitakunda (in contrast to the increase in mean daily temperature of 0.1°C per decade at Cox’s Bazar and 0.4°C per decade at Chittagong).
There is a significant increase in diurnal temperature range, annually and in all seasons in Cox’s Bazar, Rangamati and Sitakunda (Figure 5). There is also an increase in diurnal temperature range at Chittagong, but the trend is only significant in the post-monsoon season. The increase in the diurnal temperature range in the northern sites (Sitakunda, Rangamati) reflects the fact that minimum daily temperature is decreasing while maximum daily temperature is increasing. However, the increase in the diurnal temperature range in the southern sites (Cox’s Bazar, Chittagong) reflects the fact that the increase in maximum daily temperature is larger than the increase in minimum daily temperature. Thus, the coherent response in diurnal temperature range across the region results from two different causes.
The recent trends in temperature are relatively coherent, but changes in precipitation are less coherent. There are no discernible trends in precipitation in any season at Chittagong, which may reflect the shortness of this record. However, there are changes in precipitation during the monsoon season at Sitakunda and Rangamati (Figure 6). At Sitakunda, there is a significant increase in total precipitation during the monsoon season, which is associated with a significant increase in the number of rain days (Figure 6). Maximum daily precipitation during the monsoon season also shows an increase, but this is not significant (p=0.26) and there is no discernible trend in mean precipitation on rain days. There is also a significant increase in the number of rain days during the monsoon season at Rangamati, although this is not accompanied by significant trends in other precipitation characteristics. Although total precipitation increases at Cox’s Bazar during the monsoon season, the trend is not significant. However, there is a significant increase in mean daily precipitation on rain days during the pre-monsoon season, largely driven by a significant increase (in mean and maximum precipitation on rain days and in total precipitation) during the month of May. The change in total precipitation during the monsoon season at Sitakunda is 233 mm per decade and the change in the pre-monsoon season at Cox’s Bazar is 81 mm per decade. As might be expected, the increases in precipitation at Rangamati and Cox’s Bazar are strongly correlated with increases in relative humidity (Table 4). However, the relationship between relative humidity and precipitation is also positive at the other stations, even when the change in precipitation is not significant. Overall, the emerging pattern is towards increased monsoon rainfall, although the way this is expressed and the exact timing differ between stations.
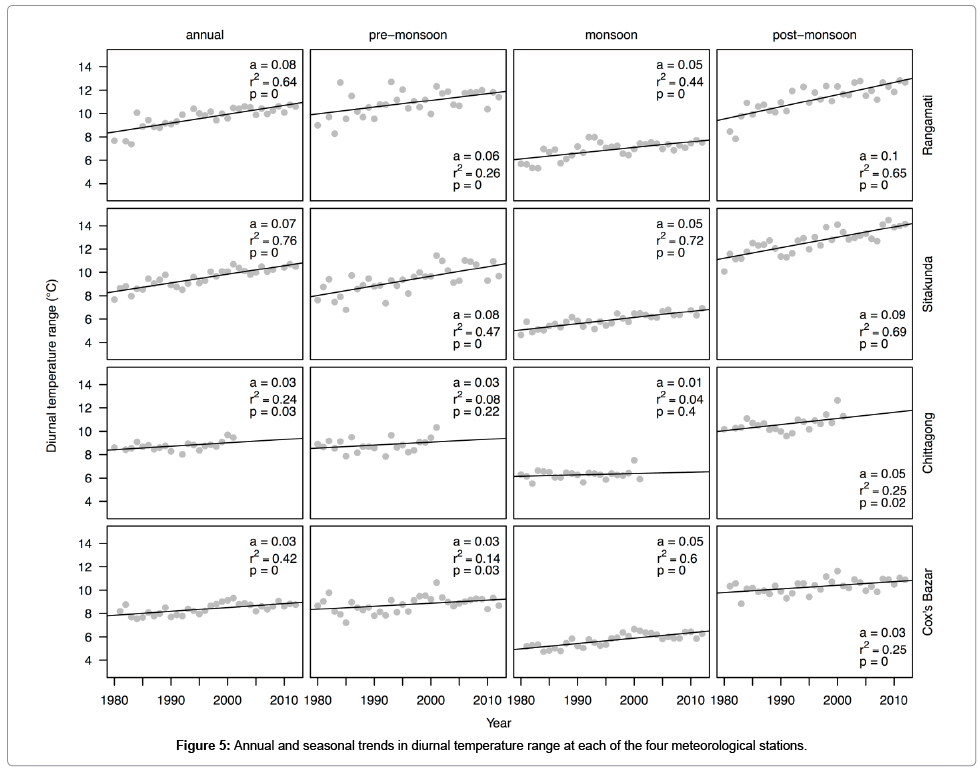
Figure 5: Annual and seasonal trends in diurnal temperature range at each of the four meteorological stations.
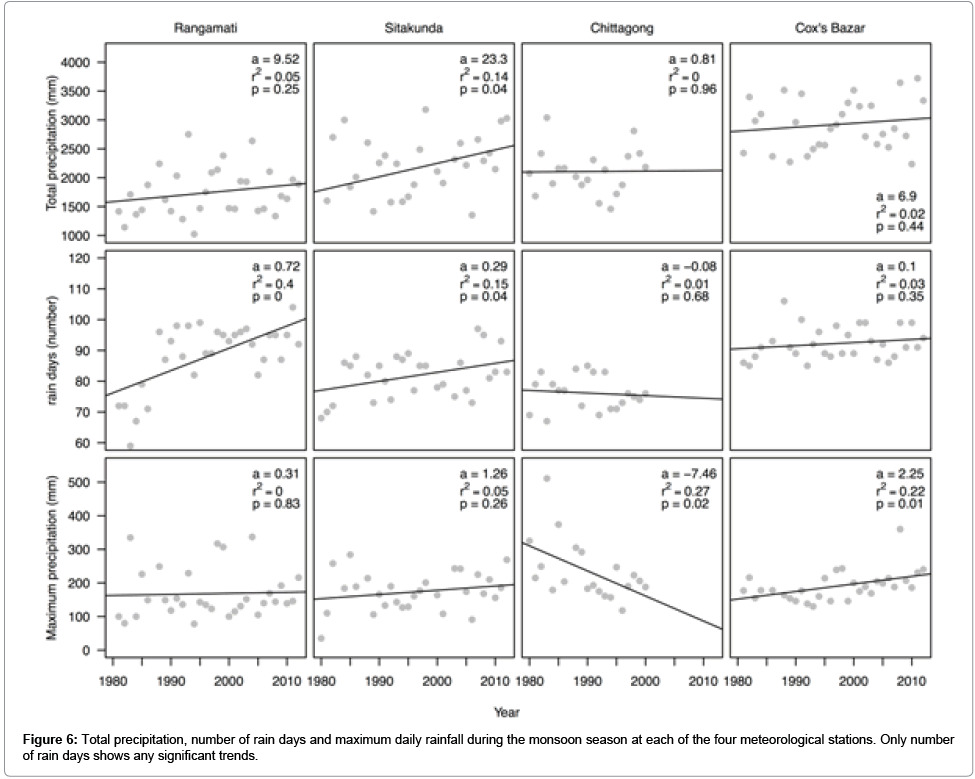
Figure 6: Total precipitation, number of rain days and maximum daily rainfall during the monsoon season at each of the four meteorological stations. Only number of rain days shows any significant trends.
| Station | Season | Variables | Diurnal temperature range (°C) | Maximum daily precipitation (mm) | Mean daily precipitation on rain days (mm) | Total precipitation (mm) | Number of rain days | Wind speed (km/hr) | Cloud cover (tenths) | Humidity (%) |
|---|---|---|---|---|---|---|---|---|---|---|
| Cox's Bazar | Pre-monsoon | Mean daily temperature (°C) | 0.1 | 0.05 | 0.06 | -0.23 | -0.45 | -0.26 | -0.34 | -0.37 |
| Maximum daily temperature (°C) | 0.57 | 0.32 | 0.34 | 0.09 | -0.21 | -0.34 | -0.62 | -0.39 | ||
| Minimum daily temperature (°C) | -0.34 | 0.37 | 0.48 | 0.14 | -0.25 | -0.24 | -0.01 | -0.01 | ||
| Monsoon | Mean daily temperature (°C) | 0.36 | 0.18 | -0.05 | -0.14 | -0.2 | -0.18 | -0.11 | -0.47 | |
| Maximum daily temperature (°C) | 0.89 | 0.13 | -0.22 | -0.22 | 0 | -0.5 | -0.46 | 0.02 | ||
| Minimum daily temperature (°C) | 0.13 | -0.02 | -0.44 | -0.42 | 0 | 0.06 | -0.16 | -0.33 | ||
| Post-monsoon | Mean daily temperature (°C) | 0.28 | -0.19 | -0.08 | -0.25 | -0.27 | -0.09 | -0.49 | -0.23 | |
| Maximum daily temperature (°C) | 0.63 | -0.09 | -0.17 | -0.4 | -0.33 | -0.65 | -0.72 | -0.22 | ||
| Minimum daily temperature (°C) | -0.13 | -0.09 | -0.06 | -0.15 | -0.12 | 0.04 | -0.18 | 0.07 | ||
| Chittagong | Pre-monsoon | Mean daily temperature (°C) | -0.2 | 0.24 | 0.03 | -0.41 | -0.62 | 0.15 | -0.46 | -0.13 |
| Maximum daily temperature (°C) | 0.44 | 0.15 | 0.16 | -0.21 | -0.42 | -0.22 | -0.71 | -0.43 | ||
| Minimum daily temperature (°C) | -0.48 | 0.32 | 0.19 | -0.19 | -0.6 | 0.23 | -0.22 | 0.28 | ||
| Monsoon | Mean daily temperature (°C) | 0.11 | -0.23 | 0.17 | 0.03 | -0.44 | -0.41 | -0.12 | -0.03 | |
| Maximum daily temperature (°C) | 0.43 | -0.22 | 0.38 | 0.15 | -0.56 | -0.39 | 0.05 | 0.11 | ||
| Minimum daily temperature (°C) | -0.46 | -0.11 | 0.35 | 0.17 | -0.47 | -0.06 | -0.08 | 0.01 | ||
| Post-monsoon | Mean daily temperature (°C) | 0.42 | -0.1 | -0.09 | -0.19 | -0.09 | 0.06 | -0.08 | -0.05 | |
| Maximum daily temperature (°C) | 0.68 | 0.15 | 0.09 | -0.15 | -0.21 | -0.06 | -0.15 | 0.09 | ||
| Minimum daily temperature (°C) | -0.26 | -0.47 | -0.18 | -0.07 | 0.12 | 0.09 | 0.15 | -0.03 | ||
| Rangamati | Pre-monsoon | Mean daily temperature (°C) | 0 | -0.16 | -0.04 | -0.48 | -0.68 | 0.25 | -0.31 | -0.65 |
| Maximum daily temperature (°C) | 0.59 | -0.51 | -0.43 | -0.59 | -0.48 | -0.26 | -0.64 | -0.56 | ||
| Minimum daily temperature (°C) | -0.53 | -0.04 | -0.18 | -0.4 | -0.46 | 0.24 | 0.06 | -0.21 | ||
| Monsoon | Mean daily temperature (°C) | -0.14 | 0.21 | 0.07 | -0.27 | -0.47 | 0.28 | -0.09 | -0.57 | |
| Maximum daily temperature (°C) | 0.71 | -0.1 | -0.35 | -0.15 | 0.43 | -0.52 | -0.44 | -0.31 | ||
| Minimum daily temperature (°C) | -0.58 | 0.27 | 0.13 | 0.04 | -0.08 | 0.54 | -0.33 | -0.09 | ||
| Post-monsoon | Mean daily temperature (°C) | -0.33 | -0.41 | -0.16 | -0.36 | -0.43 | 0.35 | 0.25 | -0.57 | |
| Maximum daily temperature (°C) | 0.76 | -0.26 | -0.29 | -0.37 | -0.22 | 0 | -0.71 | 0.13 | ||
| Minimum daily temperature (°C) | -0.77 | -0.36 | -0.16 | -0.32 | -0.37 | 0.54 | 0.42 | -0.34 | ||
| Sitakunda | Pre-monsoon | Mean daily temperature (°C) | -0.32 | -0.17 | -0.33 | -0.54 | -0.5 | 0.59 | -0.06 | -0.55 |
| Maximum daily temperature (°C) | 0.73 | -0.2 | -0.2 | -0.4 | -0.33 | -0.26 | -0.63 | 0.14 | ||
| Minimum daily temperature (°C) | -0.63 | -0.15 | -0.33 | -0.49 | -0.51 | 0.52 | 0.13 | -0.12 | ||
| Monsoon | Mean daily temperature (°C) | -0.04 | 0.12 | -0.08 | -0.1 | -0.1 | 0.46 | -0.06 | -0.69 | |
| Maximum daily temperature (°C) | 0.95 | -0.09 | -0.03 | 0 | 0.01 | -0.37 | -0.36 | 0.47 | ||
| Minimum daily temperature (°C) | -0.07 | -0.11 | -0.26 | -0.22 | 0 | -0.12 | -0.21 | 0 | ||
| Post-monsoon | Mean daily temperature (°C) | -0.27 | 0.01 | 0.06 | -0.14 | -0.39 | 0.58 | 0.16 | -0.78 | |
| Maximum daily temperature (°C) | 0.89 | -0.25 | -0.32 | -0.37 | -0.22 | -0.21 | -0.5 | 0.52 | ||
| Minimum daily temperature (°C) | -0.57 | 0.04 | -0.01 | -0.05 | -0.13 | 0.28 | 0.14 | -0.29 |
Table 4: Summary of correlations between temperature variables and related climate variables for individual seasons, where the pre-monsoon season is defined as March through May, the monsoon season as June through September, and the post-monsoon season October through February. Numbers in bold are significant at the 95% level.
There are no discernible or consistent trends in cloud cover during the monsoon season at any station, despite the apparently significant changes in either total precipitation or the number of rain days. However, there are decreases in cloud cover during the preand post-monsoon seasons. The decrease in cloud cover at Sitakunda is significant for both seasons (Table 2). There is a decrease in cloud cover in both seasons at Rangamati, but the decrease is only significant during the post-monsoon season. Cloud cover also appears to decrease during both seasons at Cox’s Bazar, although the changes are not statistically significant. The reduction in cloud cover is significantly correlated (Table 4) with an increase in maximum daily temperature (although not with minimum or mean daily temperature) at all three sites, suggesting that changes in cloud cover contribute to the strong observed increase in maximum daily temperature.
The analyses indicate a general decrease in wind speed across this region. At Sitakunda and Chittagong, the decrease in wind speed is significant in all three seasons (Table 2). Although wind speeds decrease in all three seasons at Cox’s Bazar, the trends are only significant in the pre- and post-monsoon seasons. On the other hand, there is no significant change in wind speed during these two seasons at Rangamati, but a strong decrease (by 0.3 km/hr per decade) during the monsoon season. The change in wind speed is significantly negatively correlated with changes in maximum temperatures (Table 4) suggesting that decreased wind speed is potentially contributing to the observed increases in maximum daily temperatures.
There is a significant increase in maximum daily temperature in south-eastern Bangladesh over the past three decades. This trend is seen throughout the year, although the largest changes occur outside the monsoon season. The trends in minimum daily temperature and in mean temperature are different between the northern and southern parts of the region, with a decrease in both minimum and mean daily temperature in the north (Sitakunda, Rangamati) and an increase in both in the south (Cox’s Bazar, Chittagong). The diurnal temperature range has increased at all stations, but this reflects the fact that maximum and minimum daily temperatures show opposite tendencies in the northern stations while in the southern stations the increase is due to larger increases in maximum than in minimum daily temperatures. Our results are broadly consistent with earlier analyses of temperature changes in Bangladesh [20,25]. Islam [20] found an overall increase of maximum daily temperature in south-eastern Bangladesh between 1948-2007 and also identified the contrast between northern and southern stations in the region in terms of the trend in minimum temperature. The reconstructed sign and magnitude of the annual change in these variables are comparable for Cox’s Bazar (0.26°C versus 0.2°C per decade in our study), Chittagong (0.16°C versus 0.3°C per decade in our study) and Rangamati (-0.11°C versus -0.1°C per decade in our study), despite the fact that the analyses cover different periods of time. There is, however, a discrepancy in the direction of the observed trend in mean annual temperature at Sitakunda, which is positive (0.19°C per decade) according to Islam [20] but negative (-0.3°C per decade) according to our analyses. Further diagnosis is required to determine whether this is a reflection of differences in seasonal patterns or a function of the time interval used. Shahid et al. [25] found a yearround increase in diurnal temperature range at three stations from south-eastern Bangladesh (Chittagong, Cox’s Bazar, Rangamati) over the period 1961-2008. The rates are comparable to those obtained here (0.17 versus 0.3 in our study for Chittagong, 0.28 versus 0.3 at Cox’s Bazar, 0.44 versus 0.8 in Rangamati) and confirm that there is a distinct gradient in the magnitude of the trend between northern and southern stations. More detailed comparisons with earlier studies cannot be made because neither Islam [20] nor Shahid et al. [25] diagnose the relationships between seasonal changes in different components of the temperature regime.
The difficulty in identifying statistically robust trends in precipitation is a common theme of previous analyses [21-24,26] and also in this study. However, we have shown that there is a significant increase in total precipitation and the number of rain days during the monsoon season at Sitakunda, in the number of rain days during the monsoon season at Rangamati, while evidence of an increase in mean daily precipitation on rain days in May at Cox’s Bazar suggests an earlier onset of the monsoon season there. Ahasan et al. [21] suggested that, while there was little or no change in rainfall during the monsoon season, there was a trend towards increased precipitation in the premonsoon season for Bangladesh as a whole between 1961 and 2010. Shahid [23] also found a significant increase in mean rainfall during the pre-monsoon season at Chittagong and a marginally significant increase at Cox’s Bazar, consistent with our findings. In a second paper, Shahid [22] also showed similarly significant trends for the northern stations (Rangamati, Sitakunda) during the pre-monsoon season. Analyses based on the interval 1958-2007 suggest that the number of rain days per year has increased at Cox’s Bazar [24], but unfortunately these analyses did not examine the records from Sitakunda and Rangamati – which show a statistically significant increase in the number of rain days during the monsoon season in our analyses. We are limited in our ability to compare the magnitude of the trends in precipitation characteristics because the earlier studies use different stations (or numbers of stations), examine different intervals of time, and focus on different precipitation variables. Nevertheless, all of the analyses suggest that there are changes in precipitation that could have an important influence on the hydrological regimes of south-eastern Bangladesh.
There are significant decreases in cloud cover and wind speed during the pre- and post-monsoon seasons in south-eastern Bangladesh over the past three decades. These changes are closely correlated with changes in temperature, and particularly maximum daily temperature. This suggests that the observed increases in maximum daily temperature during the pre- and post-monsoon seasons can, at least partly, be explained by reduced cloud cover and reduced wind speed – both of which will led to enhanced surface heating. There is no change in either cloud cover or wind speed during the monsoon season at any of the stations. The absence of a discernible change in cloud cover and wind speed may reflect the fact that precipitation changes during the monsoon season are small (or hard to detect).
This analysis is based on meteorological records covering the interval from 1980 onwards, chosen in order to focus on the time corresponding to the most marked global warming. It is more difficult to identify statistically significant trends from short records. Nevertheless, significant trends exist in multiple seasonal climate variables. We suspect that similar trends at different sites, or similar trends in different seasons at a given site, or coherent trends between different climate variables, are real even when they are not statistically significant. For example, it seems likely that the positive but non-significant trend in maximum daily temperature in the premonsoon season at Chittagong is a real feature of the climate, given that similarly positive but significant trends are found in this season at other stations and that similarly positive and significant trends are found in the other seasons at Chittagong itself. Similarly, it seems likely that monsoon precipitation is increasing across the whole of south-eastern Bangladesh, even though the indicators that register a significant change are different at the different stations: change in total precipitation during the monsoon season at Sitakunda, a lengthening of the monsoon season at Cox’s Bazar, and an increase in the number of rain days at Rangamati. Nevertheless, changes in all of the precipitation-related variables are coherent across the four stations even when they are not significant. Thus, the relatively short length of the records analysed in this study is not a drawback to detecting climate changes across the region.
The observed trends in temperature and precipitation are small but, if these changes continue in the future, they are likely to have significant impacts on water resources in south-eastern Bangladesh. Diagnosing whether the overall impacts on water availability, river flows and the incidence of flooding will be positive or negative requires forward modelling of the system [29,30]. Our analyses identify both the need for such modelling and provide calibration data sets that make it feasible. There is already considerable concern about water availability and water quality in south-eastern Bangladesh [31,32] and thus an assessment of how these have been affected by recent climate changes and how they will be affected in the near-term future is a matter of some urgency.
We acknowledge the Bangladesh Meteorological Department for providing the meteorological data. We thank Sayma Akhter, FONASO Joint Doctorate research Fellow for collecting the data. FR and LG were supported by a Macquarie University International Research Scholarship (iMQRES).
