Research Article - (2014) Volume 2, Issue 2
Keywords: Flood; Thunderstorm; Radar reflectivity; Instability indices; Vertical wind shear
IDT: Intensity, Duration and Type of the storm; EHI: Energy- Helicity index; CAPE: Convective Available Potential Energy; BRN: Bulk Richardson Number; GFS: General Forecast System; TOR: Tornadic Super-cell; SUP: Super-cell; ORD: Singlecell; MUL: Multi-cell; SRH: Storm-Relaive Helicity; PW: Precipitation Water of cloud; SSI: Showalter Stability index; TT: Total Total index
Phenomenon affecting water runoff and flood vary considerably at regional and local scales. One of flood-producing mechanism is the slow-moving, intense thunderstorm. Thunderstorm includes various types such as single-cell, multi-cell, super-cell and squall line that each of them has different intensity, duration and type (IDT). The objective of this study is detection IDT of flood- producing thunderstorms using some convection-related sounding-derived parameters and radar images in Northwestern of Iran. The values of some sounding-derived parameters such as CAPE, SRH, BRN… are often cited in researches, However, no known baseline exists that is adequate to support these quantifications in the different area such as ours region. In this study, we try to find type of storms with preset threshold of the parameters and then verify them with our observation from storms.
Other investigations have focused on various types of convection: a climatological sounding analysis of the environments associated with severe Oklahoma squall lines are reported in Bluestein and Jain [1] and non- severe squall lines in Bluestein [2]. Precipitating convection exhibits configurations ranging from large, long-lived unicellular structures to short lived Multi-cellular forms consisting of ordinary cells. Bluestein and Parker [3] have used soundings to investigate the modes of early storm organization near the dry line. Rasmussen et al. [4] investigated high-precipitation super-cells using a sounding climatology. Super-cells in the context of flash floods are their tendency to have strong updrafts Doswell [5]. Rasmussen and Blanchard [6] used some indices such as vertical wind shear, CAPE, Helicity, Energy-Helicity, vorticity generation and balk Richardson number to identify super-cell from other type of thunderstorms. Stalker and Knupp [7] presented a method to identify convective cells within multi-cell thunderstorms using multiple Doppler radar data. They used from the four objective criteria and their threshold values for the cape storm included a threshold updraft, a threshold cloud-layer depth, a threshold updraft area and cell origin within the planetary boundary layer. Byko et al. [8] investigated Descending Reflectivity Cores in super-cell thunderstorms observed by mobile radars and in a highresolution numerical simulation. They are observed to descend from the echo overhang and, upon reaching low levels, have been found to contribute to the formation or evolution of hook echoes, which are perhaps the most familiar radar characteristic of super-cells. Karan et al. [9] investigated the formation of multiple squall lines by radar images and WRF simulation. They said an approaching surface cold front (CF) generated an atmospheric bore that propagated along an inversion layer and excited high frequency, low-level tropospheric gravity waves, initiating a squall line 60 km east of the cold front.
Dataset
For this study, five flood-producing thunderstorms were chosen in 2012, 2013 years. Table 1 has shown all thunderstorms taken for analysis along occurrence time and location. Surface and upper air data were taken from General Forecast System (GFS). These data have a spatial resolution of 0.5°×0.5° and a temporal resolution of 6 h. Also, the soundings compared here are contained in Radiosonde Data for northwestern Iran that the radiosonde locates at 37.9°N latitude and 46.1°E longitude, and were all made at 1200 UTC formal sounding. The dataset containing some sounding-derived parameters such as K, Showalter, Total-Total, Helicity and Energy-Helicity (EHI) indices; Convective Available Potential Energy(CAPE) and Bulk Richardson Number (BRN) are used for detect type of thunderstorms.
| Thunderstorm | Formation | Destruction | Duration | location | |
|---|---|---|---|---|---|
| Date | Time | Time | lat | log | |
| 10-Sep-12 | 10:30 | 13:45 | 3:15 | 38 | 46 |
| 21-Jul-12 | 13:45 | 16 | 2:15 | 37/8 | 46/1 |
| 12-Feb-13 | 10:30 | 13:30 | 3:00 | 37/9 | 46/1 |
| 12-Oct-12 | 10:00 | 14:00 | 4:00 | 38/2 | 45/5 |
| 21-Dec-12 | 8:30 | 13:30 | 3:00 | 38 | 45/5 |
Table 1: Duration with occurrence time and location for all thunderstorms.
The radar data used in this study were reflectivity scans from C-band radar. From low to high level 360° scans at elevation angles of 0.5° and 19.5° were obtained every 15 min out to a range of 250 km. These surveillance scans were used to identify structure of cumulus clouds in their early development stage prior to precipitation. We have used radar images for identify intensity and duration time of thunderstorms.
The classes of storm were designed with the intent to identify soundings associated with Single-cells, Multi-cells, Super-cell, Tornadic Super-cells and Squall line storms. These categories of convective cells were defined as bellow:
Tornadic Super-cell (TOR): This category was designed to identify soundings associated with tornadic Super-cells.
Super-cell (SUP): For comparison to the TOR category, information from the climatological database was sought to identify Super-cells without significant tornadoes.
Single-cell (ORD): This category was designed to exclude Supercells. This was done by including soundings associated with a modest amount of cloud-to-ground lightning, but excluding soundings associated with damaging wind, large hail, or any tornado.
Multi-cell (MUL): Multicellular organisms are organisms that consist of more than one cell, in contrast to single-celled organisms. To form a multicellular organism, these cells need to identify and attach to the other cells.
Complex cells (clusters): This category has been organized into two or more single cells that merge together.
Squall line: This category associated with ensemble of single/Multi /Super-cells that accompanied with a cold front.
Parameters
Storm-Relative Helicity (SRH)
SRH is sounding-derived shear parameter Davies-Jones [10] that defined as:
 (1)
(1)
Where V is horizontal velocity, c is the storm motion vector, and h is the depth over which the integration is performed (3 km herein) and SRH unit is m2s-2. Table 2 shows SRH values for different percentile in soundings associated with nonsuper-cell thunderstorms (ORD), supercells without significant tornadoes (SUP), super-cells with significant tornadoes (TOR).
| Parameters | ORD Percentile | SUP Percentile | TOR Percentile | ||||||
|---|---|---|---|---|---|---|---|---|---|
| 10 | 25-75 | 90 | 10 | 25-75 | 90 | 10 | 25-75 | 90 | |
| BL-6 km shear | 3-5.7 | 5.7-15.7 | 15.7-22 | 8.1-12.1 | 12.1-22.1 | 22.1-25.8 | 4.7-13.6 | 13.6-21.8 | 21.8-29 |
| BRN | 0.19-1.5 | 1.5-40 | 40-140 | 0.94-2.0 | 2.0-17.3 | 17.3-34 | 1.13-4.2 | 4.2-13.7 | 13.7-20.8 |
| SRH | -19 | 17-100 | 100-168 | 25-64 | 64-208 | 208-304 | 68-100 | 100-279 | 279-411 |
| Mean shear(0-4 km) | 2.79- 3.61 | 3.61- 6.42 | 6.42- 8.09 | 4.52- 5.23 | 5.23- 7.83 | 7.83- 9.44 | 4.52- 5.06 | 5.06- 9.44 | 9.44-10.29 |
| CAPE | - | 0-1094 | 1094-1821 | 0-283 | 283-1821 | 1821-2453 | 66-519 | 519-1877 | 1877-3028 |
Table 2: Percentile of some indices for soundings associated with nonsuper-cell thunderstorms (ORD), supercells without significant tornadoes (SUP), supercells with significant tornadoes (TOR), (Rasmussen and Blanchard, 1998).
BL-6 km shear
In this section, the magnitude of the shear vector between the 0–500 m AGL mean wind and 6 km AGL wind (hereafter BL–6-km shear) is examined and shear unit is ms-1. Table 2 shows the frequency of occurrence of various magnitudes of BL–6-km shear as a function of category.
Convective Available Potential Energy
CAPE Moncrieff and Miller [11] is in common use as a forecast tool for super-cells and it unit is Jkg-1. Table 2 shows values of CAPE for ORD, TOR and SUP. Interestingly, CAPE is significantly different between ORD and SUP soundings, as well as between ORD and TOR soundings, suggesting that CAPE alone has some value as a super cell predictor, even when not paired with a measure of shear, although combined measures are much better.
Bulk Richardson number
The Bulk Richardson Number is calculated as follows:
 (2)
(2)
The bulk Richardson number (BRN) has been used as a super-cell predictor ever since it was investigated using numerical simulations Hart and Korotky [12]. Weisman and Klemp determined that environments with BRN50 favored multicellular events.
Energy–Helicity index
The Energy–Helicity index (EHI) Weisman and Klemp [13,14] is defined as:
 (3)
(3)
This index is used operationally for super-cell and tornado forecasting, with values larger than 1.0 indicating a potential for supercells, and EHI .2.0 indicating a large probability of super-cells. The likelihood of significant tornadoes does increase with increasing EHI, as shown in Table 2.
10 September 2012
on 10 September 2012, heavy rainfall resulting from thunderstorms occurred over the northwestern Iran. The maximum precipitation was 35.8 mm in the Meshkin city with three hours duration time. Water runoff and flood were caused by the thunderstorms in the region and some synoptic stations reported hail. Figure 1 shows 1000 mb geopotential height field over Iran at 1200 UTC 10 Sep. Solid line and rectangle are trough line and the studied area, respectively. Intense temperature gradient was caused by extension of an inverted trough (the height contours bulge to the north) from southeast to northwest of Iran and it coupled with high geopotential height over Black sea Figure 1a. Cold air intrusion via high geopotential height to northwestern Iran caused temperature contrast with warm air of inverted trough Figure 1b and a cold front begins to develop. In this synoptic pattern, the atmospheric stratification becomes unstable geopotentially over the area which is a pattern that favors the development of convection.
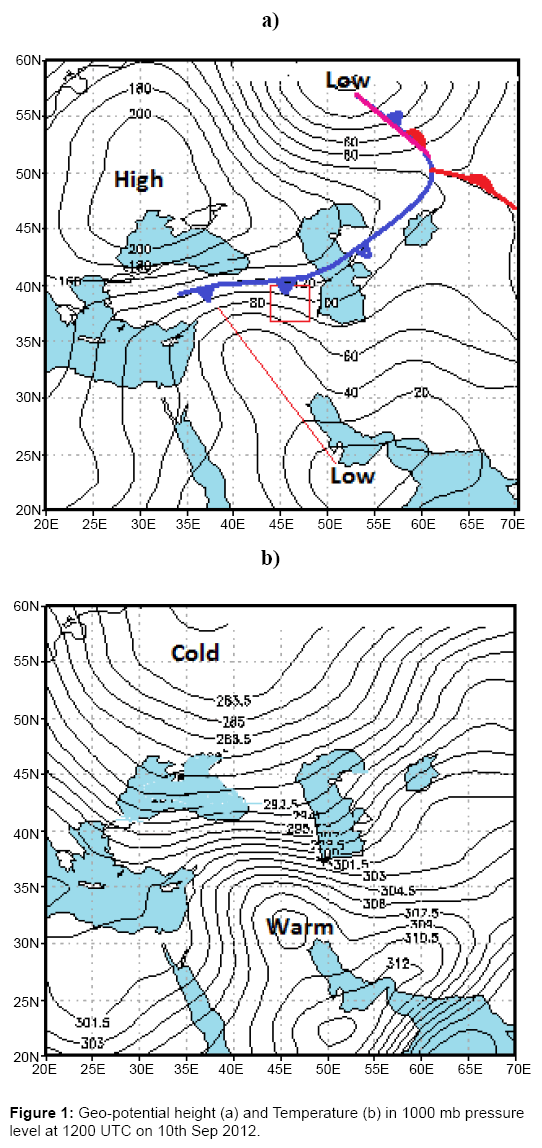
Figure 1: Geo-potential height (a) and Temperature (b) in 1000 mb pressure level at 1200 UTC on 10th Sep 2012.
Duration time and intensity of thunderstorms
A group of thunderstorms that produced flood in northwestern Iran was interpreted by radar image at 10 September 2012. Figures 2a-2f shows the situation of precipitation cells in the area from 10:30 UTC to 11:45 UTC. Observed cells have been named as A-Q indicate the conditions of Single/Multi/Super cells that merge together at later hours in the area. Characteristic of precipitation cells has been summarized in Table 2. Duration time of cells was between 0.5 to 3 hours and this time is sufficient for a convective system that produces significant rainfall in the region.
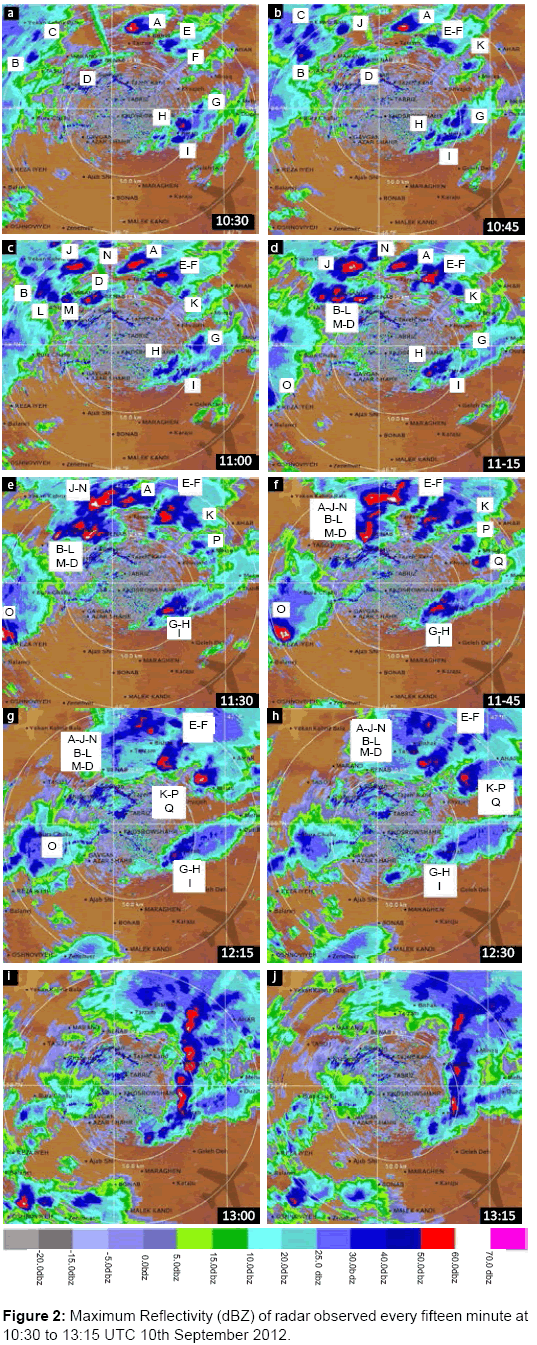
Figure 2: Maximum Reflectivity (dBZ) of radar observed every fifteen minute at 10:30 to 13:15 UTC 10th September 2012.
We have considered reflectivity factor from the radar image as intensity of cell. Reflectivity is a meteorological parameter that is determined by the number and size of the particles present in a sample volume. The examples given become -30 dBZ for fog and +76.5 dBZ for large hail on a logarithmic scale Rinehart [15]. In this study, the cells intensity are from 40 to 70 dBZ; this means that all cells have the high precipitation potential, especially, “A” and “J” cells that accompanied with hail at the first time Figure 3. The Cells have moved and merging together after 45 minutes Figures 2d-2g and made complex cells such as EF, AJNBLMD and KQP. Complex cells intensity is more than Singlecells about 70 dBZ. Finally all of complex cells moved and placed on a line at 13:00UTC. We have shown it inside an ellipse in Figure 2i.
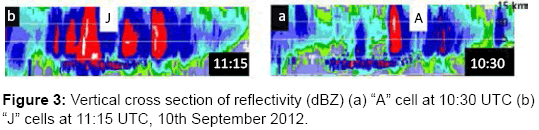
Figure 3: Vertical cross section of reflectivity (dBZ) (a) “A” cell at 10:30 UTC (b) “J” cells at 11:15 UTC, 10th September 2012.
Type of cells
At 10:30 UTC, “A” cell is apparent in reflectivity field of Tabriz radar Figures 2a and 2b. It has maximum reflectivity about 70 dBZ and accompanied by hail. The other cells (B-Q) have weaker reflectivity than “A”, between 40-50 dBZ except “J”. After 45 minutes Figures 2c-2f, all of cells have growth up and reach to “A” reflectivity and merge with each other to formation convective line at 13:00 UTC Figure 2i.
The most cells of storm were single at the identified time. Two thunderstorms “A”, “J” have different type of cell and we’ll focus on those first. The convective “A” cell was formed at 10:30 UTC and had vertical growth more than 11 km Figure 3a. Vertical growth of cell indicates the strength of updraft inside the thunderstorm. The “J” was a weak cell with reflectivity about 40 dBZ at 10:45 UTC Figure 2b. After 15 minutes, the “J” has developed and had vertical growth extending near to tropopause about 11 km and also it consists of a group of cells that moving as a single unit Figure 3b. The “J” cell after growth up has moved to, K, Showalter and Total -Total for all cells Table 3. According to Table 2 CAPE value for “A” right and merge with “A” cell. This evidence from radar images isn’t adequate for recognize the type of storms. Therefore we have computed some convection-related parameters such as CAPE, vertical wind shear, Helicity, Energy- Helicity, Balk Richardson numbercell was calculated about 1000 Jkg-1. This value is small but we see that “A” cell had a large vertical growth by this available Potential Energy more than 11 km. The vertical wind shear was calculated 12.5 ms-1 for this cell. As we have noted previously, the Bulk Richardson Number (BRN) is the ratio of the buoyancy (as measured by the CAPE) to the vertical wind shear of the environment. The updraft strength is directly related to CAPE, while the storm structure (e.g. multi-cell, super-cell, etc.) and movement are related to the vertical shear. This graphic shows BRN values related to storm type. Generally, if the BRN is less than 10, there are much more shear than buoyancy and the storms tend to be torn apart by the shear. The exception is in strongly forced, high-shear, low-CAPE environments where super cells are observed with BRN values less than 10. With BRN between 10 and 35, the balance between shear and buoyancy tends to favor super cells. With BRN greater than 50, buoyancy dominates over shear and single or multi-cell storms are more likely to be observed Weisman and Klemp [13]. “A” cell have high-shear, low-CAPE, therefore, it is identified as Super-cell by the calculated parameters values Table 3 comply with the prescribed limits as mentioned in Table 2. This result adopted with observation. For “J” cell, CAPE value was about 600 Jkg-1 and also vertical wind shear and BRN were calculated 5 ms-1 and 50, respectively. With comparing CAPE, BRN and Shear values with the limits in Table 2 and the fact that “J” is cluster of cells with different stage of life; the “J” cell was identified as a Multi-cell.
| Cell Type | Vertical Growth (km) | BRN | CAPE | Vertical Wind Shear (m/s) | SRH | EHI | TT | KI | SI | PW | Cell Name | Date |
|---|---|---|---|---|---|---|---|---|---|---|---|---|
| Super-cell | 16 | 20 | 1000 | 12.5 | 110 | 0.7 | 49 | 33.4 | -0.22 | 12.5 | A | 10-Sep-12 |
| Multi-cell | 15 | 50 | 600 | 5 | 40 | 0.15 | 49 | 33.4 | -0.22 | 19 | J | |
| Complex& Super cell | 15 | 10 | 1000 | 14 | 110 | 0.7 | 49 | 33.4 | -0.22 | 20 | ANJB-LMD | |
| Complex | 14 | 14 | 600 | 9 | 90 | 0.33 | 49 | 33.4 | -0.22 | 18 | EF | |
| Complex | 10 | 18 | 500 | 7 | 70 | 0.2 | 49 | 33.4 | -0.22 | 14 | KQP | |
| Multi-cell | 8 | 100 | 400 | 2 | 170 | 0.42 | 48.6 | 31.5 | -1.05 | 21 | 21-Jul-12 | |
| Multi-cell | 6 | 1 | 60 | 9 | 50 | 0.02 | 50.3 | 19.6 | 3.26 | 10 | 12-Feb-13 | |
| Squall line | 10 | 2.5 | 200 | 11 | 90 | 0.06 | 54.4 | 31.5 | -1.84 | 14 | 12-Oct-12 | |
| Complex | 3 | 0.04 | 50 | 26 | 180 | 0.02 | 51.8 | 25.3 | 2.9 | 12 | 21-Dec-12 |
Table 3: Shear, Instability and convection related parameters for identify the type of cells in the flood-producing storms.
The some instability indices such as KI, Showalter (SSI) and TT calculated for the storm in 10 Sep 2012. The K index is a measure of thunderstorm potential based on the vertical temperature lapse rate along with the amount and vertical extent of low-level moisture in the atmosphere. The Showalter stability index (SSI) is a popular severe weather index. The SSI uses a parcel lifted from 850 hPa to 500 hPa. At 500 hPa the parcel temperature is subtracted from the sounding temperature. More negative SSI values indicate greater instability. The Total Totals index is computed using the temperature and dew point at 850 hPa and the temperature at 500 hPa. The KI, SSI and TT stability indices were calculated about 33.4, -0.22 and 49, respectively, this values show sever instability condition in the region but we couldn’t identify the type of cells from these parameters.
We have verified EHI parameter for the cells but there wasn’t any adoption with cells type with those parameters in our region. The precipitation water of cloud (PW) was calculated for all convective cells by GFS data. By definition, the condensed water in a humid air column is referred to as the precipitation water of cloud. The increase in age and thickness of cloud lead to increase in PW. The threshold of PW for cloud is 9 mm for the area and less than this value; the probability of rainfall in the cloud is very low Sadeghi Hosseini and Rezaeyan [16]. The PW was calculated more than 9 mm for all thunderstorms in 10 Sep 2012, therefore, there was the high probability of rainfall bases on PW.
All of the cells after growing were merged with adjacent cells and four complex cells were developed which radar images clearly show merging cells Table 3, but “ C “ cell has been destroyed as a Single-cell with the 50dBZ intensity in duration time about 60 min. Moreover, Convective system named “ANJBLMD” are super /Complex cell because a supper-cell (“A”) embedded by complex -cells. The intensity of the four complex cells is up to 70dBZ which shows probability of hail in the region.
The characteristics of other studied storms that caused flood in western Iran summarized in Table 3, too. The most storms have considerable wind shear up to 26 ms-1 except the storm that has occurred in 12 July 2012 with 2 ms-1 wind shear. The KI and TT indices show instability in all storms but SI index do not show instability in two cases (12 Feb 2012 and 21 Dec 2012). According Table 3, PW for all cases is between 12-21mm, therefore, there is the high probability of rainfall for all storm.
The storm in 12 October 2012 has identified as twin Squall line at distance 100 and 150 km from cold front (not shown). It was appeared like two sharp lines in reflectivity field of radar with high vertical growth and wind shear about 10 km and 11 ms-1, respectively.
To determine the type of cells, we used all before mention indices. But some indices such as BRN and EHI are not appropriate for all thunderstorms in our region. According to this fact that BRN and EHI were computed by CAPE values and CAPE is low for our region, computed values of the two indices are not satisfactory and incompatible with the parameters limit for thunderstorm type Table 2 was listed by Rasmussen and Blanchard [6]. We have analysis CAPE values for thunderstorms of Iran. Table 4 shows frequency of CAPE values for the reported thunderstorms in five upper stations (Tehran, Kermanshah, Mashhad, Shiraz and Ahvaz) in cold and warm season during 11 years (2000-2010). The CAPE values were equal zero for more than 50% of thunderstorms, spatially in cold season and residual is less than 1000 Jkg-1. A few cases of thunderstorms have CAPE values more than 1000 Jkg-1 that belong to cities with warm climate such as Shiraz and Ahvaz in warm season.
| Frequency of CAPE Values | |||||||||||
|---|---|---|---|---|---|---|---|---|---|---|---|
| CAPE | Atmospheric | Tehran | Kermanshah | Mashhad | Shiraz | Ahvaz | |||||
| (Jkg-1) | instability | Cold | Warm | Cold | Warm | Cold | Warm | Cold | Warm | Cold | Warm |
| 0 | stability | 27% | 43% | 43% | 30% | 76% | 48.60% | 83.10% | 82.70% | 78.20% | 68% |
| 1-1000 | Moderately stable | %73 | %57 | %57 | %70 | %24 | %6.46 | %15 | %3.17 | %18 | %30 |
| 1000-2500 | instability | 0 | 0 | 0 | 0 | 0 | %8.40 | 0 | 0 | %5.20 | %2 |
| 2500-3500 | High instability | 0 | 0 | 0 | 0 | 0 | 0 | %9/1 | 0 | %3.10 | 0 |
| 3500-4000 | Extreme instability | 0 | 0 | 0 | 0 | 0 | 0 | 0 | 0 | 0 | 0 |
Table 4: Frequency of CAPE values for thunderstorms in five upper stations (Tehran, Kermanshah, Mashhad, Shiraz and Ahvaz) in cold and warm season during 2000-2010.
Hodograph analysis
The thunderstorms observed on 10 September 2012 was analyzed to understand its convective cell evolution by using high-resolution velocity and reflectivity data from Tabriz Doppler radar coverage area. As we see in radar images all cells after merging during one hours had right (eastward) motion and made convective line. To investigate the storm environment in more detail, we analyzed the Tabriz sounding data. Figure 4 shows sounding of the storm environment for the 10 Sep 2012 (a) and 0-12 km hodographs for “A” cell (b). According to skew-T diagram, the height of the level of free convection is ~3.2 km. The height of cloud top level is ~10.75 km; the CAPE is 1000 Jkg-1. Since, the tropopause level is 11 km, more cells has maximum vertical motion in the area.
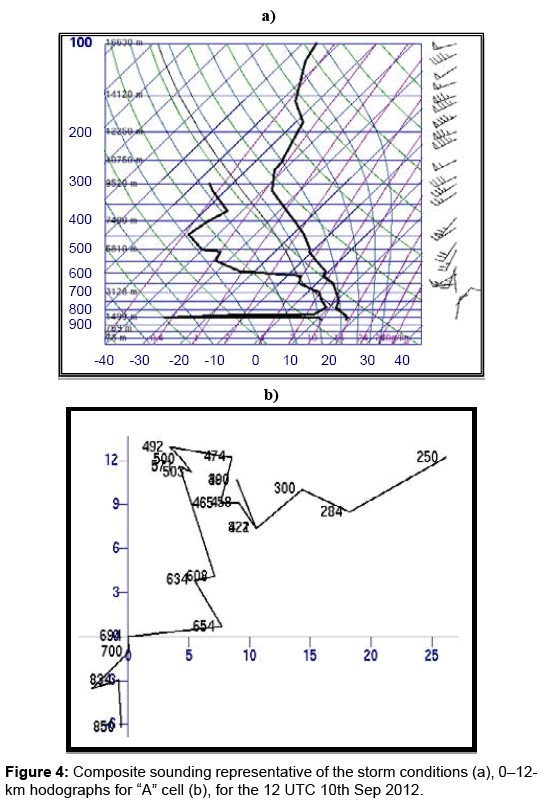
Figure 4: Composite sounding representative of the storm conditions (a), 0–12- km hodographs for “A” cell (b), for the 12 UTC 10th Sep 2012.
The hodographs for the left/right-moving super cells were partitioned based upon the degree of shear vector turning in the lowest 3 km. If the shear vectors turned clockwise by 45° or more through at least 1 km, and up to 3 km, the hodograph was classified as clockwisecurved; otherwise, if the hodograph exhibited less clockwise turning of the shear vectors than 45° in the lowest 3 km, or if the curvature was only confined to the lowest 0.5 km of the atmosphere, the hodograph was classified as straight Bunkers [17]. According to Figure 4 there was significant shear in the lowest 3 km at 12 UTC 10 Sep 2012. The shear vector turned clockwise by 80° at lowest 0.5 km and then turned counterclockwise by 100° up to 3 km. Based on above mention analysis method the hodograph was classified as clockwise-curved, and according to the fact that SRH is a positive value; the “A” cell was a right mover super-cell.
According to studies on five flood-producing storms in regions covered by northwestern Iran radar, the conclusions are as follows:
1) Based on result of this research, there isn’t any Super-cell with Tornado sign produced flood in the region and Super-cell without Tornado sign was very infrequent. The almost of thunderstorm was single-cell that merge together and make Complex cell with high reflectivity about 70 dBZ. After Single and Complex type, Multi-cell type was frequent. One of the cases was a twin Squall line which can be observed in radar images by two sharp line of thunderstorm and has produced heavy precipitation in the area.
2) The growth of vertical cell in radar images has the direct relationships with convective available potential energy (CAPE). The most CAPE values for thunderstorms are equal zero or less than 1000 Jkg-1 even for super and multi cells in the Iran region.
3) The verification of the convection-related parameters shows that some parameters such as BRN and EHI are not appropriate for identify storms type in Iran.
The authors thank Mr. Ahad Vazifeh in Radar Center of National Meteorology Organization for providing radar images from all cases.
