Research Article - (2021) Volume 12, Issue 1
Long-term hyperglycemia can impair renal microvessels and lead to diabetic nephropathy (DN). Early treatment can delay or prevent its progression. Efficacy of monoclonal antibody (mAb) therapies for human diseases can often be tested only in nonhuman primates (NHPs) but no other species due to lack of human mAb cross-reactivity. To test if DN in NHPs is similar to the human disease, this study analyzed the blood and urine biochemistry data from a large pool (n=129) of cynomolgus monkeys (Macacafascicularis). Compared with the normoglycemic monkeys, the diabetic animals were significantly aged and showed significantly higher levels of blood glucose, HbA1c, TC, TG, LDL and ALT. DN monkeys (n=47) significantly increased urine (24h) volume, glucose, albumin, total protein, bilirubin and albumin/creatinine ratio (ACR). The data showed significant correlations between age and 24h-urine glucose (p<0.05) and between age and urine creatinine (negative, p<0.05). Plasma glucose correlated well with 24h-urine volume, glucose, albumin, total protein, creatinine, and ACR (p<0.01). Treatment with the angiotensin II antagonist losartan significantly improved proteinuria in DN monkeys, which is consistent with the clinical observations in nephropathy patients. Our data indicate that DN in NHPs can be a highly valuable translational model for studying pathophysiological mechanisms and novel therapies of human nephropathy.
Nonhuman primate, Nephropathy, Proteinuria, Angiotensin II, Losartan
Abbreviations: AAALAC: Association for Assessment and Accreditation of Laboratory Animal Care; ACR: Urine Albumin/ Plasma Creatinine Ratio; ALT: Alanine Aminotransferase; AngII:Angiotensin II; ARB: Angiotensin Receptor Blocker; AST: Aspartate Aminotransferase; AUC: Area Under The Curve; CVD: Cardiovascular Disease; DM: Diabetes Mellitus; DN: Diabetic Nephropathy; ESRD: End-Stage Renal Disease; HbA1c:Hemoglobin A1c; HDL: High-Density Lipoprotein; IACUC: Institutional Animal Care and Use Committee; LDL: Low-Density Lipoprotein; NHPs: Non-Human Primates; SEM: Standard Error of the Mean; TC: Total Cholesterol; TG: Triglycerides; T2DM: Type 2 Diabetes Mellitus
Diabetes Mellitus (DM) is a complex disease which affects a large part of population world-widely. When the body produces insufficient insulin or uses the produced insulin inefficiently to metabolize glucose for a certain period of time DM can occur. Inflammation, mitochondrial dysfunction, hyperinsulinemia and lipotoxicity potentially cause insulin resistance [1-4]. Others, such as genetic background, aging, fatty liver, endoplasmic reticulum stress, hypoxia and lipodystrophy may also play important roles on insulin resistance and beta-cell function [3]. Pancreatic beta-cell dysfunction and loss are the key pathophysiological factors in development of diabetes mellitus (type 1 or type 2). Due to relatively insulin deficiency and unable to properly metabolize glucose, diabetic patients manifest hyperglycemia and polyuria. If without proper treatment, the diabetic patient can eventually develop diabetic complications of the kidneys, liver, heart and other organs, which may significantly affect the quality of patient’s life.
Nephrotic syndrome and diffused glomerulosclerosis in diabetic patients arethe major cause of end-stage renal disease (ESRD). Patients with diabetic nephropathy (DN) manifest with increased albuminuria, glomerulosclerosis, kidney interstitial fibrosis, and declined renal function. Among DN patients 20-40% may require dialysis. One study revealed that type 2 diabetes mellitus (T2DM) patients with micro-albuminuria or diabetic retinopathy were more vulnerable to progress to macro-albuminuria with a faster decline in renal function compared with those who did not have those conditions [5]. Excretion of albumin in quantities even less than 30 mg/day was also likely to be associated with marginally compromised renal function. Treatment of T2DM patients can delay the development of micro-albuminuria, e.g., the angiotensin II converting enzyme inhibitor (ACEi), trandolapril [6-7], or the angiotensin-receptor blocker (ARB), olmesartan [8-11]. Currently, treatment options for DN patients are limited to ACEi and ARB. In addition, this disease is not recognized or diagnosed early enough because of inadequate diagnostic methods, which increases the chance toward ESRD progressively. Moreover, lack of adequate animal models recapitulating human DN has impeded developing novel drugs or new biological therapeutics. Experimental data show that the pancreas pathophysiology in rodents differs from that in humans greatly, but in nonhuman primates(NHPs) is more close to in humans [12-15]. Therefore, the relevance of DN in experimental rodent models to human pathophysiology and metabolic kinetics remains unclear. However, NHP models of diabetes and metabolic disorders are the most clinically translatable animal models that resembles all the disease characteristics in patients at different stages of diabetes, including the progressive development of the known complications, such as DN. Thus, providingan ideal animal model is critical for investigating the mechanisms underlying human T2DMand DN as well as for pharmaceutical discovery, development and evaluation of novel therapeutic biologics [16]. There are some reports, including our laboratory, with detailed characterizations of diabetes and metabolic disorders in NHPs [16-19]. Cynomolgus monkeys are NHPs and genetically more close to humans than rodents. Aged cynomolgus monkeys develop hyperglycemia and increase urinary albumin excretion, but how closely the albuminuria in diabetic monkeys mirrors that in human diabetic nephropathy needs to be further investigated.
Monoclonal antibodies (mAb) represent a novel class of effective therapeutics for many human diseases. However, development of therapeutic mAbs often faces challenges in preclinical testing especially if the mAb does not cross reactive with rodent proteins. New therapies and technologies will help to improve the quality of life beyond current standard of care and perhaps even to cure the disease in future [20,21]. Various animal models have been used in preclinical research for understanding the disease and discovering new novel therapies [22-25]. NHPs can naturally develop diabetes [26-31], which represents a crucial pre-clinical model with important similarity to human endocrine physiology that facilitates translation of experimental findings to clinic. Diabetes accelerates the atherosclerotic process and its morbid consequences. Compared with humans, NHPs are more accessible and feasible for biopsy or tissue/organ collection for histopathology [32,33].
The present study was to characterize a large pool ofcynomolgus monkeys with spontaneously developed diabetes at different stages showing nephropathy phenotypes, such as urinary albumin, protein, glucose and creatinine excretion, kidneydysfunctions. These monkeys with or with DN are collected periodically from monkey farms in China and then raised in our own facility [18,19,34]. Monkeys raised in indoor cages with food ad libitum increase the chance to become dysmetabolic in an age-dependent manner [35-38]. Like humans, these monkeys can develop T2DM and its complications, such as nephropathy, orthmopathy, neuropathy, liver and cardiovascular complications [28,32,33,35,39,40]. Characterization of DN phenotypes in detail in the NHPs may provide translational insights into novel mechanisms of disease progression and new drug targets. This study also examined blood pressure and the pressor response to AngII administration, as well as the effects of ARB losartan therapy in DN monkeys.
Normal or diabetic monkeys housed in our animal center were free access to water and ad libitum a complete, nutritionally balanced normal diet (Beijing Keao Xieli Feed Co., LTD, Beijing, China). The animals were also enriched with seasonal fruits and vegetables in accordance with the Association for Assessment and Accreditation of Laboratory Animal Care(AAALAC) regulations and guidelines [18,19,34]. All the experimental protocols and procedures for sample or data collection used in this study were approved by the Institutional Animal Care and Use Committee (IACUC, Approval #: AN-1308-016-19 and AN-1702-009-6) (Crown Bioscience, Inc., Taicang, Jiangsu province, The People’s Republic of China) [18,19,34].
Animals and animal care
Experiments were performed in normoglycemic (n=55) and hyperglycemic without nephropathy (n=27) or with nephropathy (n=47) cynomolgus monkeys with either genders (male=124; female=5). These monkeys were individually housed and maintained in our animal facility with a room temperature at ∼21°C and with a 12 hr light/dark cycle with lights off from 7 PM to 7 AM. Monkeys were chair-trained for at least 2 weeks before being enrolled in a study. Body weight was periodically measured and recorded when an overnight-fasted monkey sat in a specific monkey chair consciously.
Blood sample collection and assay
Blood (2 mL) of an overnight-fasted (approximately 16 hours) monkey was collected once per week from a cephalic or saphenous vein and placed into two K2-EDTA tubes when the animal sat in a monkey chair. The animal was returned to its cage after blood collection. One sample tube was gently inverted for 10 times and then immediately placed on ice for at least 30 minutes. Plasma was separated by centrifugation at 3000 rpm for 15 minutes at 4°C. Another blood sample was kept at 4°C for glycated hemoglobin (Hb1Ac) assay. All the samples were analyzed within 3 to 4 hours after blood collection. Blood HbA1c (by ion-exchange HPLC), plasma glucose, triglycerides (TG), high density lipoproteins (HDL), low density lipoproteins (LDL), creatinine, alanine aminotransferase (ALT), aspartate aminotransferase (AST) and creatinine (The ADVIA ® 2400 Clinical Chemistry System) and insulin (by Siemens Advia Centaur XP) were analyzed at the clinical lab (The First People’s Hospital of Taicang, Taicang, Jiangsu Province, China).
Urine collection and assay
Urine sample of 24 hours was collected once per week from each monkey housed individually in a stainless steel metabolic cage. After the cage was cleaned and dried, the urine collection tray (Suzhou Houhuang Animal laboratory Equipment Technology Co. Ltd, China) was placed just under the cage. A separation net covered the urine collection tray to reduce or prevent the feces and residual food to contaminate the urine. At the end of 24-hour collection, 5 mL of well-mixed 24-hour urine were sampled into a pre-labelled leak-proof plastic microcentrifuge tube and kept at 4°C for assay. The collection date and total urine volume of the 24 hours were recorded. The samples were tested in the clinical laboratory for total protein, albumin, creatinine, glucose and bilirubin on the same day of urine collection (The First People’s Hospital of Taicang, Taicang, Jiangsu Province, China). A venous blood sample was taken on the next day after urine collection for the biochemistry measurements at the hospital assay laboratory. Renal function was evaluated by the clinically relevant surrogate markers, blood urea nitrogen (BUN) and plasma creatinine. Estimated glomerular filtration rate (eGFR) based on creatinine clearance with the equation of urine creatinine/plasma creatinine × 1.73/body weight 2/3 × 0.118, which is commonly used in clinic as a “first line” test of kidney function [12-14].
Measurement of heart rate and blood pressure
Monkeys enrolled in the experiments were trained in monkey chairs for 1 hr once per day for at least 2 weeks. The tail cuff method was used to detect the animal blood pressure under conscious condition [41]. Systolic blood pressure (SBP), diastolic pressure (DBP), and mean blood pressures (MBP) and heart rate (HR) were recorded and calculated for comparison among the monkeys with normoglycemic or hyperglycemic with or without nephropathy. MBP was calculated using a formula of doubling the DBP plus the sum to the SBP and then dividing by 3 as MBP=(SBP+2(DBP))/3. The pressor responses to intravenous administration of angiotensin II were tested in conscious monkeys in the presence or absence of AngII receptor antagonist losartan taken orally.
Dosing and treatment
AngII solution was prepared before an experiment. AngII (Sigma, St. Louis, MO, USA) was weighed and dissolved in a solution containing 0.9% saline and 0.5% bovine albumin to make it containing 20 μg/mL. The bulk stock solution was divided into small aliquots (1 to 2 mL) and stored at 4°C for one-week use. One aliquot was diluted with saline to the adequate concentration for intravenous infusion (20 seconds) and used within the day of the experiment. Dose-dependent pressor responses of AngII were tested in normoglycemic conscious monkeys (n=4). Another group of 10 monkeys with or without oral losartan 1 mg/kg/ day (n=5 per group) treatment for one week were evaluated for the effects of AngII on blood pressure. Each animal received a single intravenous infusion for 20 seconds of AngII (2 μg/kg body weight) via the saphenous or cephalic vein. Blood pressure was measured 3 times before dosing and continuously for the 1st 10 min after dosing, and then potentially at 15, 20, and 30 min if needed. Measurement was ceased if the blood pressure returned to its baseline. Then the animal was returned to its cage for recovery. Animal activity and behavior were carefully observed during the procedure and 1st hour after back to its cage. Clinical abnormalities observed were recorded and treated as needed.
During 16-week treatment the ARB losartan was given at 1 mg/ kg orally with banana once per day for 8 weeks and then increased to 3 mg/kg per day for another 8 weeks, while the vehicle group only received the same amount of banana daily. Blood sample (approximately 0.5 mL) was collected once per week after losartan treatment in the morning prior to dosing. Plasma concentrations of losartan were measured by Liquid Chromatography Mass Spectrometry (LC-MS, the DMPK lab, Crow Bioscience Inc., Taicang, Jiangsu, China).
Data collection and statistics
The data, such as age, body weight, blood biochemistry and urine assays, were collected and tabulated according to experimental grouping. The area under the curve (AUC) was calculated using the first measurement (t=0) as reference (M1 method) as described previously [18]. All the data were expressed as mean ± standard error of the mean (M±SEM). Statistical analysis was performed by using Student t-test for comparison of two means or by One-way Analysis of Variance (ANOVA) for multiple observation parameters from different time points or from groups more than two. If statistical significance of differences was detected by ANOVA, then Tukey's Multiple Comparison Test (GraphPad Software, Inc., La Jolla, CA, USA) was conducted to determine the significance. A p-value below 0.05 was considered statistically significant.
General characteristics of experimental monkeys
Several reports clearly showed that fasting plasma glucose levels were approximately 30 mg/dL lower in normal monkeys than in normal humans [26,28,32]. The enrolled monkeys in this study came from those housed in our animal facility. The diabetic monkeys here had plasma glucose levels above 85 mg/dL and those with nephropathy had additional criteria of ≥ 35 mg albumin in 24h urine [26]. Some blood metabolic characteristics of the animals are shown in Figure 1. Clearly, compared with the normoglycemic monkeys (n=55), the hyperglycemic ones with (n=47) or without (n=27) nephropathy were significantly older (Figure 1, p<0.05 or<0.01). However, their body weights were similar (p>0.05; Figure 1). Those diabetic monkeys showed significantly higher levels of plasma glucose and blood HbA1c (Figure 1, p<0.05 or 0.01). DN monkeys even had significantly higher HbA1c than those diabetic animals without nephropathy (p<0.05; Figure 1). The plasma insulin and C-peptide levels were not significantly different among normoglycemic and hyperglycemic with or without nephropathy (p>0.05; Figure 1).
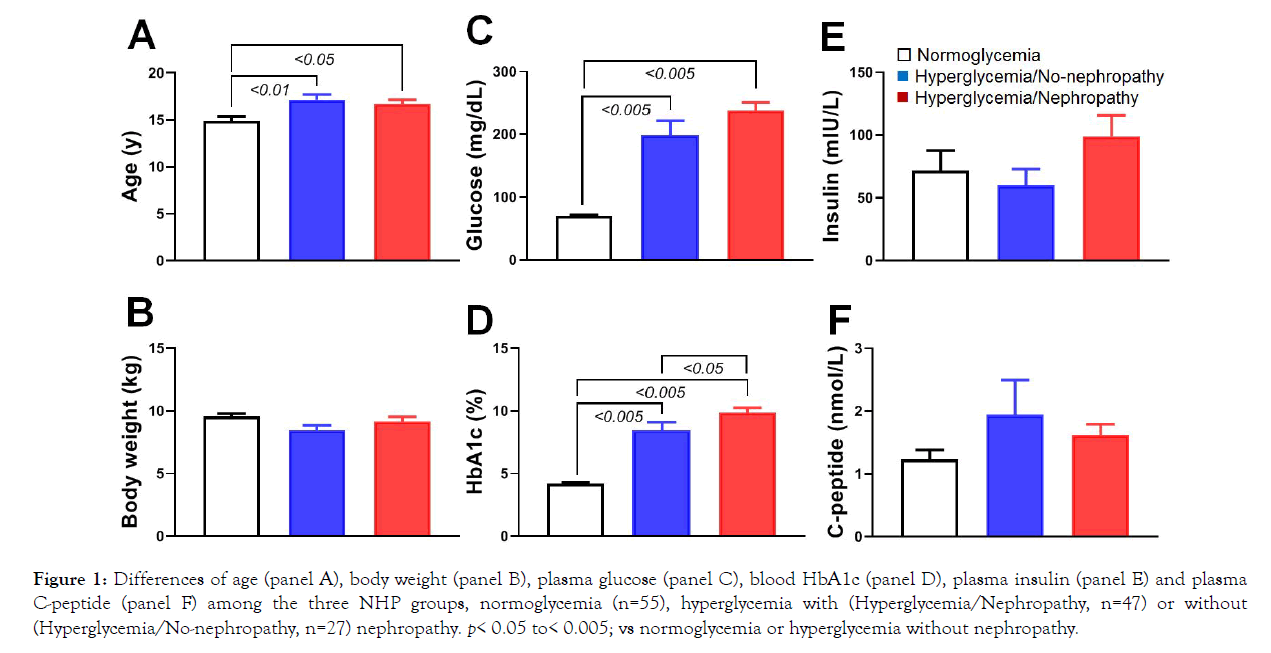
Figure 1: Differences of age (panel A), body weight (panel B), plasma glucose (panel C), blood HbA1c (panel D), plasma insulin (panel E) and plasma C-peptide (panel F) among the three NHP groups, normoglycemia (n=55), hyperglycemia with (Hyperglycemia/Nephropathy, n=47) or without (Hyperglycemia/No-nephropathy, n=27) nephropathy. p< 0.05 to< 0.005; vs normoglycemia or hyperglycemia without nephropathy.
The hyperglycemic monkeys also showed some dyslipidemia characteristics. Compared with normoglycemic animals (n=55), the hyperglycemic monkeys with (n=47 and without (n=27) nephropathy showed significantly higher levels of plasma TC (total cholesterol, except those with DN), TG (triglycerides), LDL (low-density lipoprotein), and ALT (Alanine Transaminase) (Figure 2; p<0.005). In contrast, HDL (high-density lipoprotein) levels were significantly lower in the hyperglycemic groups with or without nephropathy than in the normoglycemic group (Figure 2; p<0.005). Interestingly, plasma AST (Aspartate Aminotransferase) levels were not significantly different among the three groups (Figure 2; p>0.05). Our data demonstrate that the enrolled diabetic monkeys were much older than the normoglycemic ones. Compared with normoglycemic monkeys, diabetic ones with or without nephropathy showed significantly higher levels of glucose, HbA1c, TC, TG, LDL and AST with lower levels of HDL.
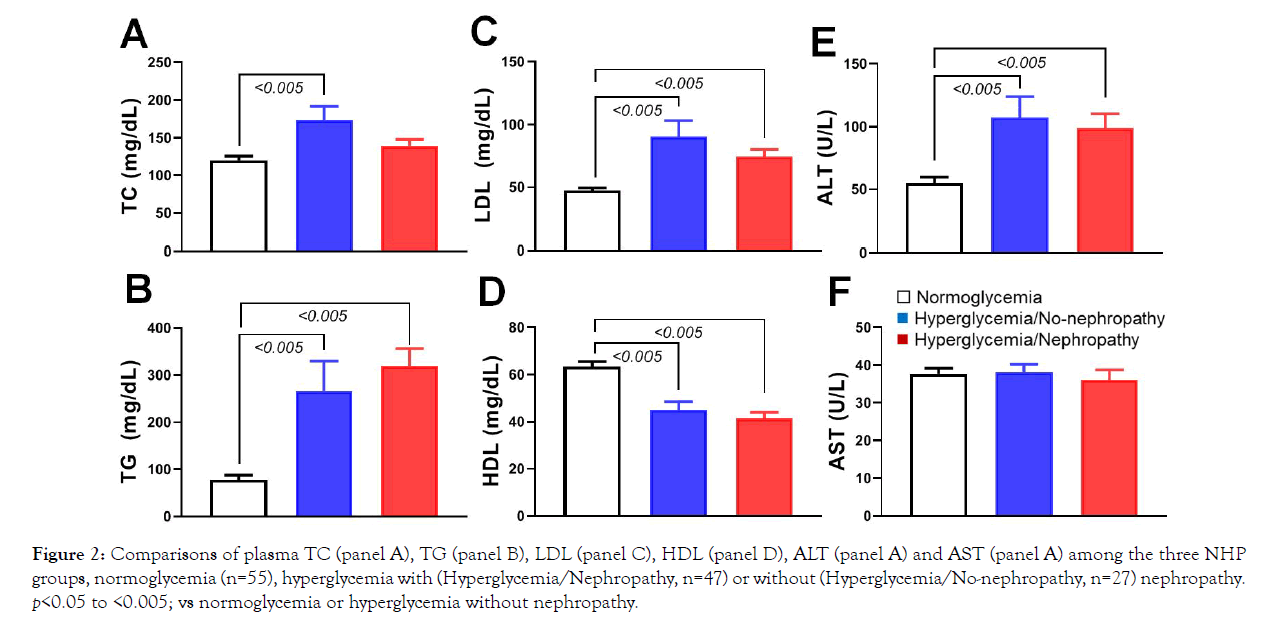
Figure 2: Comparisons of plasma TC (panel A), TG (panel B), LDL (panel C), HDL (panel D), ALT (panel A) and AST (panel A) among the three NHP groups, normoglycemia (n=55), hyperglycemia with (Hyperglycemia/Nephropathy, n=47) or without (Hyperglycemia/No-nephropathy, n=27) nephropathy. p<0.05 to <0.005; vs normoglycemia or hyperglycemia without nephropathy.
Kidney functions among the three experiment groups were evaluated via the assays of urine and blood biochemistry. Compared with the normoglycemic monkeys, the hyperglycemic animals had more urine volume (U-volume) collected during 24 hours (Figure 3), but the increase did not reach statistical significance (p>0.05; versus normoglycemic group) in hyperglycemic animals without nephropathy. However, the DN monkeys showed significant increase in 24h urine volume (p<0.005; versus both normoglycemic and hyperglycemic without nephropathy groups). Compared with the normoglycemic monkeys, the amounts of glucose in 24h urine in the hyperglycemic animals were significant more (Figure 3; p<0.005). In addition, 24h urine had significant more glucose in DN monkeys than in the diabetic monkeys without nephropathy (Figure 3; p<0.05). Urine assays also showed significant increases in 24-hr urine albumin, total proteins and bilirubin and ACR (urine albumin/plasma-creatinine ration; p<0.005, Figure 3 respectively) in DN monkeys than in those animals with normoglycemia or hyperglycemia without nephropathy. However, the amounts of cystatin C in 24h urine had no significant differences among the three groups (Figure 3; p>0.05). Urine creatinine was significant higher in the normoglycemic monkeys than in diabetic animals without nephropathy (Figure 3, p<0.01), but not than in DN monkeys. In addition, eGFR was significantly higher in DN monkeys than in normoglycemic ones (Figure 3; p<0.01), but not than in hyperglycemic animals without nephropathy (Figure 3; p>0.05). These results indicate that DN monkeys showed the significant decline in renal function.
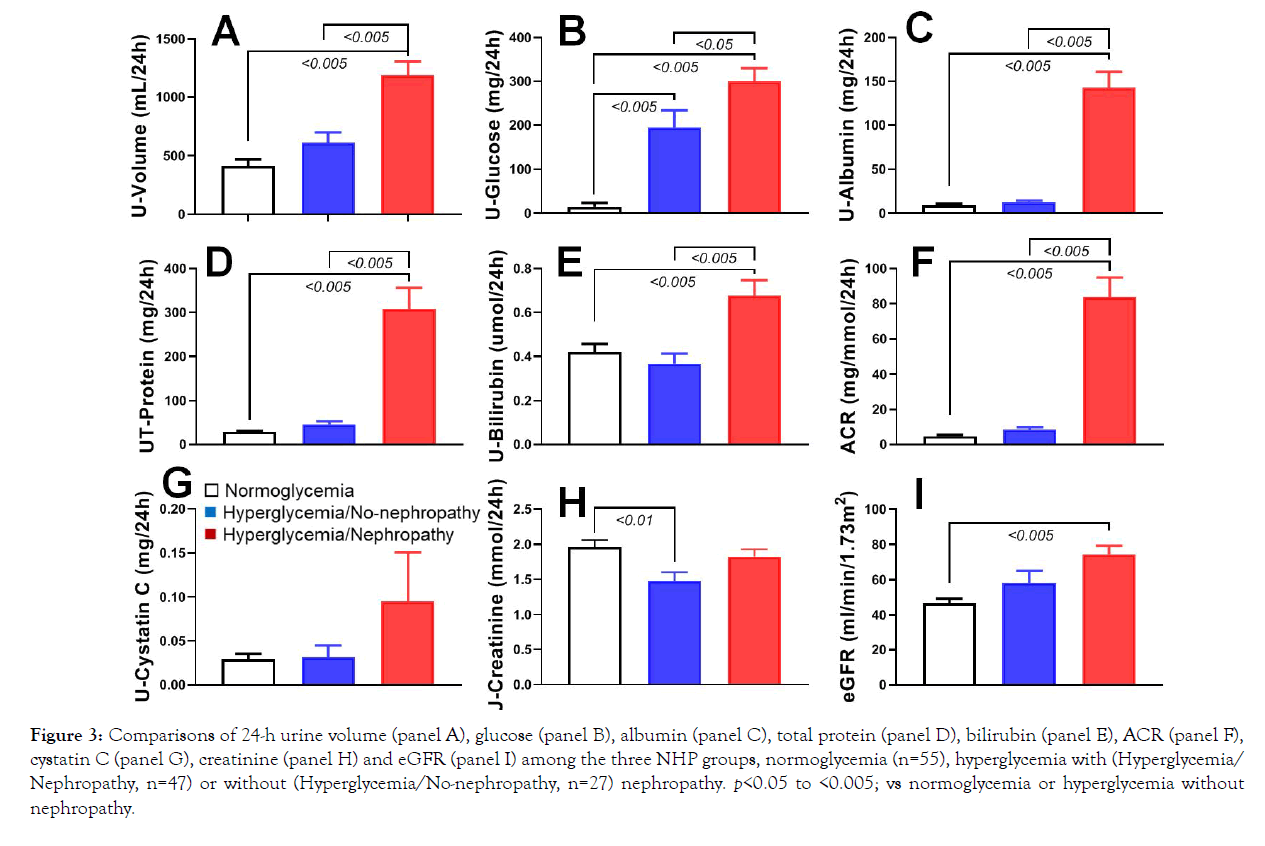
Figure 3: Comparisons of 24-h urine volume (panel A), glucose (panel B), albumin (panel C), total protein (panel D), bilirubin (panel E), ACR (panel F), cystatin C (panel G), creatinine (panel H) and eGFR (panel I) among the three NHP groups, normoglycemia (n=55), hyperglycemia with (Hyperglycemia/ Nephropathy, n=47) or without (Hyperglycemia/No-nephropathy, n=27) nephropathy. p<0.05 to <0.005; vs normoglycemia or hyperglycemia without nephropathy.
Correlations among age, plasma glucose and urine assay parameters
The ages of the experimental animals had no significant correlations with their 24h urine volume, albumin, total protein and ACR (Figure 4, respectively; p>0.05). However, the ages of the experimental animals positively correlated well with the amounts of 24h urine glucose and negatively correlated well with the amounts of creatinine in 24h urine (Figure 4, p<0.05 or 0.01).
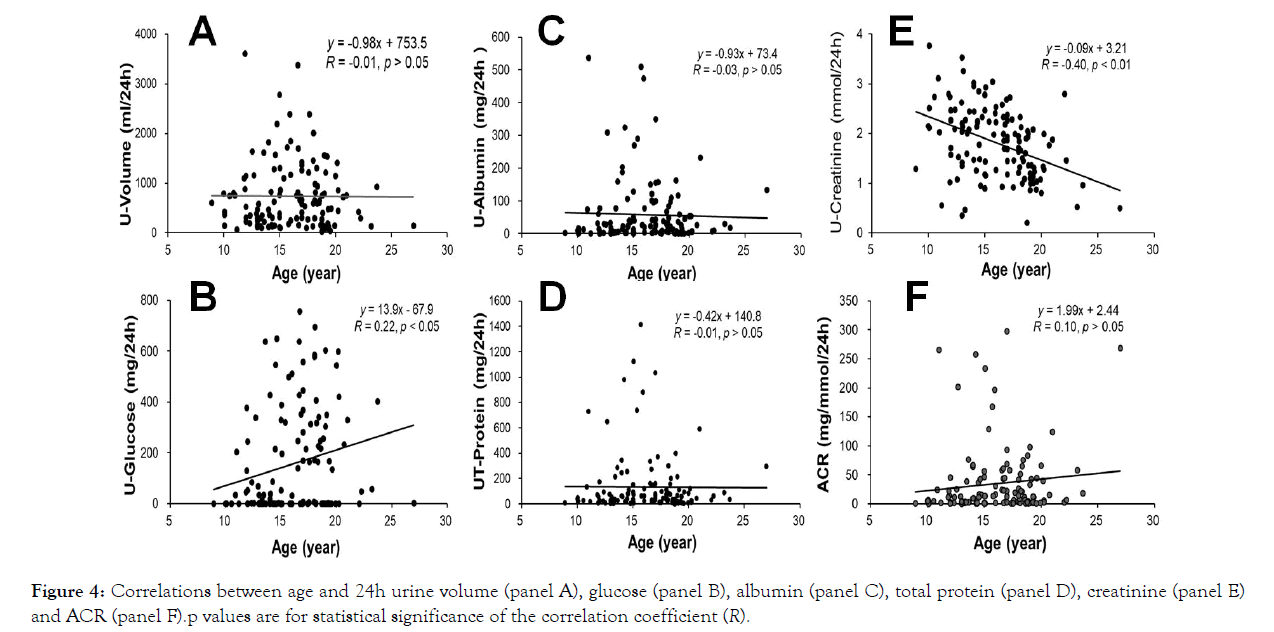
Figure 4: Correlations between age and 24h urine volume (panel A), glucose (panel B), albumin (panel C), total protein (panel D), creatinine (panel E) and ACR (panel F).p values are for statistical significance of the correlation coefficient (R).
Glucose in the blood stream is transported to all cells in the body as one of the energy sources. A healthy person keeps its blood glucose level in a safe range and avoids its two high or too low. Hyperglycemia is a major concern for those who suffer from diabetes. In order to learn how blood glucose levels affect renal functions, correlations between plasma glucose levels and urine parameters were analyzed. Interestingly, the plasma glucose levels in the experimental monkeys, not like their ages (Figure 4), showed significant correlations with 24h urine volumes (Figure 5, p<0.01) and the amounts of glucose, albumin, total protein, creatinine and ACRs (Figure 5, respectively; p<0.01). Our results clearly show that hyperglycemia impairs renal function in our experimental monkeys.
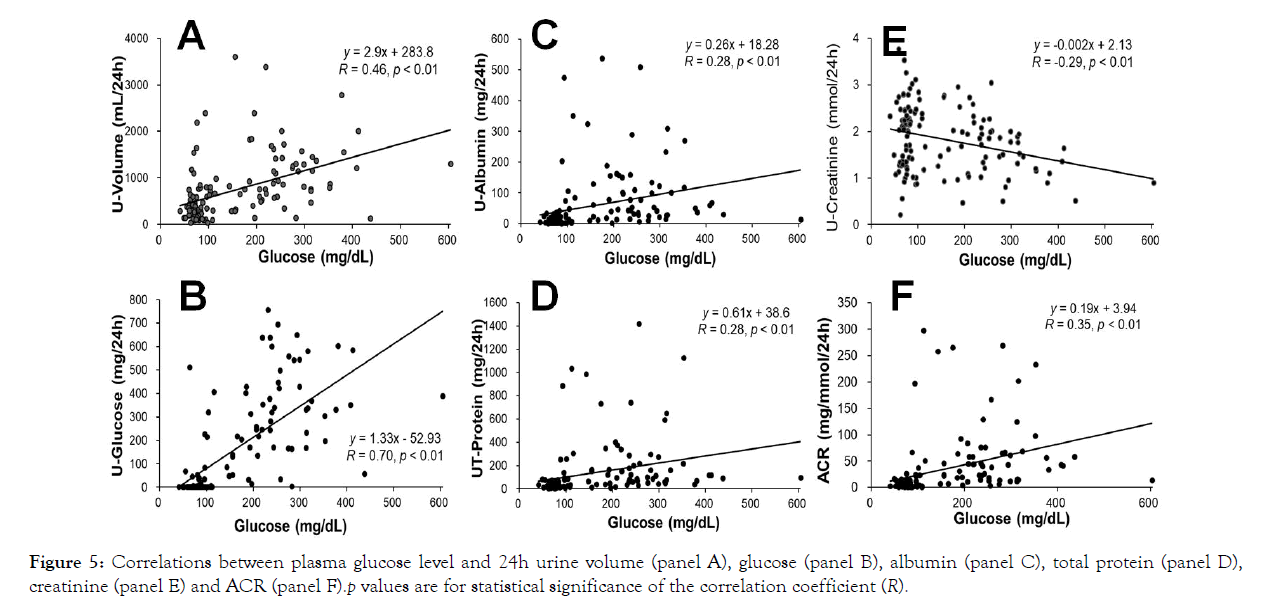
Figure 5: Correlations between plasma glucose level and 24h urine volume (panel A), glucose (panel B), albumin (panel C), total protein (panel D), creatinine (panel E) and ACR (panel F).p values are for statistical significance of the correlation coefficient (R).
Blood pressure and angiotensin pressor response
Insulin resistance results in hyperglycemia and diabetes which may impair vasculatures and increase the risk of cardiovascular diseases (CVD) [42,43]. Diabetes also obviously increases other complications, including the kidneys, eyes, liver and nervous system [44,45]. Diabetes negatively influences vascular wall morphology and function, such as common carotid intima-media thickness [45]. These complications correlate to diabetes duration, chronic level of glycemia, and other risk factors. To look at the differences of blood pressure among the monkeys with normoglycemia or hyperglycemia with or without nephropathy, blood pressure in 95 conscious monkeys was measured with the tail cuff method [41]. Figure 6 shows the systolic (SBP, Figure 6), diastolic (DBP, Figure 6) and mean (MBP, Figure 6) blood pressure, as well as heart rate (HR, Figure 6) recorded from the three animal groups. Interestingly, SBP was significantly higher in normoglycemic animals than in the hyperglycemic ones without nephropathy (Figure 6; p<0.05). In addition, HR was significantly faster in normoglycemic animals than in the hyperglycemic ones with or without nephropathy (Figure 6; p<0.05 or 0.005). However, DBP and MBP were no significant differences among the three experimental groups (Figure 6; p>0.05).
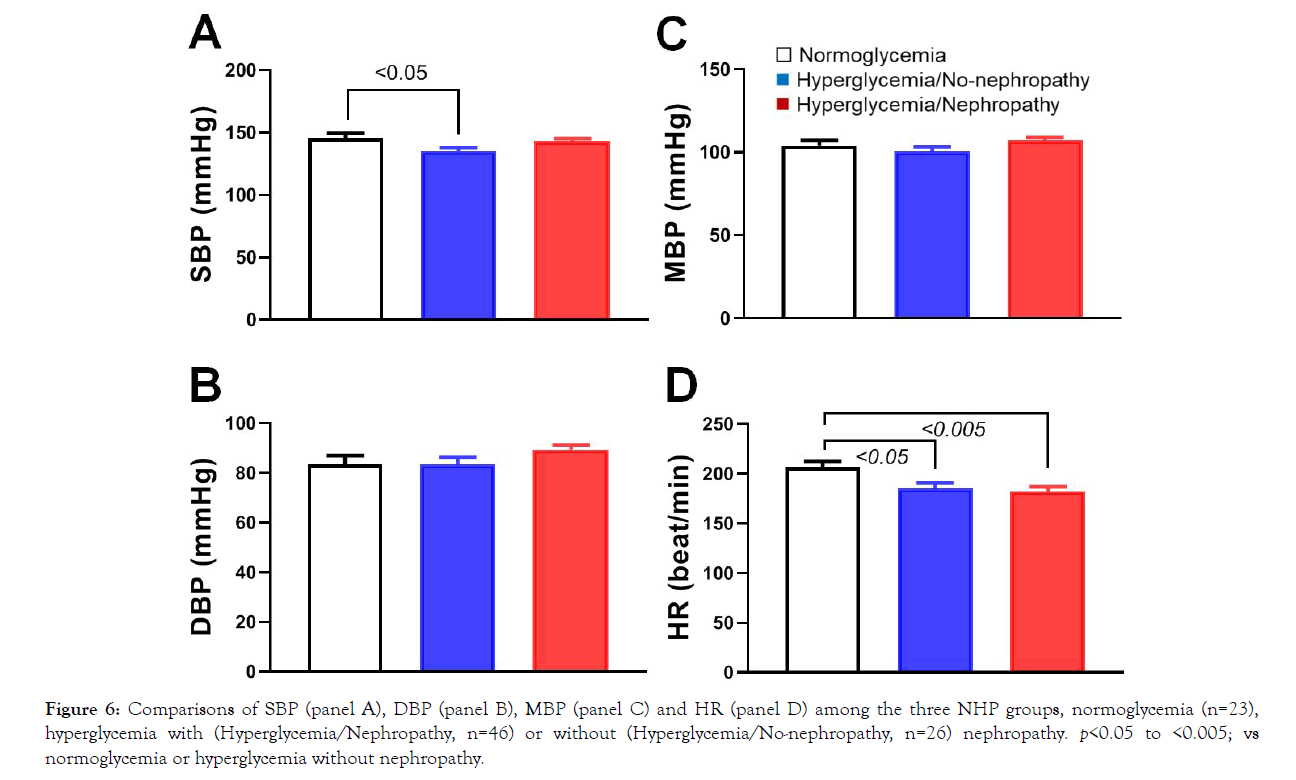
Figure 6: Comparisons of SBP (panel A), DBP (panel B), MBP (panel C) and HR (panel D) among the three NHP groups, normoglycemia (n=23), hyperglycemia with (Hyperglycemia/Nephropathy, n=46) or without (Hyperglycemia/No-nephropathy, n=26) nephropathy. p<0.05 to <0.005; vs normoglycemia or hyperglycemia without nephropathy.
As the angiotensin system involves diabetic cardiovascular complications, the cardiovascular response to AngII was tested in conscious NHPs. AngII with a diluted testing dose was intravenously infused by an infusion pump (Harvard Apparatus,Holliston, MA, USA) at a rate of 1 mL/min with a volume of 0.1 mL/kg body weight. Administration of various concentrations (0.0025 to 2 μg/ kg body weight) of AngII caused dose-dependent increases in blood pressure and MBP increased from 5 to 52 mmHg in conscious monkeys (n=4, 2 males and 2 females). The pressure response to AngII 2 μg/kg was quick and reached its peak approximately 4 minutes after intravenous infusion of AngII 2 μg/kg in 20 seconds (Figure 7). Blood pressure then decreased gradually and returned to the pre-dosing level in 10 min. The HR was initially increased and reached the peak paralleling with the blood pressure. However, not like blood pressure, HR returned to a level significantly lower than the pre-drug level at 7 min after AngII administration (Figure 7), which most likely resulted from the baroreflex of the pressor response. Then, the heart rate was back toward to the pre-drug level. The increase in MBP was significant (Figure 7; p<0.01) after AngII infusion in conscious NHPs (n=6, 4 males and 2 females). The blood pressure retuned to the pre-drug level approximately 10 minutes after AngII administration. To test if the ARB losartan blocked the AngII pressor response, another group of NHPs (n=10) was orally administered 1 mg/kg losartan daily for one week. The pressor responses of SBP to AngII 0.025 μg/kg were significantly blunted (Figure 7; p<0.05) in losartan-treated group. DBP and MBP responses were similar among the monkeys treated with vehicle or losartan (Figure 5; p>0.05). In addition, MBP and body weight were stable during losartan treatment at 1 mg/kg/day for 8 weeks and then 3 mg/kg/day for additional 8 weeks (Figure 7).
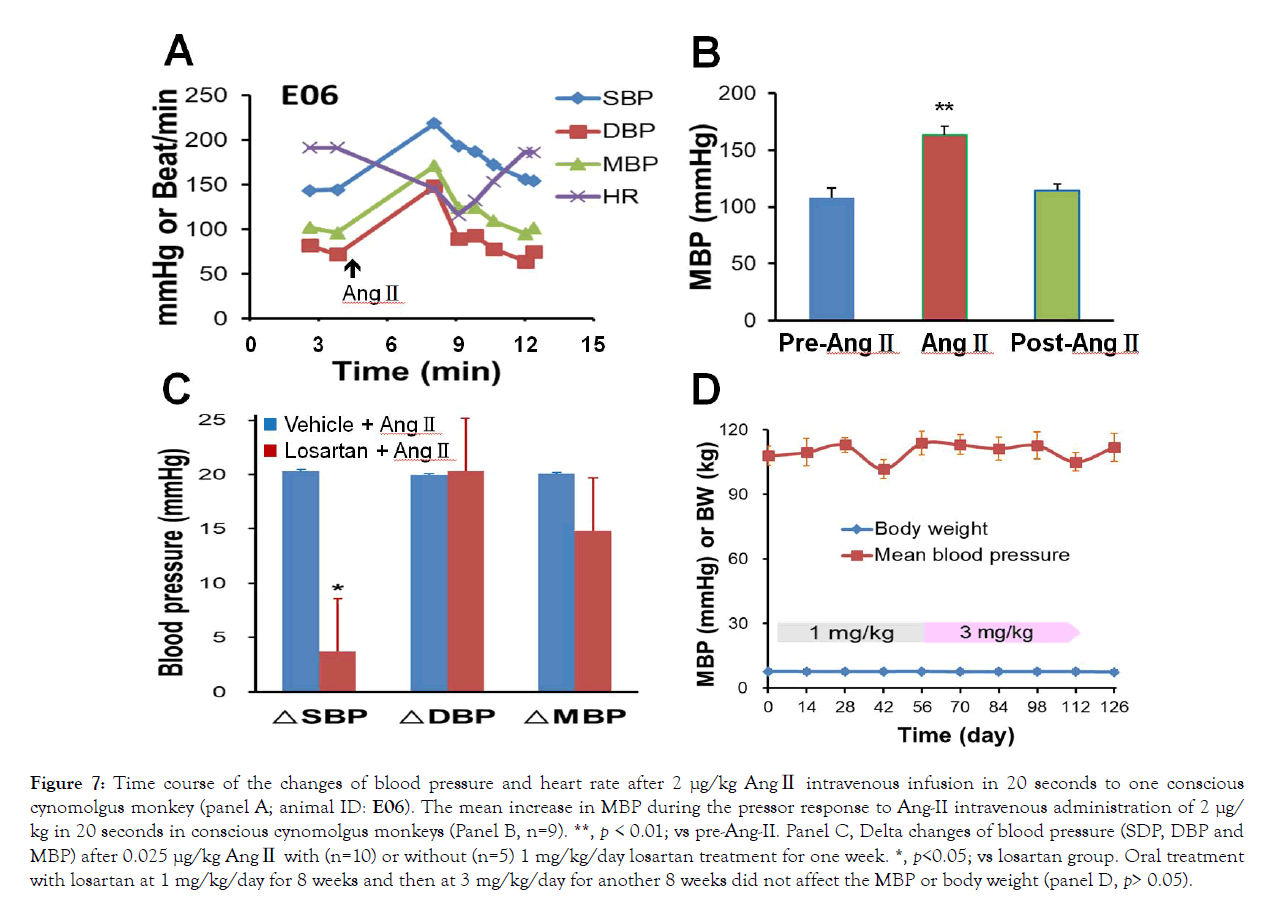
Figure 7: Time course of the changes of blood pressure and heart rate after 2 μg/kg AngII intravenous infusion in 20 seconds to one conscious cynomolgus monkey (panel A; animal ID: E06). The mean increase in MBP during the pressor response to Ang-II intravenous administration of 2 μg/ kg in 20 seconds in conscious cynomolgus monkeys (Panel B, n=9). **, p < 0.01; vs pre-Ang-II. Panel C, Delta changes of blood pressure (SDP, DBP and MBP) after 0.025 μg/kg AngII with (n=10) or without (n=5) 1 mg/kg/day losartan treatment for one week. *, p<0.05; vs losartan group. Oral treatment with losartan at 1 mg/kg/day for 8 weeks and then at 3 mg/kg/day for another 8 weeks did not affect the MBP or body weight (panel D, p> 0.05).
Effects of ARB antagonist losartan in DN monkeys
To assess if the angiotensin system played a role in nephropathy, DN monkeys (n=16, Table 1) were selected and orally administered with the ARB blocker losartan for 16 weeks (Figure 7). The baseline amounts of albumin and total protein in 24h urine were 170 ± 34 mg and 363 ± 76 mg for the monkeys (Figure 8, n=7) treated with the vehicle and were 152 ± 8 mg and 320 ± 68 mg for those (Figure 8, n=9) treated with losartan. All the differences between the corresponding groups were not statistically different (p>0.05). During losartan treatment, the amounts of 24h urine albumin (Figure 8) and total protein (Figure 8) reduced significantly (p<0.01). Urine albumin reduced to 113 ± 12 mg and total protein reduced to 228 ± 31 mg in losartan-treated monkeys. In contrast, the amounts of 24h urine albumin (Figure 8) and total protein (Figure 8) significantly increased during vehicle treatment (p<0.05). Albumin increased to 221 ± 33 mg and total protein increased to 427 ± 64 mg in 24h urine in vehicle-treated monkeys. In addition, compared with vehicle group, the losartan-treated monkeys showed significantly reduction (p<0.01) in the amounts of 24h urine albumin (Figure 8) and total protein (Figure 8) during the treatment.
| Group | n | Age (year) | Body weight (kg) | Plasma glucose (mg/dL) | Plasma insulin (µIU/mL) | HbA1c (%) |
|---|---|---|---|---|---|---|
| Vehicle | 7 | 16.5 ± 1.8 | 10.1 ± 0.9 | 209 ± 28 | 126 ± 75 | 21.0 ± 3.9 |
| Losartan | 9 | 19.0 ± 1.3 | 7.7 ± 1.2 | 217 ± 26 | 159 ± 63 | 11.8 ± 1.4* |
Note: Values are expressed as mean ± SEM. *, p< 0.05; vs. Vehicle.
Table 1: Characteristics of the cynomolgus monkeys enrolled in losartan experiment
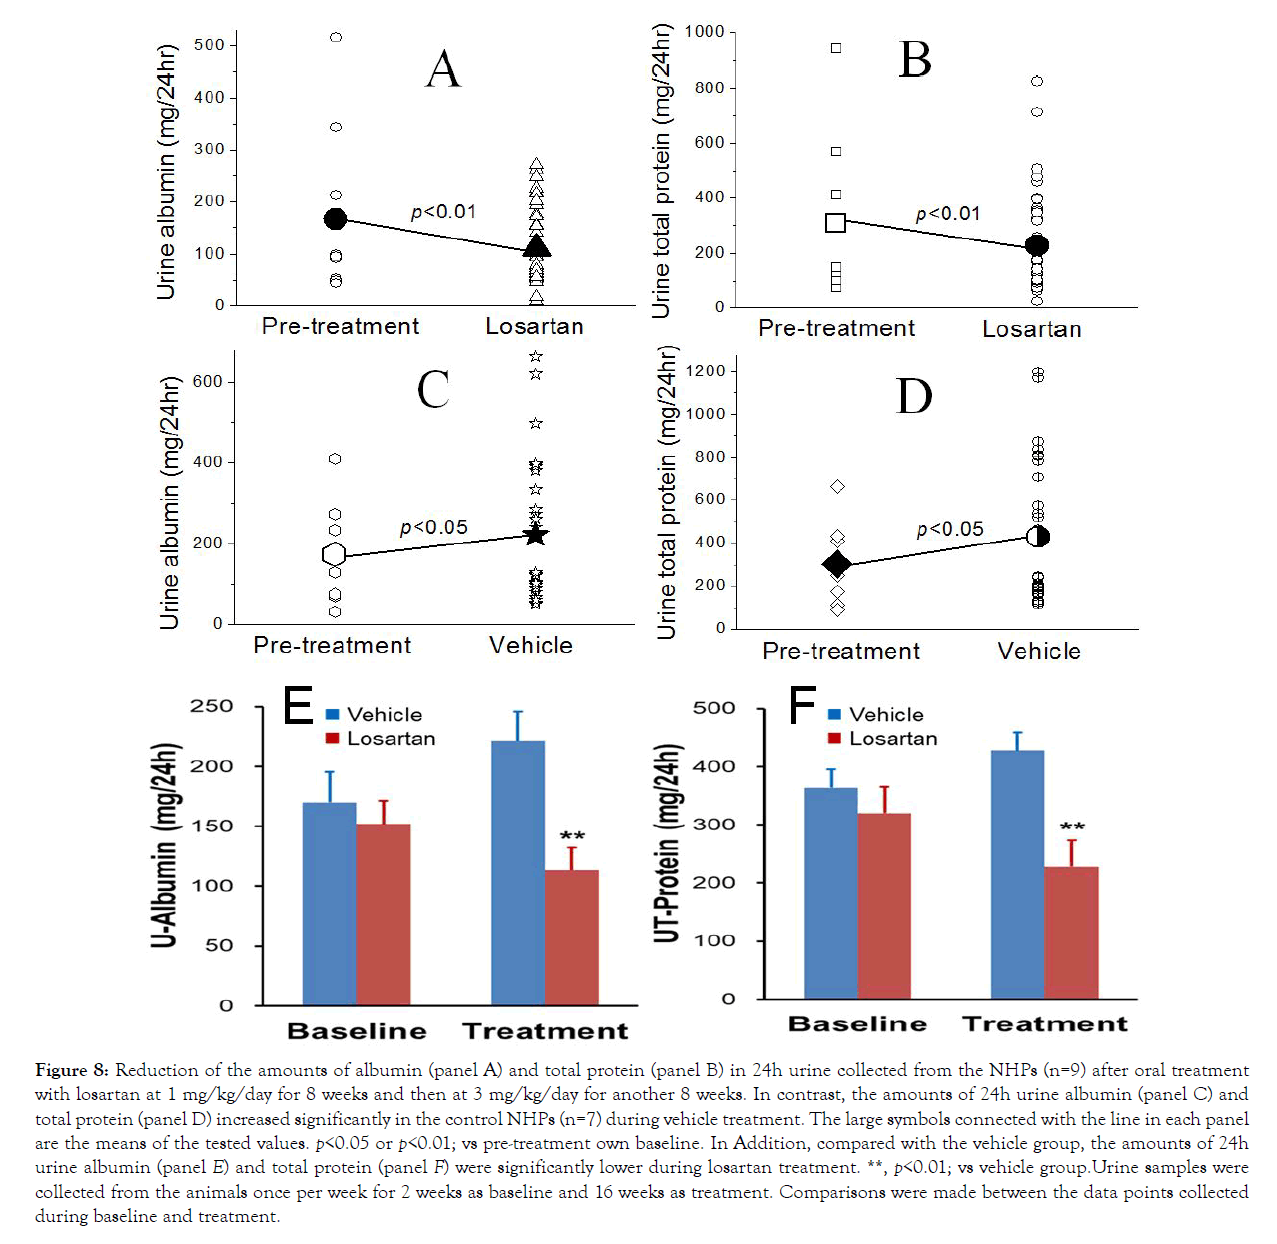
Figure 8: Reduction of the amounts of albumin (panel A) and total protein (panel B) in 24h urine collected from the NHPs (n=9) after oral treatment with losartan at 1 mg/kg/day for 8 weeks and then at 3 mg/kg/day for another 8 weeks. In contrast, the amounts of 24h urine albumin (panel C) and total protein (panel D) increased significantly in the control NHPs (n=7) during vehicle treatment. The large symbols connected with the line in each panel are the means of the tested values. p<0.05 or p<0.01; vs pre-treatment own baseline. In Addition, compared with the vehicle group, the amounts of 24h urine albumin (panel E) and total protein (panel F) were significantly lower during losartan treatment. **, p<0.01; vs vehicle group.Urine samples were collected from the animals once per week for 2 weeks as baseline and 16 weeks as treatment. Comparisons were made between the data points collected during baseline and treatment.
Our data indicate that NHPs spontaneously develop diabetes and their diabetic procession can accompany with the renal complication, nephropathy, which is similar to the clinical progression in diabetic patients, even though our diabetic monkeys enrolled in this study were not with any antidiabetic treatment. Our data show that diabetic animals were significantly older than those normoglycemic ones (Figure 1) even with similar body weights (Figure 1). Obviously, compared with the monkeys with normoglycemia or hyperglycemia without nephropathy, the group of DN monkeys showed the highest levels of blood glucose and HbA1c (Figure 1), which suggests DN monkeys were in a more advanced stage of diabetes accompanied with impaired renal function (Figure 3). In addition, compared with the normoglycemic animals, the diabetic monkeys had obvious dyslipidemia (Figure 2). As NHPs show high similarities to human genomics, physiology and disease process [46-49], they can be highly valuable in preclinical research. Evidently, the results derived from NHP studies have paralleled the results of later studies performed in humans [50,51], which reinforces the utility of NHPs as excellent preclinical animal models for investigating the physiology of human metabolism and pathophysiology of metabolic dysfunction, as well as diabetic complications, such as nephropathy. Significant advantages of NHP models for drug and new therapy development include their close genetic identity and physiological similarity to humans, especially in studies involving human recombinant biologics targeting human receptors or proteins. In addition, evaluating the effects of long-term diet or pharmacological interventions in NHPs can be nearly predictable and well controlled, whereas compliance with dietary and drug treatment regimens is generally quite poor in free-living human subjects. Therefore, more monkeys are enrolled in biomedical research with a record high in recent years [52]. Compared with extremely strict limitations in humans, biopsies of a variety of tissues including adipose, muscle, liver, kidney and other organs are more feasible in NHPs, particularly with minimally invasive approaches (e.g., echography-guided or laparoscopic biopsy). Tissues samples, such as central neuronal tissues from critical areas of the brain or from other life-organs, cannot be easily obtained from alive patients, but can be collected at the time of necropsy in NHP studies if designated to have a terminal endpoint.
Many diabetic patients develop high blood pressure (hypertension, defined as a blood pressure ≥140/90 mmHg) which is an extremely common comorbid condition of diabetes [53]. Having diabetes leads to hypertension and other heart and circulation problems more likely, because diabetes damages arteries and makes them targets for hardening (atherosclerosis) [45]. Our data did not show high blood pressure in the diabetic monkeys with or without nephropathy (Figure 4), which might suggest the diabetic NHPs were still in their early stage of diabetes, even with albuminuria. It is interesting that compared with the diabetic NHPs, the systolic blood pressure (SBP) and heart rate are significantly higher in the normoglycemic monkeys (Figure 6). One potential explanation for the unexpected differences is that the normal monkeys were relatively younger compared with the diabetic ones (Figure 1). The younger animals were more active and potentially more stressed during tail-cuff measurements under the conscious condition [54-56].
Diabetic nephropathy is one of the diabetic complications due to uncontrolled high level of blood sugar that leads to progressive glomerulosclerosis because of angiopathy of capillaries in the glomeruli [42,43]. The disease manifests as a nephrotic syndrome which may cause death in three years after the initial lesions. Currently, DN is the leading cause of chronic kidney disease in many developed countries. The detectable change at its initial stage is kidney leakage of albumin, called microalbuminuria. In this study, the renal function parameters of 24h urine volume, glucose, albumin, total protein, bilirubin, ACR (urine albumin to plasma creatinine ratio) and eGFR changed significantly (p<0.05 or 0.01) in the DN group (Figure 3).
It is interesting that the ages of the experimental monkeys did not correlated well (p>0.05) with the values of 24h urine volume, albumin, total protein and ACR (Figure 4), but correlated significantly with the amounts of 24h urine glucose (p<0.05) and creatinine (p<0.01, negative correlation). However, the levels of plasma glucose of the experimental animals positively correlated well (Figure 5; p<0.01) with the values of 24h urine volume, glucose, albumin, total protein and ACR and negatively with urine creatinine (p<0.01; Figure 5). These results indicate that renal function and albuminuria do not directly correlate to animal age, but seem most likely correlate to the degree of hyperglycemia and stage of diabetes.
Microalbuminuria can become more severe when the disease progresses. Evidence suggests that early treatment delays or prevents the onset of diabetic nephropathy [57]. Angiotensin converting enzyme (ACE) inhibitors and angiotensin II receptor antagonists (ARBs) are often used as medications to treat high blood pressure and to prevent or slow kidney disease in diabetes patients. Our data show a dose-dependent increase in blood pressure after various doses of angiotensin administration, whichclearly indicate that the angiotensin system can regulate blood pressure in NHPs and may play an important role in DN etiology. Indeed, the current data demonstrate that losartan could inhibit AngII pressor response (Figure 7) and its treatment significantly reduced albuminuria and proteinuria in the DN monkeys (Figure 8). These results are consistent with our finding in another study that oral treatment with the ARB blocker, irbesartan (3 mg/kg/day achieved a plasma concentration of irbesatan at 70 + 17 ng/mL at 24 hours) reduced urinary albumin and total protein excretion as well as ACR significantly in DN monkeys [58]. Our data demonstrate that improvement of proteinuria after ARB antagonist treatment in DN monkeys is consistent with the clinical observations in nephropathy patients. Thus, the monkey diabetic nephropathy model can be highly valuable for translational study of its pathophysiological mechanism(s) and for testing novel therapies of nephropathy.
In summary, our data demonstrate that naturally developed diabetes occurred more often in older NHPs. Diabetic progression in NHPs can lead to nephropathy, one of the diabetic complications. Treatment with AngII receptor antagonist losartan or irbesartan significantly reduced proteinuria in DN monkeys. Our data are consistent with the clinical observations in nephropathy patients. Thus, DN in NHPs can be a highly translational model for preclinical studies of new therapeutic drugs, especially biologics.
Research involving human participants and/or animals
Nonhuman primates, cynomolgus monkeys, were enrolled in the experiments. The IACUC of Crown Bioscience Inc., which includes member from outside company, approved the study protocols, AN-1308-016-19 and AN-1507-004.
The authors are employee of Crown Bioscience Inc. The authors declare no conflict of interest in this study.
The authors have read and approved the manuscript for submission. Their consents are available if requested.
All the materials and relevant raw data supporting our findings can be found in Tables and Figures in the manuscript and are freely available to readers or scientists wishing to use them for non-commercial purposes.
The financial support of this study was from the internal research fund, Crown Bioscience, Inc.
J Gao and X Wang conducted the experiments and data collection. J Gao and Y-F Xiao did data analysis and figure preparation. J Gao, X Wang, W Song, Y (Jim) Wang, Y-F Xiao participated study design and manuscript preparation.
We are very grateful to our department other employees who participated the experiments and data collections. We are also very grateful to our animal center employees for their professional care of the animals and excellent technical assistances during the study.
Citation: Gao J, Wang X, Song W, Wang YJ, Xiao YF (2021) Dysglycemia and Dyslipidemia Models in Nonhuman Primates: Part V. Diabetic Nephropathy and Effects of Angiotensin Ⅱ Receptor Antagonist Losartan. J Diabetes Metab. 12: 861.
Received: 02-Nov-2020 Published: 15-Jan-2021, DOI: 10.35248/2155-6156.21.12.861
Copyright: © 2021 Gao J, et al. This is an open-access article distributed under the terms of the Creative Commons Attribution License, which permits unrestricted use, distribution, and reproduction in any medium, provided the original author and source are credited.