Research Article - (2018) Volume 6, Issue 3
Methane is one of greenhouse gas with a high risk to environment. Agriculture are highest contributors of methane, including a livestock. This research has conducted in Boyolali, a small-scale city in Central Java with the agriculture sector is roles as a basic of local economy. The objective of research is to estimate emission loads of CH4 from agricultural sector in Boyolali. The estimation was conducted with calculation method refer to The IPCC guidelines which applying a top down approaches to collect the data. The data analysis conducted a PSR (Pressure, Stated and Response) approaches. The result shows a potential of 13.495,19 ton CH4 annually produced by agricultural sector in Boyolali. Major of it was comes from the livestock activity (88%), especially an enteric fermentation of ruminants (a breed and a dairy cattle). An emission of livestock followed by a land processing for paddy field (1078,08 ton/year) and biomass burning (560,67 ton/year).
Keywords: Greenhouse gas; Methane; Agriculture; Boyolali
The Green House Gases (GHG) is a trigger of global warming which threatening the world ecosystem. The GHG contributors categorized in a 4 main groups: an energy consumption; an Industrial Process and Product Use (IPPU); an Agricultural, Forestry and Land use (AFOLU); and a waste management. Energy consumption was identified as main contributor of GHG followed by an AFOLU category including animal husbandry. Each groups of contributor had a specific emission on type of gases, quantities and intensities. The carbon dioxides (CO2) considered as most dangerous type of gas in emission which have a highest risk to environmental.
The world usually states CO2 as primary problems on GHG. However, the data from UNFCC obtaining a non-CO2 was contributors of 28% GHG in the atmosphere. Based on this condition, the non-CO2 parameters are proper to get a similar attention, including CH4. A research by Bo, et al results methane as the highest emission from the non-CO2 gases in China. Bo, et al describes methane as primary entropy of anthropogenic activities especially produced by agricultural activities, urbanization and industrialization [1].
Methane has a residence time in the atmosphere of the orders of 8 years, lies in an intermediate situation, is a GHG but also interacts with the atmospheric oxidant cycle and air pollution in general. Methane was a precursor of tropospheric ozone with a medium-scale impacts on climate change [2].
The GHG research in South and South East Asia (SSEA) at 40 years period indicated an increase of the agriculture products 180%. This region produces 25% of the world agriculture commodity and responsible to 34% of GHG emission on the world agriculture sector. In crops, SSEA produced 27%, similar with 47% of GHG emission on the crops production. The livestock products on SSEA were also increased until 339% at the last 40 years. Today, this region producing 20% global needs on livestock. That value is equivalent with 14% GHG contribution of world livestock [3].
Indonesia was third largest GHG contributors in the world. On the other sides, Indonesia is a country with a strongly will to reduce GHG with a reduction target 26% just before 2030 [4]. The main GHG contributors are forestry (2563 MtCO2), energy consumption (275MtCO2) and agriculture (141 MtCO2).
Emission Inventory (EI) is one of estimating method utilizing a calculation approach. The EI will show up an official estimation of emission which discharged to atmosphere on the particular sources and period [5]. The EI is used as a basic data of the air quality modeling in accordance to emission potency on different activities, a spatial distribution and an identification of a potential reduction plan [6].
The Boyolali Regency was dominated by agriculture sectors as an economic driving force. The production activities in agricultural will increase significant following a growth of population and also their needs. High rate of land conversion in the city around will boost a dependency and demand in the agricultural products of Boyolali. The condition indicating a significantly increase on an agricultural emission at the future. This condition has a consequence on emission rate, especially the methane gas as a specific emission on agriculture. Meanwhile, a progress of technology and science on the agricultural industry of Boyolali are inadequate to reduce emission. The methane inventory in Boyolali has vital roles as mitigation of an agriculture emission based on potency from each activity at specific period. The results will give a description on a potency of an actual emission load and could be used as basis of the air quality management.
Research location and period
This research was conducted in The Boyolali Regency, Central Java. The data was applying a secondary data with baseline year 2015.
Research material
The main materials was a secondary data related with an agriculture sectors which contributes a methane emission. The research equipment includes: questionnaire sheets and a laptop completed with Microsoft Excel programmer.
Data collection
An identification of agricultural activities which have a potential emission was conducted with a direct observation. The activity data collected with a top down approach. This approaches utilizes an availability of secondary data from local government, private institution and academic research. This secondary data covers: sum and type of livestock, paddy field processing (annual cultivation season, area of paddy fields, cultivate period and rate of an organic material application), type of paddy fields and a assumption of biomass burning.
Limitation
The research limitation was a research area, research period, objects of inventory, parameter of emission and method of data collection. Research area was restricted to the authoritative zone of Boyolali which a period is constrained on the standard year of 2015, the object of inventory is an agriculture sector (livestock, land processing and biomass burning), parameter of emission was methane (CH4) and data collection is conducting a top down approach.
Data analysis
An emission was calculated with universal formula. The formula is arranged based on a linear relationship between source of activity and emission, which could be generated below.
Et =A×EFi
Et is load of emission from specific activities (ton/year), A is an indicator of activities (depends on the activities which have a potential emission) and Eft is a specific emission factor for GHG [7]. This research was adopting an emission factors from IPCC Guidelines [8].
Livestock emission
Emission of animal husbandry is depends to the sum of livestock on annual period. Livestock is classified
In two main groups, a poultry and non-poultry Methane production will be classified into two categories: an enteric fermentation and a waste processing. An emission of enteric fermentation was only produced by the ruminants while the whole of livestock is producing an emission of waste processing. The emission of waste processing from the poultry group will be calculating an average age (day) on a single period of cultivation.
Elent = Ʃpop(head)i x EFent(i)
Elwas = Ʃpop(year)i x EFwas(i)
Elt = Elent + Elwas
Elent : emission of enteric fermentation (ton/year)
Elwas : emission of waste processing (ton/year)
Elt : total livestock emission (ton/year
Ʃpop(head)i : sum of livestock (head)
Ʃpop(year)i : sum of livestock (head/year)
EFent(i): emission factor of enteric fermentation
EFwas(i): emission factor of waste processing
The emission of livestock is a multiplication between sum of livestock (annually or head) with specific emission factors for a both groups of enteric fermentation and waste processing [9].
Land processing emission
Emission of land processing was calculated by utilizing an activity data and a converted emission factor. The conversion was conducted to a standard value of emission factors (1,61 kgCH4/ha/day). Differences of environment and an additional material on planting leading an adjustment of emission factor. A defining factor on an adjusting emission factor is a watering regime and a fertilization method. Table 1 shows an adjusted emission factor based on calculation of defining factors in Boyolali.
| Jenis/tipe pengairan sawah padi | Faktor emisi (kgCH4/ha/hari) |
|---|---|
| Sawah non irigasi | 0 |
| Sawah irigasi tergenang terus menerus | 0,377 |
| Sawah irigasi intermiten-single aerasi | 0,173 |
| Sawah irigasi intermiten-single aerasi | 0,196 |
| Sawah tadah hujan | 0,102 |
Table 1: Emission factors for any type of irrigation on paddy rice; Source: primary data processing (2017).
The methane emission of land processing will be calculated with formula below
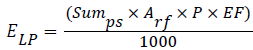 (1) With
ELP: sum emission of land processing (ton / year)
Sumps : Number of Planting Season
Arf : Area rice paddy (ha)
P : Planting Time (days)
EF : New emission factor
Biomass burning emission
Emission of biomass burning is produced from an agricultural waste burning and land clearing.
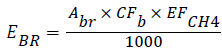 (2) With
EBR : The biomass burning emission
Abr : Sum of a burning agriculture area
CFb :consumption factor of biomass
EFCH4 : Emission factors of CH4 on the biomass burning
General analysis
The total emission of agriculture in Boyolali is a whole of emission produced by activities in livestock, land
Processing and biomass burning which happens inside the administrative area of Boyolali. Emission results will be displayed in a calculation table, pie chart of emission and dendogram. A trend of emission will be analyzed only in specific activities with availability of data series. The result was reviewed with a descriptive-quantitative method.
Boyolali is a small-mid scale city in Central Java. Total area of this regency is 101.510,1955 Ha with 22,37% occupied by paddy field in which watering is by a rain receptacle type (45%) and various type of irrigation (55%). Major livelihood of population is dominated by agricultural worker, especially as a crops farmer and breeders.
Boyolali is recognized as one of a rice barn of Central Java and also as primary suppliers of rice to other city around. In livestock sector, this regency was well known by the cattle products. Growth of agricultural in Boyolali was supported by a socio cultural as the agrarian communities and availability of a large open space.
Local communities regarding a livestock will support their agriculture sectors. Livestock considering having a mutualism symbiotic with agriculture. Waste of livestock is popular to reuse as the organic fertilizer for crops cultivation. Some of weeds are coming in useful as a livestock feeds. Based on the products, a livestock activity was giving a significant contribution on local economy, especially from the cattle products.
The agriculture in Boyolali was held on traditional system. A land preparation, planting, nursing, harvest and waste management was held traditionally in fact without any management. This condition refers to a better natural resources support, weakness of knowledge and low perception of environmental awareness.
Agriculture is a major contributor of a methane emission in the world with a flooded rice ecosystem accounting approximately 20% of the total global CH4 budget [10]. Animal husbandry as part of agriculture contributes approximately 47% of GHG emission only from an emission of enteric fermentation. Overall, the animal husbandry is contributing almost 90% of the methane emission in agriculture sector. Animal husbandry also contributes CO2 in whole process and NO2 especially in production of animal feed [11].
Boyolali is a crops and livestock producer, especially in Central Java. It means, this area has a potential to contribute a large scale of methane emission from both activities. Emission inventory was regarded as an important part as emission mitigation from agriculture sector. This step will provide a basic data for preparing an air quality management in Boyolali. Calculation of emission will be conducted by utilizing secondary data from agriculture sector of Boyolali. In this sector, Boyolali has three main activities which have a large potency of methane emission: animal husbandry (livestock), land processing and biomass burning.
Livestock
Livestock in Boyolali is popular with the cattle products both in the terms of meat and milk. The cattle products are distributed continuously to other cities around. This condition boosts an increase of cattle breeding which was indicated by larger population of cattle than any other type of livestock, especially on group of non-poultry (Figure 1).

Figure 1: The composition of livestock in Boyolali in 2015.
Groups of non-poultry are dominated by cattle (51%) while various type of chicken (95%) is dominates the poultry groups (Local Agency of Agriculture Boyolali, 2016). Table 2 shows a detailed data of livestock and emission factors which was used to calculate the CH4 emission.
| Type of livestock | Sum (head)1 | Average of breed(day)2 | Annual pop.(head/year) | Emission factors (kgCH4/head)3 | |
|---|---|---|---|---|---|
| Enteri fermentation | Manure management | ||||
| Breed cattle | 80.092 | 80.092 | 47 | 1 | |
| Dairy cattle | 77.805 | 77.805 | 61 | 31 | |
| Buffalo | 862 | 862 | 55 | 2 | |
| Goat | 93.626 | 93.626 | 5 | 0,2 | |
| Sheep | 53.872 | 53.872 | 5 | 0,22 | |
| Pork | 3.249 | 3.249 | 1 | 7 | |
| Horse | 286 | 286 | 18 | 2,19 | |
| Indigenous chicken | 725.768 | 60 | 119.304,33 | 0,02 | |
| Roaster | 1.460.420 | 60 | 240.069,04 | 0,02 | |
| Yearling | 1.038.513 | 60 | 170.714,47 | 0,03 | |
| Duck | 139.632 | 60 | 22.953,20 | 0,03 | |
Table 2: Details of livestocks and the emission factors applied; 1source Boyolali Statistic Agency, 2015; 2value estimated by EMEP/EEA Corinair (2003) Chapter 3B Manure Management; 3IPCC (2006).
Total emission of animal husbandry is combination from an enteric fermentation and waste processing. Both of the emissions are calculated by using specific data activity and emission factors. Emission of enteric fermentation only generated by the ruminants. Daily average of poultry breeding is 60 days; this value is the sum of breeding day in poultry from a start until slaughter process, as a halffinished product.
Result (Table 3) shows an enteric fermentation as dominant source of emission in the livestock activities. Overall, the emission of enteric fermentation is three times larger than the emission of waste processing. Its means, a non-poultry cultivation, especially the ruminants, have a largest potency of emission than the poultry. The value will be significant when followed by a larger population. A cattle breeding is a major contributor of emission, both in enteric fermentation (91%) and whole emission (92, 65%). Emission of waste processing is dominated by the dairy cattle (94%). Methane livestock emission in this research was appropriate with a similar research [12]. The research described that 50% of the methane emission in terrestrial zone is produced by livestock activities in which 25% was contributed by the ruminants.
| Type of Livestock | Enteric ferm. Emission (tonCH4/year) | Waste manage. Emission (tonCH4/year) | Total Emission (tonCH4/year) |
|---|---|---|---|
| Breed cattle | 3764,32 | 80,09 | 3834,41 |
| Dairy cattle | 4746,11 | 2411,96 | 7158,07 |
| Buffalo | 47,41 | 1,72 | 49,13 |
| Goat | 468,13 | 18,72 | 486,86 |
| Sheep | 269,36 | 11,85 | 281,21 |
| Pork | 3,25 | 22,74 | 25,99 |
| Horse | 5,15 | 0,63 | 5,78 |
| Infdigenous chicken | 2,39 | 2,39 | |
| Roaster | 4,80 | 4,80 | |
| Yearling | 5,12 | 5,12 | |
| Duck | 0,69 | 0,69 | |
| Total of Emission (tonCH4/year) | 9303,73 | 2560,71 | 11864,44 |
Table 3: The CH4 emission of livestock activity in Boyolali; Number : primary data processing (2016).
The ruminants have a rumen, in fore stomach, where a group of bacteria produces CH4 from an anaerobic digestion of cellulose and other macromolecules present in their feed utilizing H2 and expelling it through eructation from mouth and nose [13]. The CH4 emission is affected by the age of animal, body type, weight and feed. Methane production represents a significant loss of gross energy [14]. In ruminants, it affects the performance [15].
Emission result and composition of animal deciding a more ecoaccommodating development on the poultry allude to the emission. This is indicating on total emission in poultry breeding. The large number of poultry than ruminants had only produced < 1% of methane emission. This condition was driven by absence of enteric fermentation in the poultry.
Land processing
Methane of land processing in Boyolali is contributed by processing activities of paddy field, especially on flooded rice field ecosystem. Referring to IPCC, emission from land processing in Boyolali is categorized as Cropland, defined as groups of area specialized as crop cultivation including paddy field and other area which have a vegetation structure below the threshold of forest area. Methane emission on a paddy field processing are driven by an anaerobic decomposition of organic materials (Table 4).
| Parameters | Type of cropland (paddy rice) | ||||
|---|---|---|---|---|---|
| Non-irrigate | Irrigate continously | Intermitte Irrigation | Irrigate (multipl aeration) | Natural irrigation (rain receptacle) | |
| Sum of an annual cultivation season* | 2 | 3 | 3 | 3 | 2 |
| Sum area paddy rice**(ha) | 2395,37 | 5074,25 | 4852,75 | 2665,34 | 10118,81 |
| Cultivate period*(day) | 90 | 90 | 90 | 90 | 90 |
| Application rate of organic materials (ton/ha)*** days |
|||||
| a. straw < 30 | 0,55 | 0,55 | 0,55 | 0,55 | 0,55 |
| b. straw > 30 | 0,77 | 0,77 | 0,77 | 0,77 | 0,77 |
| c. compost | 0,22 | 0,22 | 0,22 | 0,22 | 0,22 |
Table 4: The activity data on land processing of the boyolali agriculture; *expert judgment and observation; **from Statistics Agency of Boyolali (2015) [16]; *** secondary documents and interview on The Agency of Agriculture, Plantae and Forestry of Boyolali.
A different value of an emission factor in land processing is affected by a watering regime and a fertilizing method. Based on the data of key factors a new emission factors are shown in (Table5).
| Regime of Irrigation | Conversion factor of Organic coefficients | ||
|---|---|---|---|
| Type of irrigation | Value | Type | Value |
| Non irrigation | 0 | Straw < 30 day | 1 |
| Irrigate continuously | 1 | Straw > 30 day | 0,29 |
| Intermitted single aer. | 0,46 | Compost | 0,05 |
| Intermitted multiple aer. | 0,52 | Pupuk kandang | 0,14 |
| Rain receptacle | 0,27 | Green fertilizer | 0,5 |
| SF before cultv. period | 1 | ||
| SF Soil | 0,29 | ||
Table 5: Determinant of new emission factor of land processing on boyolali.
Emission of land processing is calculated by utilizing an availability of the activity data and new emission factor. The following is the calculation result of methane emission.
The calculation determined an annual value of CH4 emission is 1070,08 ton (Table 6). The value was away below a livestock emission, both on an enteric fermentation and waste processing. Largest contributor is a flooded rice field ecosystem (516,45 ton) and the lowest one is in non-irrigated field (0,00 ton). This result indicates a constant and watering agriculture was producing a larger methane emission compensating the productive harvest. The result confirmed a growth of population followed by increased need of food contributed to the methane rising in atmosphere. It will be Significant on a ricefeed dependency country which predominantly produced in a watered field.
| Type of Irrigation | Emission loads (ton/year) |
|---|---|
| Non irrigation | 0,00 |
| Irrigate continuously | 516,45 |
| Intermitted single aeration | 227,19 |
| Intermitted multiple aeration | 141,06 |
| Rain receptacle cropland | 185,38 |
| Total of Emission (tonCH4/year) | 1070,08 |
Table 6: Emission of cropland processing in Boyolali.
Rice cultivation is considered as a main contributor of methane emission in agriculture. The reduction effort was conducted with a land drying on mid-season, limitation in the organic fertilizer [17], a modification of rain intensity [18], plant rotation, utilization of a rice species with dry resistant and a conversion of main food.
Major of the paddy field in Boyolali are irrigated annually, not depending on the season. Only 45% of paddy rice is a rain receptacle cropland. This condition makes a farmer to have privacy on rice cultivation without any boundary of the water availability. Rice development tends to conduct consistently during the year as effect of high demand from the market. Their cultivation was conducted without any plant rotation. This situation was followed by a continuously flooded land. A use of organic fertilizer tends to increase the effects of abundance on a livestock wastes.
A land processing has unlimited negative impacts on methane emission. Land processing also produces other type of GHG likes N2O which is produced by use of excessive fertilizer especially a fabricated fertilizer. Application of a fossil fuel instrument on land processing has a potency to contribute a carbon dioxide emission. Methane, N2O and CO2 are 3 main parameters of GHG. A traditional land processing has a higher potency on the inefficiency of water. The condition was more vulnerable to occur in area with abundant water resources as impacts of low public awareness.
Mission of land processing has a different character on the spatial distribution. Their emission is scattered including on Boyolali which have an even agriculture area. The character makes a land processing emission more suitable as an area emission instead of a point emission. It means, their emission will have a widespread distribution and difficult to be handled whether the lower values in each spot than a type of point emission.
Biomass burning
An agricultural waste burning was a popular action by farmer as effects of the low knowledge about environmental impacts and a weakness in the reuse innovation. Biomass burning is defined as an either controlled or uncontrolled burning on neither the agricultural area nor their waste in a specific spot. In an interview with a local agricultural agency it was observed that waste burning was done by majority of farmers (more than 50%) in Boyolali. Nevertheless, the local government made an effort to appeal and prohibit the burning of an agricultural waste.
Further observation shows that approximately 60% of paddy field in Boyolali had been burning at after the harvest. Total burning area was reaching 18.877,86 ha from total of 25.106,52 ha paddy field. The table below displays an emission load from burning of an agriculture waste in Boyolali.
Total emission of methane from the biomass burning is 560,67 ton annually (Table 7). This is the lowest value of methane than any other sources (livestock and land processing). Nevertheless, it has a significant ecological risk which will give negative impacts to environment. Methane is not a single emission produced from biomass burning. It also produces a significant CO2 emission as the result of a complete combustion. The burning process also produces particulates emission with a smaller size and an ability to attach other compounds including a heavy metal. Their small size provides a high risk to the human health as effect of the ability to penetrate into the respiratory organs. Particulates also gives a negative impact on vegetation, especially related with the dangerous compounds attached.
| Variables | Values | Units |
|---|---|---|
| Harvesting waste | 5,5 | ton of dry weight/biomass/ha |
| Emission factor of CH4 | 2,7 | g/kg of dry weight |
| Estimating burning area | 18.877,86 | Ha |
| Sum of annual harvest | 2 | Time |
| Emission Loads | 560,67 | tonCH4/year |
Table 7: Emission estimate of the agricultural waste burning on Boyolali.
General Review
In overall, an agriculture sector in Boyolali contributed an approximately 13.495,19 ton of the methane emission annually. A major of it was produces by animal husbandry (88%) (Figure 2). Detail analysis determines an enteric fermentation as major contributor in the animal husbandry emission. The activity is referring to a ruminant’s cultivation as the main commodity in The Boyolali Regency (a breed and dairy cattle).

Figure 2: Composition of methane emission from the agriculture sector in Boyolali.
Load emission trend in agricultural sector in Boyolali indicates a similar pattern with other research. Previous research observed an enteric fermentation [19], a fertilizer use and a rice production [20] as a dominant contributors of methane emission from the agricultural sector. A research from Kumari points a cattle as the main contributors of CH4 emission reaching 50% of overall methane emission [15].
Review on the livestock emission confirmed that ruminants have a significant contribution on the methane emission in Boyolali. Two types of cattle dominating emission reaches 93% followed by goat (4%) and sheep (2%) (Figure 3). Specifically, a dairy cattle is a major contributors of methane in livestock (60%). Trend of emission in a livestock display a fluctuated value with a tendency to decrease in 2015. This condition was affected by reducing of ruminants at the similar year.

Figure 3: Compostion of an emission based on type of livestock (left) and the trend of a livestock methane emission in Boyolali at 2010-2015.
Methane emission of ruminants was a consequence of an efforts to improve the welfare This opinion also valid on another activity of agricultural which roles as an economic driver in The Boyolali Regency. The emission management became mandatory efforts to conduct, especially on the animal husbandry as the main contributor of methane emission.
Previous research determines an effective method to reduce the methane emission of livestock. The method is stabilization on the ruminants population, an optimizing of demand and an adjustment on type and level of feeds [15]. Research from Chaokaur [21] stated a domination of ruminants, especially a cattle, must be modifying a feed to get an efficiency on the energy use and reducing a loss of energy throuh the excretion process.
Reuse of the cattle dung as organic waste is the main efforts to reduce a methane emission of agricultural activities in Boyolali. This action has been implemented by the majority of breeders in Boyolali. Previous research described that the use of organic fertilizer will not increase the agricultural products significantly. On the contrary, an excess application of organic fertilizer produced a significant methane emission to atmospheres. Redirection of the emission flow happens on this utilization, from a waste management to a land processing emission
Second efforts were related to the waste management through a reuse of the cattle dung as an alternative energy (biogas). This action at least could reduce a community dependency on either fossil fuels or wood waste fuel which will produces higher emission than biogas. In Boyolali a utilization of biogas was important redirecting from the application of wood or wood waste as domestic fuels. Waste management as biogas has been started by the local government with involvement of the local communities especially breeders.
Reuse of livestock manure in the second model (as biogas) is seen as giving a more positive impact on the environment. Although it still produces methane emissions, this effort is an effective diversion from the emergence of greater carbon dioxide emissions through the use of previous energy sources. Wood and wood waste are known to be one of the favorite energy sources of Boyolali rural communities with a percentage reaching 34.83% or equivalent to the consumption of 128 thousand tons/year. Timber burning GHG emissions are more risky and greater than the use of biogas.
The agricultural sectors were a main commodity of The Boyolali Regency. An agricultural sector has a potency to contribute 13.495,15 ton CH4 annually which comes from 3 main activities: an animal husbandry (livestock), a paddy field processing and a harvest waste burning. Main contributor of emission is a livestock activities which contributes 11.864,44 ton CH4 annually similar with 88% of the overall emission. The enteric fermentation of ruminants contributes 69% of a methane emission in livestock in which a group of dairy cattle contributed 60% of the emission. A relatively small emission was contributed by a land processing (8%) with major of them were caused by the continuously irrigation on paddy field throughout the year.
Sunarto and Widhi Himawan are thankful to The Agency of Environmental of Boyolali for giving a research legality and access to inventing a methane emission from the agricultural sector. We also thanks The Agency of Agriculture, Plantae and Forestry of Boyolali and The Statistics Agency of Boyolali for supporting our secondary documents. Last but not least, we give thanks and respect to The Environ Research Group of Biology Department on Sebelas Maret University for support a primary survey.
