Research Article - (2013) Volume 1, Issue 2
Keywords: Meteorology; Hydrology; Maritime hydraulics; Rainfall; Extreme events; Tidal levels; Natural disasters; Geomorphology; Debris-flow
This research is inserted into an area of Civil Engineering, in the interface between Maritime Hydraulics (tidal levels) and Hydrology (rainfall). Our main objective was to evaluate rainfall events combined with tidal levels, and to obtain practical results applicable to fluvial and maritime projects in the Santo Antonio River Basin (Figure 1), located in the city of Caraguatatuba, on the North Coast of São Paulo /Brazil. Coastal areas are subject to severe sea action and precipitation. The north coastal region of São Paulo is known for its orographic rainfall, caused by moisture fronts from the Atlantic Ocean; when they collide with the mountain range of Serra do Mar, there is precipitation on the coastal towns. There is a great demand for studies on the subject, mainly with historical occurrences of disasters in the last century. According to Brigatti and Sant’AnnaNeto [1], the Northern Coast of Sao Paulo, for its own natural characteristics and the recent economic dynamics, is characterized as an area in which studies aimed at better understanding the natural and anthropogenic factors are developed, and are extremely important.
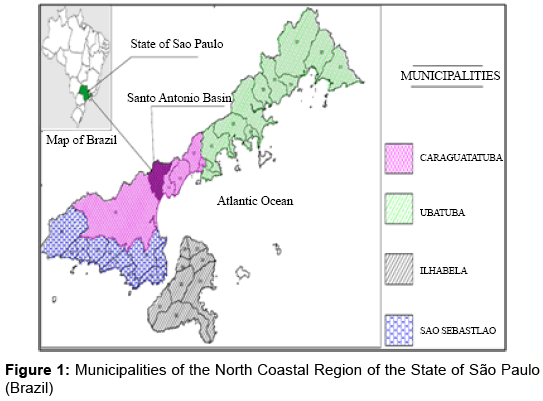
Figure 1: Municipalities of the North Coastal Region of the State of São Paulo (Brazil).
For illustrating the magnitude of the 1967 disaster, images of Caraguatatuba were collected right after the debris flow (Figure 2a, 2b and 2c). Figure 2d shows the city of Caraguatatuba in 2012 (Santo Antonio River basin), with a population of approximately 100,000 inhabitants. It is notorious that a similar event to that of 1967 would cause significant damages. Some consequences of this particular event were:
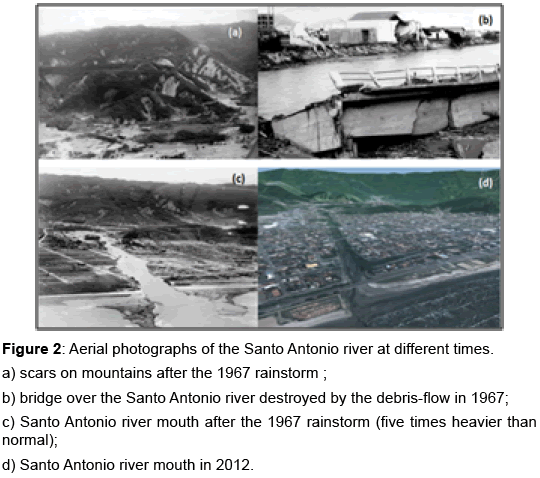
Figure 2: Aerial photographs of the Santo Antonio river at different times.
a) scars on mountains after the 1967 rainstorm ;
b) bridge over the Santo Antonio river destroyed by the debris-flow in 1967;
c) Santo Antonio river mouth after the 1967 rainstorm (five times heavier than normal);
d) Santo Antonio river mouth in 2012.
• 2 million ton of mobilized material;
• 436 registered casualties, 400 buildings destroyed, 3,000 displaced people among 15,000 inhabitants;
• 4m to 5m high block deposits were formed along the Santo Antonio River. The largest boulders weighed between 30t and 100t
• Widening of the Santo Antonio River: from 10m to 20m to 60m to 80m in some areas.
As well known, in the coastal area, the combined effect of rainfall and high tides can generate the classical phenomenon called “tidal flooding” [2]. This effect, associated with the landscape and debrisflow generated by a continuous rainfall in the fragile territory, produces a combined risk of natural hazards because the coastal cities are particularly vulnerable to flood under multivariate conditions (i.e. heavy precipitation, high sea level, storms, etc).
It follows that the combined effect of multiple sources and the joint probability of extremes should be considered to assess and to better manage the flood risk in the coastal zone.
It is worth noting that the study of the joint effect between the tide and the rainfall flooding effect has been one of the most important areas of knowledge developed in the research community in the new century [2-5]. However, most of this analysis was conducted using numerical modeling and neglecting a detailed statistical analysis between rainfall and tide data recorded [5].
In this study, we developed a multivariate probability model to study the join risk probability and focused on the area of the Sao Paulo North Coast where we currently find a lack of study and analysis. This study fits this regional context, and our purpose is to provide consistent analyses of historical data of tidal levels and rainfall.
Given the evident extreme rainfall events and random sea level behavior, the discussion on whether there is an interdependence of two variables and, especially, how they have been developing faced with climate change was fostered. The methodology described in this item was adapted from HIDROCONSULT [6], which conducted a similar study for Cubatão city, Central Coast of São Paulo State. The methodology adopted was founded on four steps as follows:
• collection, processing and data validation of tidal levels for the North Coast region of the State of São Paulo;
• collection and processing of rainfall data for the region of the North Coast of the State of São Paulo;
• understanding, development and application of statistical methodology, combined with the occurrence of rain-tide for Caraguatatuba region;
• obtaining graphs and tables of probabilities of the occurrence of certain phenomena involving rainfall and tides;
Step 1: Getting the database
The database was composed of two groups: tidal levels and rainfall values. The characteristics of these values are explained below.
Tidal data: The tidal level data come from different sources of different institutions, as described:
• IGC tidal station (CartographicandGeographic Institute) inUbatuba;
• IOUSP tidal station (Institute of Oceanography, USP-University of São Paulo) inUbatuba;
• CTH tidal station of Hydraulic Technological Center in Martinde SáBeach/Caraguatatuba;
• São Sebastião Harbour tidal station;
• Buoyof CEBIMar (Marine Biology Center, University of São Paulo) in São Sebastião.
The compilation of information from tidal stations generated a large database from 1954 to 2005, with some intermediate gaps. This database comprises over 225,000 hourly values of tidal levels.
Rainfall data: The composition of the rainfall database in the city of Caraguatatuba started with searches of data viability in Agência Nacional de Aguas [7]. TheE2-046 rainfall station (Caraguatatuba) contains data from 1943 to 2010, totaling 24,603 daily values of rainfall heights, and was thus considered in this research.
Step 2: Data compilation
From the database of tides and rainfall heights, the second procedure for applying the methodology was performed: data compilation.
The tides and rainfall values were organized so as to allow direct relationships between the daily rainfall in the Santo Antonio River Basin, and its levels in the tidal stations of the Northern Coast of São Paulo State. Table 1 illustrates how the data for the month of January 1954 were compiled. At the end of step 2, 9,361 days with the relationship between rainfall and tides (High tide; Low tide and Mean sea level) were recorded.
| Date | Data of tidal Station (IBGE Reference) | Rainfall (mm/day) | ||
|---|---|---|---|---|
| Low Tide (cm) | MeanSeaLevel (cm) | High Tide (cm) | ||
| 01/01/1954 | -74.83 | -26.96 | 15.17 | 0 |
| 02/01/1954 | -78.83 | -34.92 | 4.17 | 0 |
| 03/01/1954 | -62.83 | -13.13 | 20.17 | 16.7 |
| 04/01/1954 | -54.83 | 12.50 | 60.17 | 14.5 |
| 05/01/1954 | -85.83 | -8.54 | 45.17 | 7.9 |
| 06/01/1954 | -97.83 | -19.50 | 25.17 | 3.2 |
| 07/01/1954 | -75.83 | -16.92 | 25.17 | 4.2 |
| 08/01/1954 | -56.83 | 4.87 | 45.17 | 0 |
| 09/01/1954 | -57.83 | -3.83 | 29.17 | 0 |
| 10/01/1954 | -67.83 | -20.21 | 8.17 | 0 |
| 11/01/1954 | -64.83 | -19.54 | 4.17 | 0 |
| 12/01/1954 | -44.83 | -19.79 | 3.17 | 0 |
| 13/01/1954 | -34.83 | -11.83 | 27.17 | 0 |
| 14/01/1954 | -31.83 | -1.21 | 30.17 | 0 |
| 15/01/1954 | -59.83 | -11.08 | 35.17 | 0 |
| 16/01/1954 | -64.83 | -14.17 | 28.17 | 0 |
| 17/01/1954 | -71.83 | -15.29 | 28.17 | 0 |
| 18/01/1954 | -64.83 | 0.00 | 44.17 | 0 |
| 19/01/1954 | -77.83 | -6.67 | 38.17 | 1.2 |
| 20/01/1954 | -79.83 | -12.67 | 36.17 | 0 |
| 21/01/1954 | -62.83 | -8.13 | 41.17 | 3.3 |
| 22/01/1954 | -61.83 | -7.00 | 37.17 | 2.5 |
| 23/01/1954 | -61.83 | -9.92 | 36.17 | 0 |
| 24/01/1954 | -42.83 | -6.00 | 30.17 | 0 |
| 25/01/1954 | -39.83 | -14.67 | 13.17 | 0 |
| 26/01/1954 | -38.83 | -11.25 | 13.17 | 0 |
| 27/01/1954 | -26.83 | -7.08 | 11.17 | 0 |
| 28/01/1954 | -40.83 | -18.46 | -1.83 | 0 |
| 29/01/1954 | -51.83 | -21.83 | 2.17 | 0 |
| 30/01/1954 | -48.83 | -15.46 | 16.17 | 0 |
| 31/01/1954 | -57.83 | -6.38 | 36.17 | 0 |
Table 1: Example of compilation of daily tidal levels and daily rainfall heights, for the Santo Antônio Basin, in January 1954.
Step 3: Division of database into rainfall groups
The third step of the methodology divides the database into groups, based on the accumulated daily rainfall: P ≥ 0 mm/day, P ≥ 25 mm/day, P ≥ 50 mm/day, P ≥ 75 mm/day, P ≥ 100 mm/day. The division of the database into groups is an important step in the process, because each rainfall track represents a probabilistic curve of occurrence of rain-tide phenomenon, as demonstrated ahead.
Step 4: Reorganization of database, parameterized by tidal levels
The data were reorganized, after the separation into rainfall groups (see Step 3), following the guidance below:
• for each precipitation interval (it is convenient to separate them into different worksheets), the table was rearranged in decreasing order, using tidal levels (higher tides at the top of the table) as a parameter. This methodology also has to be applied separately to daily Low tides, daily Mean Sea Level and daily High tides;
• note that the rainfall values should always be kept with the equivalences of daily tides (as in Step 2);
• for each precipitation interval, the major annual events of tide (for Low tides, smaller annual events should be chosen) should be selected, because the Return Period (TR) will be calculated in years.
As a result of this step, there are several tables (one for each precipitation interval), sorted from highest to lowest tides (Minimum daily Low tides, Highest daily Means Sea Levels and Highest daily High Tides) with annual extreme values . It is worth observing that the event (days) must be repeated at different intervals, for instance, the same day with rains over 100 mm (P>100 mm/day) rains over 75 mm (P> 75 mm/day).
Step 5: Calculation of probability of combined events (rainfall-tidal level)
At this stage, probabilities of occurrence of certain sea level are calculated, associated with a rainfall range using a Gumbel mixedmodel as suggested by Yue et al. [8]. Table 2 illustrates this step. For each precipitation interval described in step 3, a different table was generated.
| Mean Sea Level (maximum Annual) IBGE Reference (cm) | Day | Rainfall (mm) | Probabilitiesofoccurrence P (%) | OrderNumber |
|---|---|---|---|---|
| 52.00 | 30/05/1988 | 26.2 | 2.86% | 1 |
| 49.79 | 07/07/1989 | 0 | 5.71% | 2 |
| 49.28 | 22/06/1990 | 0 | 8.57% | 3 |
| 48.93 | 31/07/1980 | 4.1 | 11.43% | 4 |
| 47.79 | 15/08/1999 | 0 | 14.29% | 5 |
| 45.33 | 10/05/1956 | 3.5 | 17.14% | 6 |
| 45.11 | 13/05/1959 | 1.6 | 20.00% | 7 |
| 44.44 | 20/02/1995 | 63.5 | 22.86% | 8 |
| 44.42 | 10/02/1966 | 0 | 25.71% | 9 |
| 43.96 | 23/11/1970 | 0 | 28.57% | 10 |
| 42.56 | 11/03/1987 | 17.8 | 31.43% | 11 |
| 42.52 | 11/06/1993 | 19.4 | 34.29% | 12 |
| 41.13 | 17/07/2000 | 3.7 | 37.14% | 13 |
| 40.66 | 17/06/1971 | 6 | 40.00% | 14 |
| 40.59 | 19/12/1994 | 15.2 | 42.86% | 15 |
| 40.20 | 07/01/1996 | 21.8 | 45.71% | 16 |
| 39.87 | 12/02/1998 | 22.3 | 48.57% | 17 |
| 39.43 | 05/07/1991 | 0 | 51.43% | 18 |
| 37.85 | 16/07/1992 | 2.1 | 54.29% | 19 |
| 37.52 | 05/05/1963 | 0 | 57.14% | 20 |
| 36.75 | 22/05/1978 | 5.3 | 60.00% | 21 |
| 36.57 | 07/04/1979 | 13.5 | 62.86% | 22 |
| 35.69 | 10/06/1983 | 3.2 | 65.71% | 23 |
| 35.48 | 09/12/1982 | 2.3 | 68.57% | 24 |
| 34.93 | 30/09/1981 | 1.8 | 71.43% | 25 |
| 34.28 | 26/05/1958 | 8.8 | 74.29% | 26 |
| 33.35 | 29/07/1955 | 0 | 77.14% | 27 |
| 33.04 | 15/04/1986 | 0.5 | 80.00% | 28 |
| 32.24 | 13/12/1972 | 16.5 | 82.86% | 29 |
| 31.37 | 04/07/1965 | 0.8 | 85.71% | 30 |
| 30.32 | 26/03/1997 | 1.1 | 88.57% | 31 |
| 30.22 | 30/03/1964 | 20.6 | 91.43% | 32 |
| 29.62 | 11/05/1954 | 1 | 94.29% | 33 |
| 12.76 | 22/12/1977 | 35.9 | 97.14% | 34 |
Table 2: Calculation of probability of combined events (P ≥ 0 mm/day and Mean Sea Level), for the Santo Antonio Basin.
Based on the methodology described in the previous section, more relevant results were obtained. Figure 3 shows the graphical result from the statistical analysis of the previous item. From the graph, Table 3 summarizes the main values useful for both for maritime and fluvial hydraulic projects in the region. For a macro drainage project, for example, a 50-year Return Period is considered. By assuming this hypothesis, it is necessary to adopt a Mean Sea level of 50.69 cm for any daily rainfall (P>0 mm/day). Note that for the same Return Period (50 years) simultaneously with more rainy days (P> 100 mm/ day) a lower Mean Sea Level (40.59 cm) may be assumed; hence, an elevated sea level along with heavy rain is less likely to occur. Another important concept is, for example, days with the same rainfall characteristics (i.e.: P> 0 mm/day), as larger Return Periods (less likely to occur) are selected, simultaneous higher sea levels must be adopted.
| Rainfall (mm/day) | ReturnPeriod (TR)-Years | Mean Sea Level (cm)-IBGE Reference | ||||||
|---|---|---|---|---|---|---|---|---|
| 2 | 5 | 10 | 20 | 50 | 75 | 100 | ||
| >0 | 38.56 | 46.11 | 49.18 | 50.28 | 50.69 | 50.75 | 50.77 | |
| >25 | 25.74 | 37.86 | 43.82 | 45.75 | 46.27 | 46.30 | 46.31 | |
| >50 | 20.69 | 30.33 | 36.77 | 40.81 | 43.49 | 44.11 | 44.42 | |
| >75 | 14.89 | 25.62 | 33.54 | 39.13 | 43.13 | 44.08 | 44.57 | |
| >100 | 11.95 | 31.64 | 37.71 | 39.81 | 40.59 | 40.71 | 40.76 | |
Table 3: Results applicable to Engineering projects (Rainfall x Mean Sea Level).
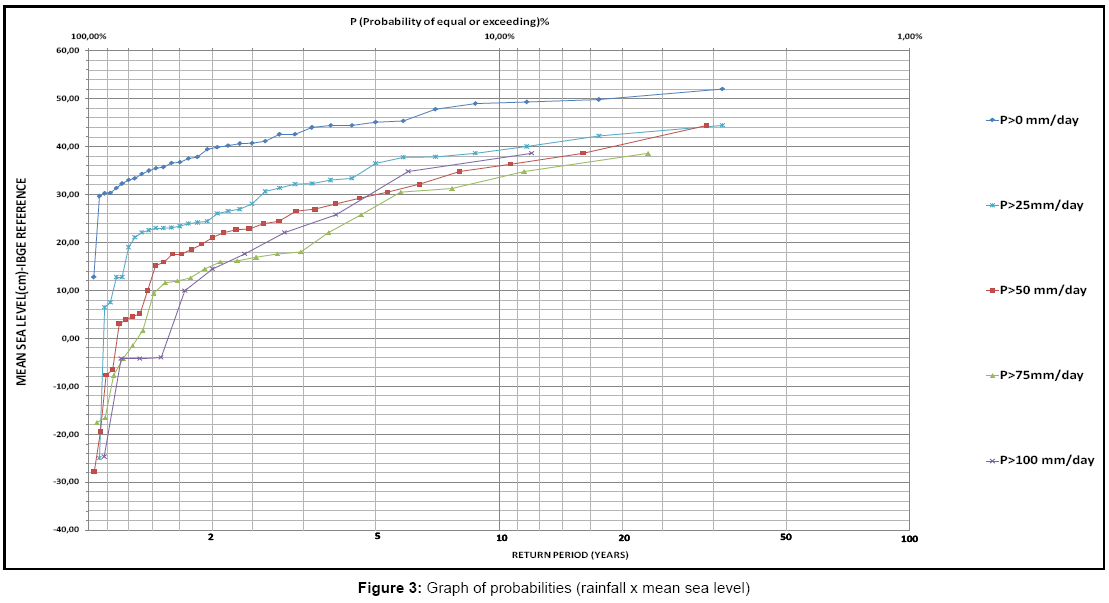
Figure 3: Graph of probabilities (rainfall x mean sea level).
This statistical analysis can be completed with a hydrodynamic analysis as shown by Sakai et al. [9]. The Authors show that the tide level and the rainfall analysis can be used as boundary conditions for an analysis made with a hydro dynamical model (FLO-2D). The results, simulation of the catastrophic event of the 18th March 1967, demonstrate how, in the coastal area, the risk is generated by an association of different situations: rainfall, debris flow and tide flooding. The area affected by the flooding was plotted on the map (see Figure 4) in order to facilitate understanding the results.
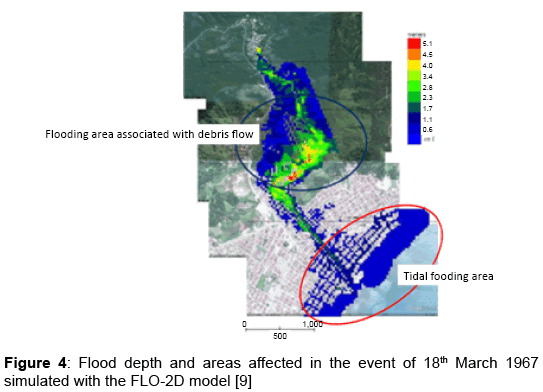
Figure 4: Flood depth and areas affected in the event of 18th March 1967 simulated with the FLO-2D model [9].
By composing both the results presented in Figure 4 and in Table 3, the real catastrophic scenario of an event of this size is fully characterized. According to Brigatti and Sant’Anna Neto [1], regarding the occurrence of floods and flooding, the north coast has unique characteristics, mainly provided by its physical aspects and land use. The occupation on the banks of rivers and their mouths, together with a peculiar atmospheric dynamics and tidal fluctuations, commonly cause serious socio-environmental damages. The interrelationship ocean-atmosphere-continent is extremely complex and leads to an uncertainty region. In the specific case of the episodes related to floods and flooding, many aspects must be considered, namely:
? the meteorological factors (mainly related to the cold fronts going through the region and the variations of their elements, especially wind, rainfall and atmospheric pressure);
? the coastal dynamics (its relations with meteorological events, currents and depositional processes that directly influence the rates of discharge of rivers, besides the tidal dynamics, notably related to spring tides episodes;
? the land use and anthropogenic influences (change in surface flow and absorption along the coast);
The North Coast region of the State of São Paulo is located in an area with important atmospheric activities. The mountains of Serra do Mar act as a barrier to the atmospheric flow from the ocean and its presence gives the region a complex configuration in relation to rainfall, as noted by Conti [10], and the orographic effect greatly participates in this dynamic [11].
From the climatic point of view, the element that most stands out is the rain, with areas that have the highest total rainfall in Brazil (with an annual average of over 4000mm/year, 6000mm/year reached in extreme years). There is also the presence of “rain shadow islands” provided mainly by the massive island of São Sebastião, which is located in the north of the São Sebastião channel and over the Caraguatatuba bay region. In these areas, total rainfalls are lower (around 1800mm/year). From the point of view of the performance of atmospheric systems, the region is dominated by tropical masses, but due to their transitional climate position, it presents constant frontal systems (cold fronts), which, together with the morphological and the Serra do Marrange, accounts for the most extreme rainfall events [12].
These climatic characteristics, coupled with a strong slope of the relief, the small extension of the coastal plain, the shapes of the basins of major rivers and the ocean dynamics, characterizes a fragility region, aggravated by irrational occupation and the construction of numerous roads, with the presence of irregularly occupied areas and projects poorly carried out in areas susceptible to extreme episodes [13].
The coastal regions of Brazil constantly suffer with extreme events due to both heavy rainfall and sea forces (waves, tides, currents). The study of natural phenomena must begin with a continuous collection of data. It is understood as essential that any analysis is based on collection, storage and processing of data of natural variables (tidal levels, rainfall heights, waves, currents, etc.), to allow treating the phenomena statistically, linking them to the probabilities of occurrence. This research is inserted in this initial process. From statistical studies, the results can be applied to Engineering practice. The coastal projects should consider the lessons learned from past events, both with the direct application of statistical analyses, and by using mathematical models, such as input data for simulations of natural events. In recent decades, from databases and mathematical models, an Engineering advanced section is committed to discussing, whether the projects already built will suffer from climate change, such as the increase of the Mean sea level, more frequent heavy rainfall and debrisflow events that destroy cities on the coastal floodplain. Therefore, repair works will become increasingly more frequent in these regions.
This paper was supported by Redelitoral, with the project described in [14], funded by CAPES (Coordination for the Improvement of Higher Education Personnel). The authors would also like to thank Promon Engenharia that encourages its employees to participate in academic research.
