Review Article - (2015) Volume 3, Issue 2
A series of extreme climate events were observed in Puerto Rico during the summer of 2012, which included the month with the most 32.2°C days, the hottest month on record, as well as the longest streak >32.2°C+ days. The purpose of this research is, to outline the meteorological factors that came together to produce this unusual hot weather in Puerto Rico using the NCEO/NCAR reanalysis data as well as surface observations. The most important factors that contributed to the summer of 2012’s heat episode were a strong surface high-pressure area northeast of the local region that induced southeasterly winds and a broad mid to upper high pressure ridge extending from western Africa to the eastern Caribbean. These patterns have direct influence over temperature. Southeasterly winds tend to decrease minimum temperature in the north coast while maximum temperature increases in the same area. If these kinds of events become more prominent in the future, they may cause an imminent effect on society, human health, and the economy.
Keywords: Heat; Extreme events; Climate change; Puerto Rico
Climate variability is an important and emerging threat to public health; some of its effects are related to the reduction of the water quality and quantity, food security, control of infectious diseases, and protection from disasters [1]. With climate change and climate variability, extreme weather events such as droughts, hurricanes, and heat waves may also be increasing in frequency and intensity, representing a clear threat to human health [2-4]. According to the World Meteorological Organization [5], there is no universally acceptable definition for heat waves, yet they are understood to be episodes or periods of unusually hot dry or hot humid weather that have an insidious onset and cessation, duration of at least 2 to 3 days and an appreciable effect on human activities. During such periods of hot weather not only do daytime temperatures reach high values, but nocturnal temperatures and humidity levels may also rise well beyond their long-term means. In addition, heat waves are identified relative to a location’s climate; the same meteorological conditions can constitute a heat wave in one place, but not in another.
Temperatures within cities can reach stressful levels during extreme temperature events. Due to rapid urbanization, population growth and a growing elderly population, urban heat island effects have become more dangerous. Extreme events in urban and rural areas and heatrelated effects may have greater public health implications as climate change continues [6]. It is well known that heat waves can directly affect ecosystems by, for example, constraining carbon and nitrogen cycling and reducing water availability, with the result of potentially decreasing production or even causing species changes [7]. In temperate regions, heat waves have been well documented [3,8,9]. Nevertheless, there is little scientific evidence of extreme heat episodes effects in tropical islands. According to McMichael et al. [10], there was a relationship between daily temperature and mortality in middle- and low-income countries, and they reported that higher mortality was observed on very hot days in most of the cities. In this context, there exists scientific evidence that air surface temperature is increasing in Puerto Rico [1]. Moreover, in 2012 an anomalous hot weather pattern occurred in San Juan and numerous climate records were established during this period. June 2012 ended as the month with the most 32°C days and the driest June on record since 1956. These kinds of conditions led to us to analyze extreme temperatures events in San Juan. Therefore, the main purpose of this research is to outline the meteorological factors that combined to produce unusual extreme hot weather in Puerto Rico. We analyzed daily air surface temperature, the occurrence, intensity and frequency of extreme temperature events in San Juan metropolitan area, and their relationship with local climate variation between 1981 and 2013.
Study area
Puerto Rico lies between 17°55’N to 18° 31’N and 65°37’W latitude and 67°17’W longitude, measuring 180 km long and 65 km wide, with nearby smaller islands (8,897 km2) and variable topography. Easterly tropical winds prevail over the island during most of the year [11]. Weather patterns change slowly in the summer months compared to winter months. A typical summer weather pattern in Puerto Rico is characterized by trade winds blowing consistently from east-southeast at 8 to 17 knots range [12]. In a 3 to 5 day cycle, tropical disturbances pass near the island, causing changes in wind and precipitation patterns. In between these tropical disturbances, a dry and stable air mass with embedded Saharan dust particles is observed across the region. On normal days, local winds around Puerto Rico are influenced by the diurnal heating cycle, which often induces a sea breeze along the north, south, and west coastal sections. Afternoon convection develops over western Puerto Rico where the sea breeze converges. In the San Juan metro area, the primary environmental influences on daytime temperature variations are: the prevailing wind regime, the proximity to the ocean, sea breezes, and urban development. During very hot periods the breeze from the sea is delayed until at least early afternoon, and may not develop at all on some days. On those days coastal locations may experience higher temperatures than elsewhere.
Study area: general synoptic situation for the Caribbean and Puerto Rico: Northeast Caribbean region has a tropical climate. Temperature changes are relatively small compared with mid-latitudes. A maximum of easterly zonal wind (larger than 13 m/s) is observed in the lower troposphere of the Caribbean (about 925hPa) during the summer, called the Caribbean Low-Level Jet (CLLJ) [13,14]. Summer across the northeast Caribbean islands is characterized by the trade winds blowing consistently from east-southeast at a 10-20 mph range. The position and intensity of the Azores High Pressure over the north Atlantic determines the speed and direction of the trade winds across Puerto Rico (Figure 1). If trade winds are less than 20 mph, diurnal temperature difference between land and ocean generated sea breezes across the north, south and west coast of Puerto Rico. Sea breezes across the island focus the afternoon precipitation over portions of western Puerto Rico. In the San Juan metro area, daytime temperature variations depend greatly on the prevailing winds, the setup of the sea breeze and urban development [12]. Hot days during the summer in the San Juan Metro area are characterized by mostly sunny skies and southeasterly winds. On those days coastal locations along northern Puerto Rico may experience higher temperatures than elsewhere.
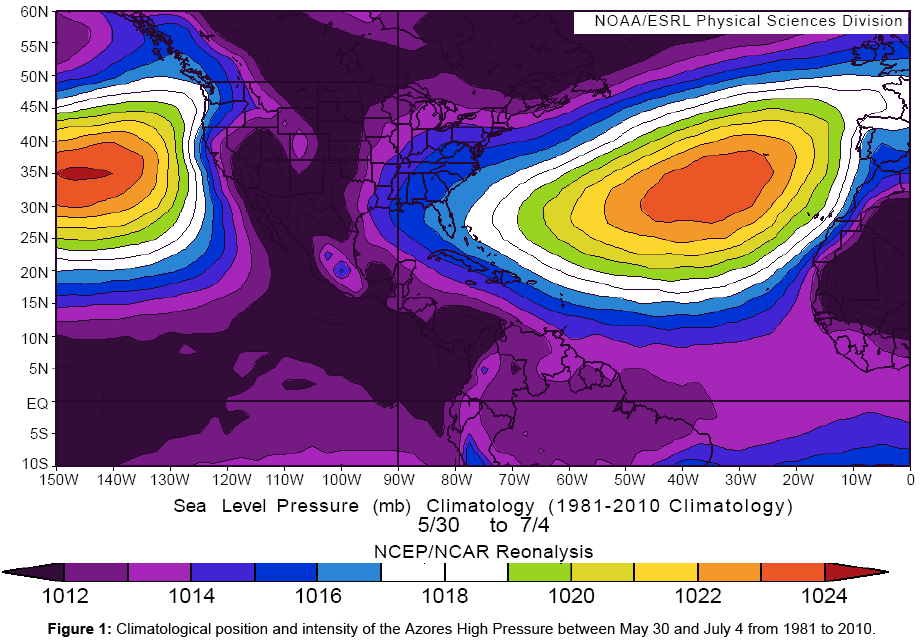
Figure 1: Climatological position and intensity of the Azores High Pressure between May 30 and July 4 from 1981 to 2010.
In 2007 Wang found that both the meridional gradients of sea surface temperature (SST) and sea level pressure (SLP) show a semiannual feature, consistent with the semi-annual variation of the Caribbean region is called the Caribbean Low-Level Jet (CLLJ). The CLLJ anomalies vary with sea level pressure (SLP) that is connected to the variation of the North Atlantic Subtropical High (NASH). In association with the cold (warm) Caribbean SST anomalies, the atmosphere shows the high (low) SLP anomalies near the Caribbean region that are consistent with the anomalously strong (weak) easterly CLLJ.
During the hurricane season months (June to November), easterly waves move across the eastern Caribbean affecting the typical trade wind pattern. These waves have a frequency of about 3 to 5 days. Usually between these tropical waves, a generally dry and stable air mass is observed across the region. The path of these waves is altered by the position of the Azores High Pressure. Typically the Azores High is centered between 25°N and 35°N in the east Atlantic Ocean [15]. The northward and southward movement and the intensity of this large anticyclone affect the track of the tropical waves and tropical cyclones during the hurricane season. Liu [16] found that when the Azores High is shifted southward of it climatological position, tropical cyclones tend to move across Caribbean. The hypothesis of Liu coincides with the Hurricane data [17] for the Atlantic basin where suggest that from June to first third of July tropical cyclones develops mainly over the Gulf of Mexico, Caribbean Sea and the Tropical Atlantic south of 15°N. As a result, trade wind pattern dominates the northeast Caribbean islands and it pattern is rarely altered by tropical waves, because they track mainly over the windward islands in June and the first third of July.
Air Surface Temperature (AST) is considered by most national and international organization as an essential climate variable [5,7]. The best available dataset from the National Climatic Data Center (NCDC) and the National Weather Service was selected for San Juan, Puerto Rico-Luis Muñoz Marin International Airport (LMMA). National Weather Service’s temperature sensors are mounted 2 meters +/- above the ground level and no closer than four times the height of any obstruction. These sensors are at least 30 meters away from any paved or concrete surface. Sensors are surrounded mainly by green areas. We used daily air surface temperature for 1981 to 2013.
The International Expert Team on Climate Change Detection and Indices (ETCCDI) recommend 27 indices for monitoring changes in extreme environmental conditions [18,19]. We derived five of the ETCCDI indices based on daily air surface temperature and estimated Heat Index (Table 1). Frequency of extreme occurrences was derived as maxima and percentiles [19]. Monthly and annual averages, amplitudes, and anomalies of these variables were also examined.
| ID | Indicator Name | Indicator dentitions | Units |
|---|---|---|---|
| TN10p | Cool nights | Percentage of time when daily min temperature <10th percentile | % |
| TX10p | Cool days | Percentage of time when daily max temperature <10th percentile | % |
| TN90p | Warm nights | Percentage of time when daily min temperature >90th Percentile | % |
| TX90p | Warm days | Percentage of time when daily max temperature >90th percentile | % |
| WSDI | Warm spell duration indicator | Annual count when at least six consecutivedays of maxtemperature >90th percentile | days |
Table 1: The Extreme Temperature Indices. Source International Expert Team on Climate Change Detection and Indices (ETCCDI).
Another methodology was apply combining temperatures (max/ min). Categories for maximum/minimum air surface temperature were built based on the frequency and percent of occurrence [20] for each interval interconnection of two-way table for the entire 52-year period.
As it could be expected, warm episodes in Puerto Rico are very frequent during the summer, yet the occurrence of very warm conditions (hot weather) is not usual for San Juan. Based on data since 1981, people living in San Juan experience warm conditions (D2, E2) during the summer. In more than 75% of the analyzed data, maximum temperatures were ranging between 25-35°C and minimum temperatures were oscillating between 20-25°C (Table 2). These Categories (E2, D2) could be consider as the comfort temperature for San Juan (warm conditions). Very warm conditions (Category E1) for San Juan could be consider as maximum temperature ranging 30-35°C and minimum temperature >25°C (Table 2). Data indicate that these kinds of circumstances have occurred 14% of the time in the last 52 years. Yet, these very warm conditions are becoming more prominent and are occurring with more frequency in recent decades.
| Categories | Combinations | % Time of occurrence | |
|---|---|---|---|
| Temperatures ºC | |||
| Suffocating | F1 | Tmax>35, Tmin>25 | 0 |
| Very Warm (hot weather) | E1 | Tmax 30.1-35, Tmin>25 | 14 |
| Warm | D2 | Tmax 25.1-30, Tmin20-24.9 | 90 |
| E2 | Tmax 30.1-35, Tmin20-24.9 | ||
| Cool | C2 | Tmax20.1-25, Tmin20-24.9 | 3.3 |
| C3 | Tmax20.1-25, Tmin15-19.9 | ||
| D3 | Tmax 25.1-30, Tmin15-19.9 |
Table 2: Categories based on the frequency and occurrence between maximum air surface temperature and minimum air surface temperature; and percent of time. San Juan 1981-2013.
The E1 Category (Tmax 30.1-35º/Tmin>25º) usually occurred during summer months (with an average occurrence of 38% in summer time) mainly in August (Figure 2). Nevertheless, 82% of summer time in 2012 registered the E1 Category. As can be seen in the Figure 2, the occurrence of E1 Category (Very Warm) in summer is increasing.
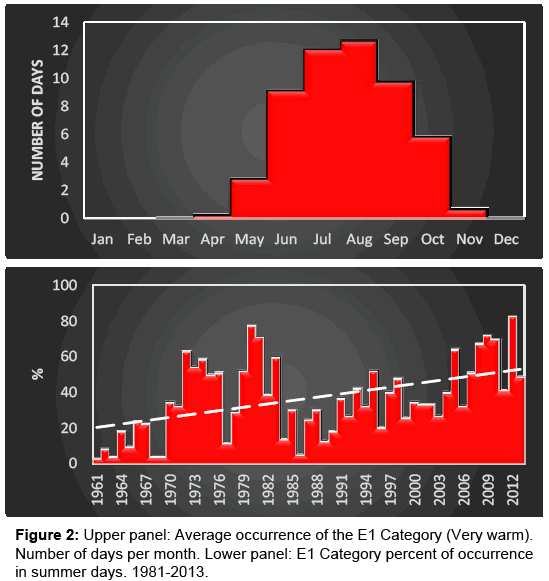
Figure 2: Upper panel: Average occurrence of the E1 Category (Very warm). Number of days per month. Lower panel: E1 Category percent of occurrence in summer days. 1981-2013.
Regarding the ETCCDI, a few extreme heat episodes have also been detected for 1983, 1995, 2012 and 2013 (Table 3). The threshold for air surface temperature extreme values has been identified as follow: TX90p (33.3°C), TX95p (33.9°C), TX99p (35.6°C), TN90p (25°C), TN95p (25.6°C), TN99p (26.2°C). In the summer of 1983, 16 days registered maximum air surface temperature >90th and 30 days in 1995. The summer of 2012 was the highest average maximum air surface temperatures. 2012 could be considered as one of the hottest summer registered in San Juan in the last century with 42 days exhibiting extreme values (Figure 3). Heat index (HI) extreme values reach 36.7ºC, 37.2ºF and 38.9°C during the summer (June, July and August). At the LMM, the number of days with HI above 36.7ºC was higher between 1990 and 1995 with a steady trend observed between 1996 and 2011. Since Relative Humidity varies in time and space, it has been very difficult establishing a clear trend regarding the Heat Index. A significant warming trend was perceived with annual maximum and minimum air surface temperatures since 1981 as well as with extreme values define by the above mentioned indices. The annual percentage of warm days and nights, analyzed through the TX90p and TN90p indices, has significantly increased. Our results are also consistent with trends observed over parts of northern South America and others Caribbean Island nations where temperature indices show the largest rates of warming [1,21].
| TX90p (33.3°C) | TX95p (33.9°C) | TX99p (35.6°C) | TN90p (25°C) | TN95p (25.6°C) | TN99p (26.2°C) | |
|---|---|---|---|---|---|---|
| 1981 | 8 | 2 | 0 | 26 | 9 | 2 |
| 1982 | 6 | 1 | 0 | 6 | 2 | 1 |
| 1983 | 16 | 12 | 3 | 20 | 7 | 3 |
| 1984 | 5 | 0 | 0 | 2 | 1 | 0 |
| 1985 | 6 | 3 | 0 | 7 | 1 | 0 |
| 1986 | 0 | 0 | 0 | 0 | 0 | 0 |
| 1987 | 1 | 0 | 0 | 4 | 0 | 0 |
| 1988 | 11 | 6 | 1 | 5 | 0 | 0 |
| 1989 | 0 | 0 | 0 | 0 | 0 | 0 |
| 1990 | 4 | 1 | 0 | 2 | 1 | 0 |
| 1991 | 14 | 8 | 0 | 7 | 3 | 1 |
| 1992 | 5 | 2 | 0 | 0 | 0 | 0 |
| 1993 | 11 | 6 | 0 | 11 | 4 | 1 |
| 1994 | 6 | 1 | 0 | 6 | 4 | 0 |
| 1995 | 30 | 17 | 0 | 15 | 5 | 4 |
| 1996 | 2 | 0 | 0 | 1 | 0 | 0 |
| 1997 | 5 | 2 | 0 | 1 | 0 | 0 |
| 1998 | 4 | 2 | 0 | 5 | 2 | 0 |
| 1999 | 2 | 2 | 0 | 0 | 0 | 0 |
| 2000 | 1 | 0 | 0 | 2 | 0 | 0 |
| 2001 | 3 | 2 | 0 | 0 | 0 | 0 |
| 2002 | 6 | 0 | 0 | 0 | 0 | 0 |
| 2003 | 0 | 0 | 0 | 0 | 0 | 0 |
| 2004 | 6 | 1 | 0 | 0 | 0 | 0 |
| 2005 | 13 | 7 | 0 | 3 | 3 | 0 |
| 2006 | 7 | 5 | 0 | 1 | 1 | 0 |
| 2007 | 16 | 7 | 0 | 0 | 0 | 0 |
| 2008 | 8 | 5 | 1 | 5 | 5 | 2 |
| 2009 | 10 | 6 | 1 | 13 | 13 | 1 |
| 2010 | 7 | 4 | 0 | 8 | 8 | 0 |
| 2011 | 9 | 2 | 0 | 9 | 3 | 3 |
| 2012 | 42 | 19 | 3 | 43 | 2 | 2 |
| 2013 | 30 | 14 | 3 | 18 | 4 | 4 |
Table 3: Extreme temperature indices. Bold numbers: The maximum number of days above a specific threshold by decades.
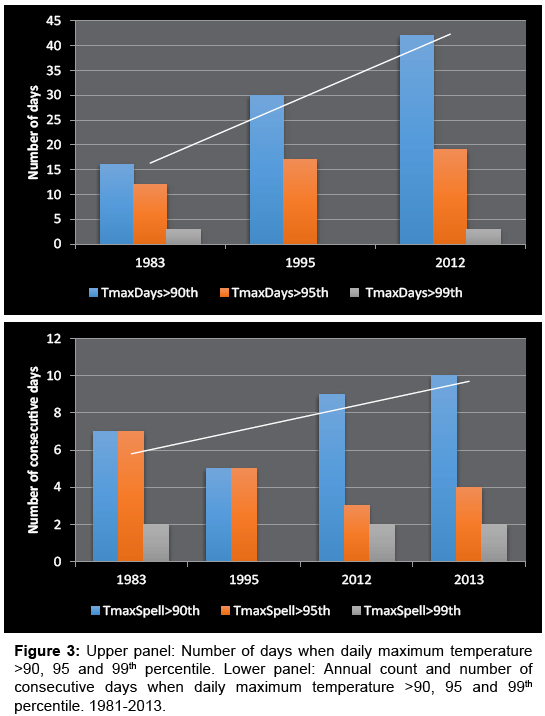
Figure 3: Upper panel: Number of days when daily maximum temperature >90, 95 and 99th percentile. Lower panel: Annual count and number of consecutive days when daily maximum temperature >90, 95 and 99th percentile. 1981-2013.
The 42 days (From May 15, 2012 through August 15, 2012) comprising the longest heat episode registered until today in San Juan, can be explained in part by prevailing winds, which vary depending on local and regional atmospheric characteristics. At some point, in extreme conditions, wind direction change from north to south (0°- 180°) clockwise. During the heat episode of summer 2012, prevailing wind direction was mainly from 115º (ESE) and at an average speed of 13 knots. Wind direction and wind speed significantly correlated with Maximum and Minimum Temperature throughout the island and wind could be partly responsible for heat episodes in the summer of 2012. Winds ranging 115º ESE to 150º SSE have a special effect on warms days over the north part of the island. Specifically when wind direction is over 100°(115° to 150°), minimum temperature in the north coast of the island tend to decrease more than usual and the temperature registered values below Daily Normal.
A statistically significant correlation was found between wind directions and maximum air surface temperature (r=0.38) in the north side of Puerto Rico. As wind direction begins to blow from the south, south-east, maximum temperatures increase in the north coast of Puerto Rico due a dry and down-slope wind experience over the leeward side of the island. In contrast, when wind blows from the northeast, the onshore flow increases the humidity and decrease the temperature over the windward side (north coast) of the island. On the other hand, the Foehn wind (down-slope wind) occurred in the leeward side (south coast). Therefore, suddenly changes in wind direction can significantly change the temperature pattern. It is also worth mentioning that northerly winds are associated with higher minimum temperatures in the north coast. This could be better explained in part because of the higher moisture content in these air masses.
The local climate conditions experience at the Luis Muñoz Marin International Airport in San Juan can be explained in part using the NOAA-Reanalysis Climate Composite Means from the Earth System Research Laboratory (Figure 4). The Composite Means show the average of the Sea Level Pressure during JJA (June, July and August) for 1983, 1995, 2012 and 2013. In all Composites the wind direction is maintained from the southeast (SE) with very little differences between years (Figure 4). As can be seen in Figure 4, the mean wind direction was from the southeast (SE) with very little differences between years. The synoptic situation in 1983 was very similar to the climatology except that the center of the high pressure has shifted more to the south and the high pressure penetrates the US Southeast Region. Composite mean of 1995, shows a significant change in the weather. The center of High Pressure is weaker (1022 mb), elongated and did not penetrate toward the West, causing a period of 30 days of temperatures above normal. Composite mean of 2012 is very similar to 1995, but more intense. A portion of cold air (high pressure) penetrates on the Lesser Antilles, causing winds from the southeast, and as a result higher temperatures on the north side of the Island and in San Juan Metropolitan Area with very low probability of precipitation. Because of this situation, 9 consecutive days registered temperatures >33.3°C. In the Composite mean of 2013, the synoptic situation covers the entire island but the center more elongated toward the southwest. The temperature above normal had a period of 30 days, 24 of which were records of the temperatures and 10 consecutive. There is no doubt that the Synoptic Situation has a great influence in local climate conditions in San Juan. Clearly, the south and southeast winds keeps the north coast of Puerto Rico under a dry and hot down-slope wind.
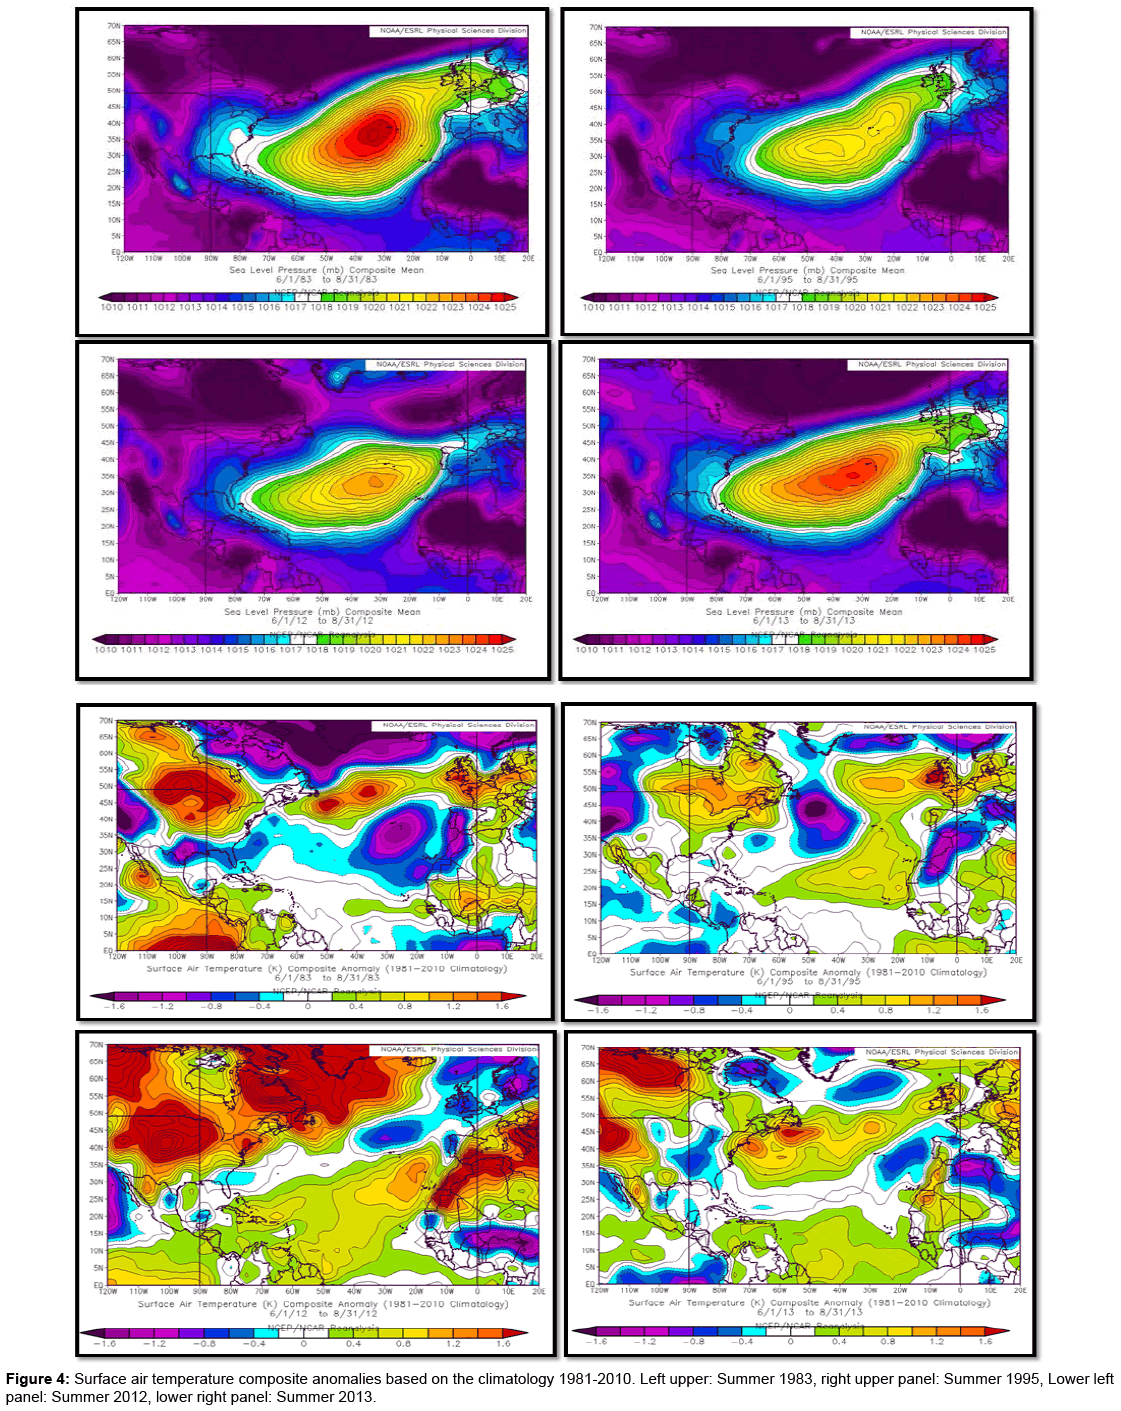
Figure 4: Surface air temperature composite anomalies based on the climatology 1981-2010. Left upper: Summer 1983, right upper panel: Summer 1995, Lower left panel: Summer 2012, lower right panel: Summer 2013.
Puerto Rico’s population has been falling for nearly a decade, and the pace of decline has accelerated in recent years [22]. On the other hand, since 1980 energy demand has been increasing until the beginning of the new millennium (Figure 5) when energy consumption in San Juan began to fall. In warm weather, energy is needed to cool buildings and interior environments yet; Climate Change and variability could affect the need for cooling. Energy demand in Puerto Rico correlate well with seasonal air surface temperature (Figure 5).
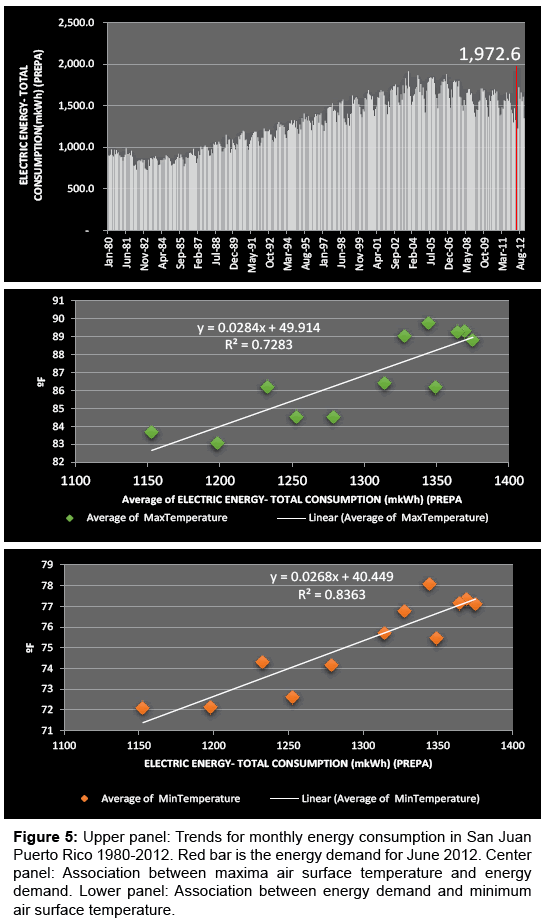
Figure 5: Upper panel: Trends for monthly energy consumption in San Juan Puerto Rico 1980-2012. Red bar is the energy demand for June 2012. Center panel: Association between maxima air surface temperature and energy demand. Lower panel: Association between energy demand and minimum air surface temperature.
After 2005, energy demand in San Juan began to decrease due to various socio-economic factors such as the loss of population, loss of commerce and industries. As air surface temperature increase rapidly in the island and extreme temperature occurs more frequent, the consequential increase in cooling and electricity demand occurs. The heat episode recorded in the summer of 2012 not only registered a new climate record for Puerto Rico, but it marked a new record for energy consumption and demand (June 2012). That summer was also the highest energy consumption ever registered in San Juan (Figure 5). Therefore, is our best understanding that this research could encourage new strategies for the Puerto Rico Energy Authority as Puerto Rico continue to warm, since this would result in a shift towards more electrical demand and could have important implications for the nationwide energy and environmental policy for the built environment [23].
Heat impacts are determined not only by the magnitude of warming but also by organisms’ physiological sensitivity to that warming and by their ability to compensate behaviorally and physiologically [7]. According with previous studies, population’s sensitivity to high temperatures varies (by activity, age, health conditions, exposure, among other considerations), and thus the threshold temperature for activating warning systems and deploying resources for interventions should be considering the population particularities [24]. Therefore, further research including heat-related risk and vulnerability related to demographic, social, and economic characteristics will be done since it has been well documented all around the world that extreme heat episodes are resulting in increased mortality and morbidity, particularly among the elderly, young children, people with chronic illnesses, and in socially and economically disadvantaged groups [3,25,26].
There is no doubt that Puerto Rico is warming up and extreme heat events in San Juan are increasing in both intensity and frequency. Extremes temperature can contribute to social and ecological effects. Furthermore, this effort is a first attempt to characterize prolonged heat episodes in a tropical island. Even though it is difficult to create a uniform definition for heat episodes because regional variability and conditions play an important part in determining heat-related effects, it can be recognized that temperatures in San Juan in the summer of 1983, 1995 and 2012 were very unusual. The most important factors that contributed to the heat episodes were strong surface high-pressure area northeast of the local region that induced southeasterly winds and a broad mid to upper high pressure ridge extending from western Africa to the eastern Caribbean. This research is a beginning of other studies focusing on the potential impact of climate extreme events in outdoor urban environments in order to design guidelines and policies on how to maintain health and thermal comfort under new climate scenarios and extreme events in a tropical city. Understanding the functionality, occurrence and climatic conditions that contribute to extreme heat episodes can help to improve adaptation strategies, the development of an early warning system and to mitigate possible future effects on ecology and society.
