Research Article - (2014) Volume 2, Issue 1
Keywords: Climate change; Precipitation; Extreme Rainfall; Temperature; Intensity
Location and physical geography of district
Gorakhpur is one the most populated districts of Eastern Uttar Pradesh situated. It is situated between 26°13′N and 27°29′N latitude and 83°05′E and 83°56′E longitude having long stretches of fertile alluvial plains split apart by perennial flow of gangetic1 river system. District Gorakhpur shares common boundary with district Azamgarh on south, Basti on west and district Deoria on east. It shares international border with Nepal on north (Figure 1).
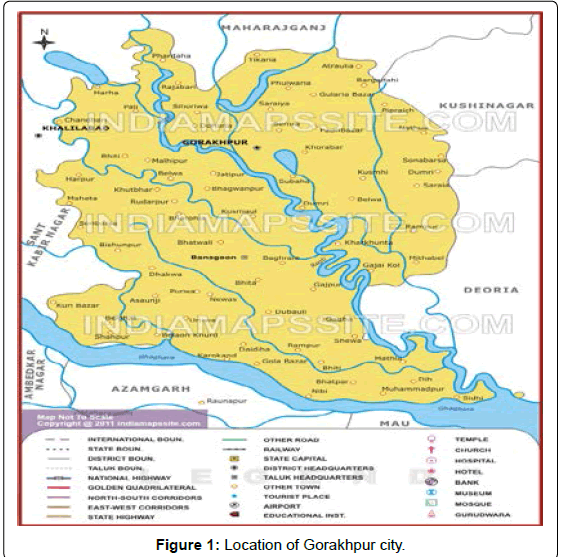
Figure 1: Location of Gorakhpur city.
Perched close to Himalayan mountain range2 and 1.65 per cent land under forest cover3, beside large number of lakes and water bodies, Gorakhpurdistrict finds itself nestled in unique microcosm of ecosystem. Three major seasons relay in succession of each other render range to agro-climatic conditions and to agriculture production and food economy4 of country (Figure 2).
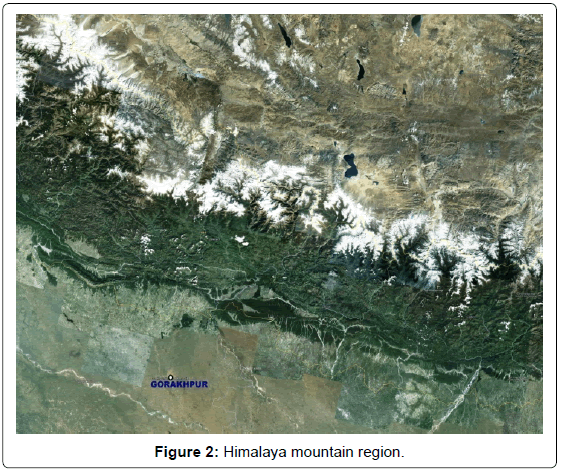
Figure 2: Himalaya mountain region.
District finds itself nestled in unique microcosm of ecosystem. Three major seasons relay in succession of each other render range to agro-climatic conditions and to agriculture production and food economy5 of country.
Gorakhpur city
Gorakhpur is head quarter of district and is also main center of commerce and trade in district. Population of Gorakhpur city is 692,5196 and is rapidly increasing. Percentage of urban population to total population of district is 18.787 and changing fast with large floating population come and go every day in search of job in city. Pace of urbanization is fast eroding natural ecosystem in peri-urban areas and wetland8 within city. It exacerbates micro-climate of city/region due to heat-island, increasing aerosol and changes in natural drainage line of river.
Gorakhpur city is situated 78 meter above mean sea level, which is not very high from level of river bed. It does not allow low lying areas of city to drain properly, causing water to stand for 2-3 months in a year.
Location, physical geography of district, perennial flow of river systems, plentiful of forest cover, low relief and large number of water bodies render a unique micro-climate to city. Rapid pace of urban expansion however is gradually rasping natural ecosystem around city by either filling low-lying areas with solid waste or building constructions on it. It perhaps is giving birth to some new ecosystem and building climate risks in city (Figure 3).
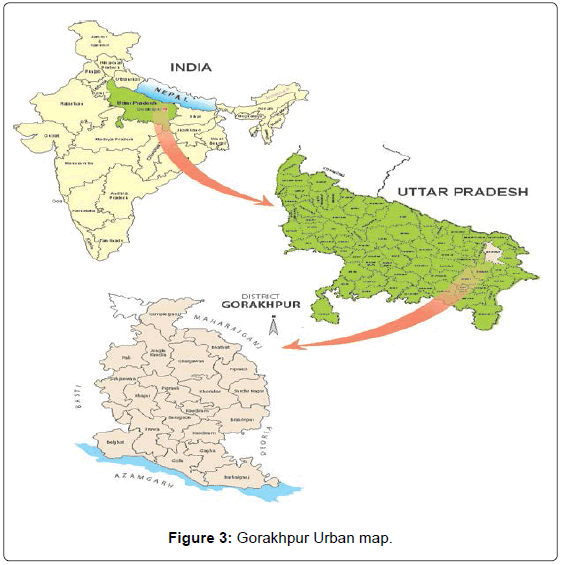
Figure 3: Gorakhpur Urban map.
Gorakhpur is fortunate to enjoy the heavy rainfall spells in the monsoon season due to tropical weather system. The summer monsoon season (June-Sep) is the main rainy season contributing 72-78% of the annual rainfall. Although, the contribution from other seasons, viz. the winter and pre-monsoon season and the post-monsoon season rainfall are not very significant, they are quite important for the other crops also. Main weather systems which bring rainfall to the region are monsoon low pressure area, depressions, thunderstorms, western disturbances etc. The orography of this place also influences the intensity and distribution of rainfall [1].
In view of the paramount importance of the rainfall from economic, societal and scientific points, extensive work has been carried out over the years on its various facets like trends, disaster events, spatio temporal variability, seasonal contribution etc. Goswami et al. [2] used grid point data at 100 km resolution [3] and demonstrated a significant increasing trend in the frequency and the magnitude extreme monsoon rain events in central north east India over the past 50 years. The information of the peak rainfall intensities at the station is instrumental for the planning of urban development, disaster management and for the study the environmental aspects pertaining to water runoffs in the vicinity of station. Therefore, present analysis is carried out using the station data and all the seasons are considered.
Criterion for Extreme Point Rainfall Event
The rainfall of 100 mm/day may be an extreme for the Gorakhpur region whereas it may not be a significant amount for the northeast region or along the west coast of India during summer monsoon. Even in summer monsoon season, west coast of India gets heavy rainfall spells in the first fortnight of June while the northern part of the country is devoid of the rainfall. Therefore for this write up the magnitude of extreme point rainfall event is taken as a fixed threshold for this place. Considering the climatological data, the magnitude of the extreme point rainfall event at the station is defined as its highest 24-hour rainfall reported in a particular month during the entire period of the data availability. This definition is adopted in order to examine whether there was any change in the number and intensity of the extreme point rainfall event in the recent decades.
Data and Methodology
Gorakhpur station data availability of at least 43 years up to June 2013 is considered. Only the cases with the minimum rainfall of 100 mm/day aretaken into account to give weightage to the high rainfall values.
The instances of Extreme Point Rainfall Events at the station are classified chronologically according to the decades. The high rainfall events occurred at the station after 1980 are compared with those of the earlier period to assess whether the previous Extreme Point Rainfall Events are exceeded in recent decades. Subsequently, the extreme rainfall events occurred on different time scales are also discussed in this paper.
In order to compare the extreme point rainfall events in different periods. Four time slots are considered i.e. I. Period up to 1980, II. (1981-1990), III. (1991-2000), IV. (2001 to June 2013). Accordingly the outcome of the analysis is briefly presented below.
Period up to 1980
The magnitude of extreme point rainfall events recorded at the station, the dates of occurrence of these events and the data length of the station is shown in Table 1. The bold digits in the Table 1 indicate that the rainfall was the highest for all the month (all time record) In case the station has registered extreme point rainfall events for more than one month; only a case with the maximum rainfall is taken into account (Figure 4).
| Date | Rainfall in mm | Data Length |
|---|---|---|
| 16-6-70 | 126.8 | 43 year |
| 19-8-71 | 85 | |
| 25-8-72 | 104.4 | |
| 11.8.73 | 67.8 | |
| 28.6.74 | 54 | |
| 19.7.75 | 66.5 | |
| 14.9.76 | 45.8 | |
| 11.8.77 | 76.1 | |
| 18.7.78 | 123.8 | |
| 15.7.79 | 85.1 | |
| 08.6.80 | 175.8 |
Table 1: Period- (1970-1980).
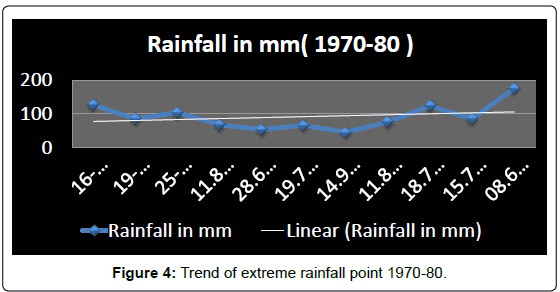
Figure 4: Trend of extreme rainfall point 1970-80.
Period: 1981-1990
High rainfall instances reported during 1981-90 is shown in Table 2. Bold digits indicate the rainfall more than 250 mm. Some notable instance is given below.
| Date | Rainfall in mm |
|---|---|
| 31.7.81 | 108 |
| 05.6.82 | 131.1 |
| 19.7.83 | 90.5 |
| 09.6.84 | 259 |
| 16.9.85 | 137.6 |
| 30.9.86 | 84.2 |
| 11.8.87 | 175.9 |
| 16.8.88 | 86.4 |
| 11.7.89 | 147.4 |
| 12.8.90 | 67.1 |
Table 2: Period- (1981-1990).
Gorakhpur recorded extremely heavy rainfall of 259 mm on 09 June 1984 which was highest in 72 years. It was due to intense thundershowers activity (Figure 5).
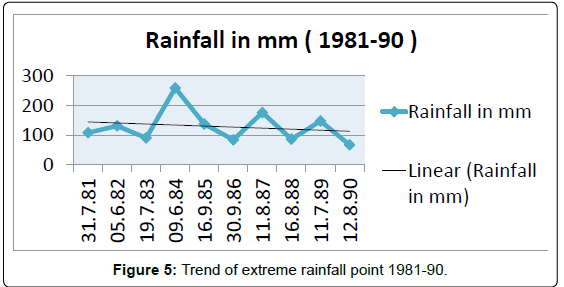
Figure 5: Trend of extreme rainfall point 1981-90.
Period: 1991-2000
An extreme point rainfall event for this period is depicted in Table 3. A typical case is highlighted below.
| Date | Rainfall in mm |
|---|---|
| 01.7.91 | 93.5 |
| 13.7.92 | 75.1 |
| 25.8.93 | 107.7 |
| 23.7.94 | 75.5 |
| 17.7.95 | 86 |
| 12.8.96 | 82.5 |
| 12.9.97 | 74 |
| 09.7.98 | 200 |
| 17.8.99 | 68.9 |
| 07.8.2000 | 124 |
Table 3: Period- (1991-2000).
Gorakhpur experienced very heavy rainfall of 200 mm on 09 July 1998. It was associated with passage of depression over east U.P. embedded with monsoon circulation (Figure 6).
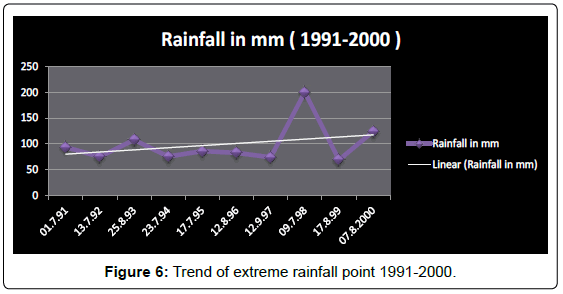
Figure 6: Trend of extreme rainfall point 1991-2000.
Period: 2001-2013
An extreme point rainfall event for this period is depicted in Table 4. A typical case is highlighted below.
| Date | Rainfall in mm |
|---|---|
| 22.8.2001 | 158 |
| 04.7.2002 | 40 |
| 19.8.2003 | 63.5 |
| 28.8.2004 | 218 |
| 15.8.2005 | 91 |
| 27.8.2006 | 85.1 |
| 14.8.2007 | 74.4 |
| 13.7.2008 | 128 |
| 05.7.2009 | 129 |
| 12.7.2010 | 189 |
| 03.7.2011 | 132.09 |
| 17.9.2012 | 110.6 |
| 29.6.2013 | 342.9 |
Table 4: Period- (2001-June 2013).
Gorakhpur recorded 342.9 mm rainfall on 29 June 2013 crossing its previous all-time highest of 284.5 mm reported on 19 August 1912. City was hit miserably due to unprecedented deluge. It was mainly due to passage of low pressure area over east U.P. and embedded with monsoon circulation and monsoon trough was very close and north of Gorakhpur (Figure 7).
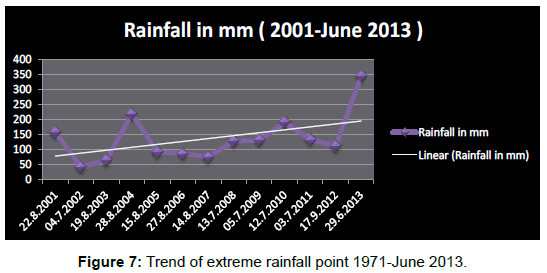
Figure 7: Trend of extreme rainfall point 1971-June 2013.
Rainfall events exceeding 100 mm/day
Gorakhpur station which reported the rainfall 100 mm per day has been identified 21 times during (1970-June 2013).
Surpassing of all-time records
Gorakhpur station recorded 342.9 mm rainfall on 29 June 2013. It was the record as the highest 24 hrs. Rainfall over this place during last 113 years and surpassed the all-time record of 284.5 mm on 19 Aug 1912. It is further noticed that four of top seven rain events have occurred after 2000 (Table 4) indicating the rise in intensity of extreme point rainfall events in the recent times.
High rainfall spells on different time scales
The cases of extreme rain events for 24 hrs. are described above. There are some instances of very high rainfall reported from 1970 on different time scales. They are described below.
Short duration record rainfall: On 09 July 1998 Gorakhpur station recorded 80 mm rainfall in one hour exceeding the previous record 73.0 mm (01 hour) held earlier on 11 August 1972.
Unseasonal heavy rainfall instances: Gorakhpur station reported 96.9 mm rainfall on 06 Oct 1970 getting more than 100 mm in same month i.e. 106.7 mm on 19 Oct 1987. It is an event of the four decade for the city. However, it was a curse to the city as it was harvesting season of kharif crops.
Rainiest year of Gorakhpur: On considering the data of 100 year (1901-2000). Annual mean rainfall of this place is 1238.9 mm. the two rainiest years over this place during last 112 year was 1989 and 2008 with actual recorded rainfall 2087 mm and 1991 mm respectively.
Rise in number and intensity of extreme point rainfall events in recent decades
The results figure out is that the majority (70-80%) have registered their extreme point rainfall events during 1981-90 and 2001-June 2013. During the 2001-June 2013 station reported the rainfall events surpassing the intensity of their previous highest rainfall. Some records were established on different time scales varying from hourly to annual scales with the most of them noticed from 2000. The stations have experienced an alarming rise (40-50 %) in their intensity.
Possible cause of rise in extreme point rainfall events and their intensity in recent decades
It is well established fact that the global average surface temperature has increased during last 150 years and eleven years of the recent time (1995-2006) were among the warmest years. The global land surface has warmed at the rate of 0.07°C per decade during the past century [4]. From the late 1950s the rise is noticed in the lowest 8 km of the atmosphere. The details are available in the third assessment report [5] of the Intergovernmental Panel on Climate Change ( IPCC ).
The study over this place indicates that mean maximum temperature of Gorakhpur has increased by 0.88°C for the period (1901-2010). Whereas mean minimum temperature has decreased insignificantly. Changes in maximum and minimum temperature are more significant in post 1960 period. Rate of decrease in mean minimum temperature is not commensurate with increase in mean maximum temperature. It leads to overall warming of atmosphere [6].
The sea surface temperature of the oceanic region around India has also gone up by 0.6°C in 100 years and by about 0.15°C per decade from 1971 [7,8].
The rise in sea surface temperature more evaporation and the increase in the surface air temperature lead to deeper convection. Besides the warming of upper levels enhances the moisture holding capacity of the atmosphere. As such under this scenario, the weather systems like thunderstorms, the depressions etc., would have more potential for intense precipitation as compared to the cooler environment. Therefore, it is conjectured that the accelerated warming during last three decades and the warmest period of recent 11 years, could be the major cause for the increase in the extreme rainfall spells during past four decades with the sharp rise their intensity after the mid-1990s.
Although, the climate models have certain uncertainties and the atmospheric process are not well understood, it may be mentioned that some model projections show that current rise in incidence of hot summers is likely to continue in the northern hemisphere [4]. During next two decades, warming about 010-0.2°C per decade is expected to take place due to greenhouse gases emissions [5]. The extremes in the temperature [9] and the intensity of heavy rainfall events may increase in the future over the India region. In the light of this analysis, under climate change scenario, it is quite likely that the steep rise in the instances of extreme point rainfall events may continue in coming decades.
This analysis over the station Gorakhpur with a long data series shows that majority of them have reported their highest 24 hours rainfall during (2001-June 2013) with an alarming rise in intensity thereafter. Record rainfall events on different time scales (hourly to annual) have also taken place in recent decades. The instances of extreme point rainfall events have affected this place. These events may be associated with and regional warming signaling the effect of the climate changes over the region. Therefore if the trend of global warming continues, the extreme point rainfall events also may continue to occur in the future. They would pose serious problems in some parts of the district due to their adverse impact on socio economic issues like damage of property, infrastructure and life. Such spells may cause river silting in rapti and Rohini River as it originates from hills of Nepal. In view of these points it is imperative that proper care need to be exercised in near future for the work of planning, disasters management and the environmental protection for the sustainable development of the human beings over this region.
Author is grateful to the Rockefeller Foundation for the support to carry out this study. Thanks are also due to our president Dr. Shiraz AWajih G.E.A.G. for his regular encouragement and valuable support during the entire study. I would like to thanks to S.K. Nateshan for a critically reviewing of the manuscript and offering valuable comments.
