Research Article - (2018) Volume 6, Issue 4
Received Date: Nov 01, 2018 / Accepted Date: Dec 28, 2018 / Published Date: Dec 31, 2018
Detailed geological mapping incorporated with interpreted aeromagnetic data of the Igbara-Oke and Owena area of south-western Nigeria provides a new insight into the lithology and structures in the area. The interpreted, derivatives maps such as Total Horizontal Derivatives (THD), Second Vertical Derivative (SVD), Regional Magnetic Anomaly (RMA) were analyzed for lithology delineation. For structural delineation, 3D Euler deconvolution, Source Edge Detector (SED) and some derivative maps were used to highlight the various structures with their depths. Combination of information from field investigation and aeromagnetic data analyses revealed four main lithology contrary to a single lithology that is indicated in the regional geological map. Aeromagnetic data of the area has proved very useful in delineating geological contacts especially in inaccessible parts, such as the Ikeji Forest Reserve and places with limited outcrop exposures such as the swampy areas around Odunwo and Aba Sokoto.
Keywords: Aeromagnetic; Second vertical derivative; Source edge detector; Total horizontal derivative
Geological mapping is a primary component of producing geological maps. In order to present a detailed geology of an area there is need to have a coherent framework of the lithology, structure, alteration, metamorphism and deformation that exist in the study area. Mapping of available outcrops in a terrain remains one of the essential ways of achieving this. However, in areas where the outcrop exposures are sparse, geological investigation could be enhanced with the use of both remote sensing and geophysical data. The study area forms part of the Basement Complex of Nigeria in south-western region Igbara Oke area, the area has been mapped on a regional scale by some past workers. The only notable rock identified by these workers is Migmatite. This might be due to inaccessibility of most of the outcrops for example; the south-eastern part of the area is a swamp. However, in order to get the geologic information of the inaccessible area, aeromagnetic data was utilized. Since the development of geophysical method, mapping procedures have undergone continuous change. The geophysical method gives a regional and integrated perspective of inter-relations between various land features and structures [1]. Geophysical methods have been used extensively to complement geologic mapping in areas with sparse outcrop and in inaccessible areas. Adelusi utilized the integration of aeromagnetic, ground magnetic and vertical electrical sounding methods to delineates fracture zone around Iwaraja area [2]. Ako used the Euler deconvolution of the analytical signal of the magnetic field data over the iron ore deposit [3]. Result from this interpretation has enabled rapid determination of the location, depths of the deposit and other geologic sources in the area without prior knowledge of the source geometry and magnetization direction. Amigun and Adelusi carried out ground magnetic mapping of subsurface structures beneath Obanla, Federal University of Technology Akure, and implication for hydrogeological study [4]. The result shows that the derivative maps and analytical signal map could be used to delineate fault and/or fracture zones and the rock type respectively.
The study area forms part of the crystalline rocks of the Basement Complex (Precambrian to lower Proterozoic in age) outcrop over a large area of Nigeria in three broad shields and are separated by Mesozoic and Cenozoic to recent sedimentary basins. Nigeria lies within the trans-Saharan mobile belt, which separates the West African Craton from the Congo Craton. This mobile belt was affected extensively by the Pan-African thermotectonic event of 550+-100Ma with little effects on the adjacent Craton [5]. However, relicts of rocks dated as far as Archean and lower Proterozoic ages are still recognized in the Nigeria basement complex.
The Nigeria basement complex rocks include migmatites-gneisses, schist, quartzites, amphibolites, charnockites, diorites assemblages and calc-silicates. These rocks are associated with intrusive phases of orogenic granites, aplites, pegmatites and diorites in several places [6]. The geologic setting of south-western part of Nigeria to be Precambrian basement complex, consisting of the migmatites-gneiss complex, basic schist and relict metasedimentary quartzites, calcerous and granitic rocks which have been strongly deformed. Such deformation couple with migmatisation processes tends to mix rocks of different ages and origin in such manner that lithologic boundaries are not easily discernible. Some authors believed that the relicts metasedimentary and basic rocks are those that have restricted migmatisation and granitisation processes McCurry suggested that some of the relict metasedimentary rocks may be lateral equivalents of the rocks making up the much older West African Craton. This implies that caution is required in separating those relict metasedimentary rocks from the more widespread lithologically similar but less migmatised to non-migmatised rocks. For example, Ajibade and Fitches , believe that there are two generation of metasedimentary rocks, one belonging to the older migmatites-gneiss complex e.g. the quartzites, schist, and amphibolites of Ibadan and Ilesha area and the other belonging to younger metasedimentary sequence consisting of Effon Psammite formation and the Igarra formation which are composed of quartzites-schist, calc-silicates rocks, metaconglomerates and marble [7].
The migmatites-gneiss being the oldest rock in this part of the country is both litho and tectonostatigraphically basal to all subsequent superjacent lithologies. The rocks in the migmatites-gneiss complex are considered to be the oldest member of the Precambrian basement complex and they evolved through successive stages of sedimentation, deformation, metamorphism and igneous intrusion over a vast period of geologic time [7]. The aeromagnetic data of Igbara Oke was obtained from NGSA (the data was acquired in 2008) the data was processed and interpreted. The magnetic data on the map were compiled from information obtained/recorded on flight lines along NNW-SSE at altitude of 35 meters.
The crystalline rocks of the Basement Complex (Precambrian to lower Proterozoic) outcrop over a large area of Nigeria in three broad shields and are separated by Mesozoic and Cenozoic to recent sedimentary basins. Nigeria lies within the trans-Saharan mobile belt which separates the West African Craton from the Congo Craton. This mobile belt was affected extensively by the Pan-African thermotectonic event of 550+- 100Ma with little effects on the adjacent Craton [5]. However, relicts of rocks dated as far as Archean and lower Proterozoic ages are still recognized in the Nigeria basement complex.
The Nigeria basement complex rocks include migmatites gneisses, schist, quartzites, amphibolites, charnockites, diorites assemblages and calc-silicates. These rocks are associated with intrusive phases of orogenic granites,aplites, pegmatites and diorites in several places [6]. Ajibade described the geologic setting of the south-western part of Nigeria to be Precambrian basement complex, consisting of the migmatites-gneiss complex, basic schist and relict metasedimentary quartzites, calcerous and granitic rocks which have been strongly deformed [7]. Such deformation couple with migmatites processes has tended to mix rocks of different ages and origin in such manner that lithologic boundaries are not easily discernible. Some authors believed that the relicts metasedimentary and basic rocks are those that have restricted migmatisation and granitisation processes. McCurry suggested that some of the relict metasedimentary rocks may be lateral equivalents of the rocks making up the much older West African Craton. This implies that caution is required in separating those relict metasedimentary rocks from the more widespread lithologically similar but less migmatised to non-migmatised rocks. For example, Ajibade and Fitches [7], believe that there are two generation of metasedimentary rocks, one belonging to the older migmatites-gneiss complex e.g. the quartzites, schist, and amphibolites of Ibadan and Ilesha area and the other belonging to younger metasedimentary sequence consisting of Effon Psammite formation and the Igarra formation which are composed of quartzites-schist, calc-silicates rocks, metaconglomerates and marble.
The migmatites-gneiss being the oldest rock in this part of the country is both litho and tectonostatigraphically basal to all subsequent superjacent lithologies [8]. The rocks in the migmatitesgneiss complex are considered to be the oldest member of the Precambrian basement complex and they evolved through successive stages of sedimentation, deformation, metamorphism and igneous intrusion over a vast period of geologic time.
The study area forms part of the Nigerian Basement Complex, with latitude 5°10’’,5°5’0’’E and longitude 7°24’0’’, 7°20’0’’ the area is a region with a maximum of 420 meters elevation. The total surface area of 16 km2. The area is highly vegetated and drained by several small rivers which are tributaries to the Owena River. The study area comprises of several villages like Alonge, Orisumbare, Adeyanju and Ladopo, and the major town is Owena and Igbara Oke (Figure 1).

Figure 1: Representative photomicrograph of histopathological features in pulmonary necropsies.
Local geology of study area
Igbara Oke and Owena area is underlain by Precambrian rocks typical of the Basement Complex of Nigeria which has experienced many Orogenic events (Figure 2). The main lithologic units in the study area include; migmatite, granite-gneiss, granites, and quartzite. These rocks have undergone polycyclic deformation thereby causing the deformation of both micro, meso and mega structures as displayed on the field (location 1). Geologic structures in rocks that can be used as clues in determining the geologic history of an area include fold, fractures, foliation, dyke, and xenolith. Although, older tectonic event such as the Liberian (2.8-2.2 Ga), the Eburnean (2.1-1.6 Ga), and possibly Kibaran (1.4-0.9 Ga) are preservedon the basement complex in Nigeria or we have imprint on the Basement Complex rock [9] and Pan African event (800-400 Ma).

Figure 2: Representative photomicrograph of histopathological features in pulmonary necropsies.
This research work was carried out in two stages;
Ground trothing
The ground truthing was carried out with the aim of having a physical contact with the rock in the study area and generates a detailed geologic map. which entails outcrop mapping from one point or location to another in area that are accessible. GPS, compass clinometer and topographic map of the study area was used for the mapping. Four major lithologic unit was observed which includes Quartzite, migmatite, granite-gneiss and granite, the contact not adequately mapped but inferred on the field (Figure 3).

Figure 3: Representative photomicrograph of histopathological features in pulmonary necropsies.
Aeromagnetic data analysis and interpretation
For better understanding of the lithology and structures in the area aeromagnetic method was also used. Magnetic method is more useful in;
• Inaccessible area e.g. the Ikeji forest reserve
• where the contact is not clearly define with geologic mapping
• Its show the variations in the magnetic susceptibility of rocks in the area and
• Where the outcrop were not well exposed
Data enhancement techniques
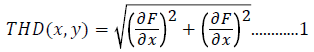
The basic concepts of the magnetic method have been adequately explained in many geophysics text books [10,11]. After carrying out all the relevant corrections on the collected data, the Residual Magnetic Anomaly (RMA) data were subjected to a suite of signal enhancement techniques including Total Horizontal Derivative (THD), Second Vertical Derivative (SVD) and 3-D standard Euler deconvolution technique. The theory and attributes of the different techniques used are briefly discussed in sections below. Total Horizontal Derivative (THD) Technique: The total horizontal derivative technique is the simplest approach to estimate contact locations of bodies at depths [12]. The biggest advantage of this method is its low sensitivity to noise in the data because it only requires calculations of the two first -order horizontal derivatives of the field [13]. If F is the potential field then the total horizontal derivative (THD) is given by:
This function gives a peak anomaly above the contacts for gravity and RTP magnetic anomalies.
However, in magnetic equatorial regions (such as the study area) where inclination is less than 15°, reduction to the pole RTP is generally unstable and cannot be easily derived. A similar effect is seen when a magnetic field is Reduced-to-Equator (RTE) instead of to the pole, or transformed to a pseudo gravity map. For these reasons, the THD technique was carried out on the RPGA as well as the RMA data. Crests in the horizontal gradient magnitude grid can be located by passing a small 3 by 3 window over the THD grid and searching for maxima [14].

Second vertical derivative (svd) technique
Second vertical derivatives are a measure of curvature, and large curvatures are associated with shallow anomalies. Second vertical derivatives enhance near surface effects at the expense of deeper anomalies. The second vertical derivative can be obtained from the horizontal derivatives (Equation 1) because the magnetic fields satisfy Laplace’s equation.
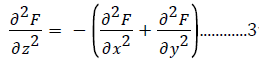 where, F is the potential field (magnetic) while x, y and z are the directions of differentiation. The quantities 0 mGal/m2 and 0 nT/m2 give the location of edges of geological features for gravity data and magnetic data (RTP or RTE) respectively.
3-D standard euler deconvolution technique
This technique provides automatic estimates of source location and depth. Therefore, Euler deconvolution is both a boundary finder and depth estimation technique. Euler deconvolution is commonly employed in potential field data interpretation because it requires only a little prior knowledge about the source geometry, and more importantly, it requires no information about the magnetization vector in the case of magnetics. The standard 3-D Euler deconvolution was used in this study and is based on solving Euler’s homogeneity equation [15].
Where the regional value of the potential field and (x 0, y 0, z 0) is the position of the source, which produces the total potential field T measured at (x, y, z). η is the so-called structural index. For each position of the moving window, an over-estimated system of linear equations is solved for the position and depth of the sources [15,16]. The most critical parameter in the Euler deconvolution is the structural index, η [16]. This is a homogeneity factor relating the potential field and its gradient components to the location of the source. By changing η, the geometry and depth of the potential field sources can be estimated. A poor choice of the structural index has been shown to cause a diffuse solution of source locations and serious biases in depth estimation [15,16].
2-D geological modeling of the subsurface
Two- dimensional (2-D) geologic models of the subsurface were produced with GM-SYS, a modeling package on Geosoft software, Oasis montaj TM Version 6.4.2. The method used for calculating the magnetic response is based on the methods of Talwani using the algorithms described in Wen and Bevis [17,18]. The Euler deconvolution preference over the profile techniques such that it requires no prior knowledge of the source magnetization direction [19]. This has prompted its application in this study for the determination of depths to magnetic sources and their locations.

Results and Interpretation
Ground truthing
The result of the field work clearly show four different rock types which are quartzite, migmatites, granite, and granite gneiss from which a geologic map was produced, during the field work, contact was not clearly define because they are deeply buried and some area are inaccessible. Below is the report of the field work based on observation made on outcrops in the area.
Granite-gneiss
This rock occurs as a small portion forming a prominent stock in Anigbogi SSW of the study area. The rock is heterogeneous, consisting of metamorphic and granitic portion with varying textural characteristics. The mineralogy of the outcrop is characterized by felsic minerals such as, quartz, and feldspar and also dark colored bands of minerals which are mostly biotite. The rock also displayed varieties of structural elements such as folds, intensely folded quartz-veins and foliations. The granite gneiss in Odunwo has experienced extreme weathering conditions (Figure 3). The granitic gneiss outcrop was seen in location 2, 4, 12, 14 and 15 respectively towards the SSE and SSW of the study area respectively.
Location 2: 07°21’26 46’’N, 005°1’48 06’’E
Elevation: 338 m
Description: majorly, boulders with little exposure the outcrop has been blasted which make the surface of the outcrop very fresh. It’s a low lying outcrop. The outcrop is having a 25 cm pegmatite containing large crystal of quartz and feldspar with orientation of 58°NE
Rock name: Granite Gneiss
Texture: Coarse grain
Colour: leucocratic Presence of light and dark minerals
Migmatite gneiss
This was found in Igbara-Oke, it occurs as a large stock in the area. Most of the mapped migmatite gneiss occurs as low-lying outcrop ranging in textural characteristics from medium to coarse-grained with mafic and felsic bands. There was clear evidence of flowing of the materials during metamorphism that affect the country rock and which causes folds. Structures like folds, granitization and veins were seen on the outcrop location 9 plate 4 an location 10, this gives evidence that it has undergone several episodes of deformation this gives an indication that the outcrops have undergone extreme regional metamorphism. Location 5, 7, 9, 10, 39, and location 46 respectively is all Migmatite outcrop which occur at the eastern part of the study area (Figures 4 and 5).

Figure 4: Representative photomicrograph of histopathological features in pulmonary necropsies.

Figure 5: Representative photomicrograph of histopathological features in pulmonary necropsies.
Location 3: 07°22’21.2’’N 005°02’36.3’’ E
Elevation: 355 m
Description: The outcrop is situated in the centre of Elemo village, a low lying outcrop,
Presence of quartzofeldspathic vein, Quartz vein orientation 220°SW, Presence of light and dark minerals (Figure 6).

Figure 6: Representative photomicrograph of histopathological features in pulmonary necropsies.
Colour: leucocratic
Rock name: Granite Gneiss
Texture: fine to medium grain
Mineralogy: Presence of quartz and feldspar and biotite
Quartzite ridge
This was found along Owenna dam before Sokoto Village in location 1, the major outcrops occur as high ridges with elevations as high as 422 m majority of the quartzite ridge are highly vegetated and weathered which made it difficult to acquire any measurement in some areas it extends throughout the NW, W, SSW of the study area and also occur at the Ikeji Forest (Table 1).
Quartzites are found in location 1 and 3. The area is very swampy which indicates that the underlying rock is impermeable (Figures 7 and 8).

Figure 7: Representative photomicrograph of histopathological features in pulmonary necropsies.

Figure 8: Representative photomicrograph of histopathological features in pulmonary necropsies.
Location 1: 07° 21’16.5’’N, 05°01’30.9”E
Rock Type: Metamorphic, rock name; quartzite
Description: is a road cut exposure, along Owena dam partly weathered with the presence of intense folding, quartz veins, the structure in the area show that the rock are ductile in nature because they are highly folded with foliation trend of about 20°NS. Presence of fractures, the fold axis has been distorted due to shearing there is evidence of dragging (Figures 9 and 10).

Figure 9: Representative photomicrograph of histopathological features in pulmonary necropsies.

Figure 10: Representative photomicrograph of histopathological features in pulmonary necropsies.
Structures: There has been evidence of plastic deformation due to the presence of tight and isoclinal folds of unequal limbs
Colour: Reddish brown
Texture: Medium to coarse grain
Mineralogy: Presence of quartz, feldspar and mica
Magnetic method
Total magnetic intensity (TMI): The magnetic variation or susceptibility was analyzed using total magnetic intensity and residual maps, TMI revealed more detailed geologic features in particular the geometry and configuration of individual basement block (Figure 11). TMI also show larger scale geologic features such as basin shape or anomalous rock types deep within the basement. Total Magnetic Intensity (TMI) anomaly data after reduction to the magnetic equator is presented as color-shaded maps. The RMA reveal that the dominant magnetic anomaly trends are both aligned prominently in the E-W direction. These anomalies correspond respectively to magnetic susceptibility and density contrasts between the various lithology’s of the crystalline basement rocks in the study area. Areas of negative magnetic anomalies (corresponding at low magnetic latitudes to higher magnetic susceptibility), low magnetic relief zones are encapsulated by high magnetic relief zones on the RMA map. The magnetic intensity of the RMA field ranges from -91.1 nT to 74.7 nT. The bluesh area is having low susceptibility (where granite are observed) and pinkish region having the highest susceptibility.

Figure 11: Representative photomicrograph of histopathological features in pulmonary necropsies.
Total horizontal derivative (THD) map
The total horizontal derivatives shows the results of the technique applied to the RMA data are presented as colour-shaded relief maps. The THD results of the RMA give contact locations that are continuous, thin and curvilinear (Figure 12). The maps show major contacts in the NE-SW, N-W directions. The amplitudes of the gradient reach 0.1255 nT/m on the RMA THD map. The contacts correspond to geological contact zones with a moderate magnetic susceptibility difference on the RMA and THD.

Figure 12: Representative photomicrograph of histopathological features in pulmonary necropsies.
Second vertical derivative (SVD) map
The results of the second vertical derivative (SVD) analysis on the RMA data are presented as color-shaded relief maps overlain by the 0 nT/m2 contour lines. The SVD technique does not usually result in displaced contacts because it does not require the assumptions in the THD technique. As a result of this, the final location of contacts are estimated using the following considerations; where the THD contacts are isolated, the SVD contact location gives the best contact location. In a similar manner, where the THD contacts are either parallel to or slightly offset from the SVD contact location, the SVD contact gives the preferred contact location. The SVD maps of the RMA show similarities with its corresponding THD map and the locations of contacts are indicated by 0 nT/m2 contour lines on the RMA and SVD (Figures 13 and 14). It is observed that the contact locations on the SVD maps also show better continuity than those on the THD maps.

Figure 13: Representative photomicrograph of histopathological features in pulmonary necropsies.

Figure 14: Representative photomicrograph of histopathological features in pulmonary necropsies.
Euler deconvolution analysis
The result of the analysis of 3-D Euler Deconvolution for the RMA data is presented as a color-range symbol map in (Figure 15). The technique determines the anomaly position, depth, and base level for a specific magnetic source. Several structural index values were tried for the Euler analysis and it was observed that a structural index of N=0.5 representing a contact model, gave better clustering of the Euler solutions. The green and red points, which define solutions for depths that range from depths greater than 300 m respectively, show the same consistent trends for the lithological contacts mapped by the THD and SVD results.

Figure 15: Representative photomicrograph of histopathological features in pulmonary necropsies.
In the central region, further clusters of broken blue-colored points suggest the presence of some minor fracture. The uniform depth of solutions in the fracture zones suggests that there is no vertical displacement and that the faults are most probably strike slip in character (Figure 16).

Figure 16: Representative photomicrograph of histopathological features in pulmonary necropsies.
Figures 17-20 shows the lithology profile maps of some traverse of the study area.

Figure 17: Representative photomicrograph of histopathological features in pulmonary necropsies.

Figure 18: Representative photomicrograph of histopathological features in pulmonary necropsies.

Figure 19: Representative photomicrograph of histopathological features in pulmonary necropsies.

Figure 20: Representative photomicrograph of histopathological features in pulmonary necropsies.
Interpretation aeromagnetic maps
Interpretation methodology consists of visual inspection of computer screen and hard-copy images, maps of the aeromagnetic data, and other relevant data to define:
• boundaries of magnetic units
• structures dislocating or affecting the morphology of magnetic units
• depth and attitude of magnetic units
• any superposition of magnetic units
• lithological units
• chemical changes
As a general rule, boundaries are close to anomaly inflection points for sources with near vertical sides. An exception to this generalization occurs with narrow sources whose width is less than their depth. In such situations, magnetic survey data cannot resolve the thickness of the source, only the position of the axis of the source unless additional information is available from mapping or modelling studies using rock-property data (Figure 21).

Figure 21: Representative photomicrograph of histopathological features in pulmonary necropsies.
There are three types of source boundary
• When a large discrete isolated magnetic anomaly occurs, it can be regarded as the response of a uniformly magnetized source and its boundary is traced where the edge of the source is estimated to be
• For narrow anomalies, where the source thickness is less than the depth, the source can only be represented by a line
• In many situations, concentrations of organized, semi organized or random anomalies will occur which cover specific areas. Such anomalies can be due to:
- an assemblage of magnetic and non-magnetic units
-faulted magnetic rock units
- folded magnetic rock units
- irregular weathering of magnetic units, volcanic flows, where different flow portions have different magnetic properties, owing to variable chemical composition and cooling rate, and-combinations of the above
• A structural synthesis relating to distribution of inferred lithologies and structure
On the basis of the trends of the residual magnetic anomalies the total horizontal derivative maps of the study area the second vertical derivative maps of the study area the Euler map of the study area and the main lithologies , the study area is characterized by three main magnetic anomaly zones demarcated by four contacts locations and several faults and folds. The zone between contact 1 to the extreme NNW composed mainly of migmatite, between contact 1 and contact 2 compose of granite gneiss , while the zone between contact 2 and contact 3 compose of quartzite, South-East of contact) consists predominantly of granite which is responsible for the poor drainage system in the area because of the impermeability of the underlain rock. However, the granite- gneiss in the north-east of may not be as extensive as shown in the geological map. In a similar manner, the lithology contacts contact 1 and contact 2 derived from the magnetic map suggest that the quartzite is not as extensive as it is in. we have major two major contact i.e. contact 1 and contact 4 and the minor contact 1 and 3 which contact between unmappable granite which is at Igbara Oke and also another unmappale quartzites within granite gneiss and quartzites at the south-east of the study area.
Structurally, the structures are trending in north-east and southwest direction as the major fault, but on a small scale, the study has been deformed and thereby present fold structures as can be seen in location 1 where the quartzite has been folded and one limb of the fold has been dragged. The folds in the study area may also be extension of the Oke-Imesi fold.
The result of the detailed geologic mapping of the area has shown that more than one rock type is present in the region compare with the previous work, the rock present in the area according to the field mapping are four which include granite, migmatite, quartzite and granite gneiss. Magnetic investigation of the study area was also carried out with the aim of delineating the lithological units and the geologic structures in the area. Application of selected filtering methods to the magnetic data including reduction to the equator, horizontal and second vertical gradients, and Euler deconvolution show four broad zones of NE-SW trending positive and negative residual magnetic anomaly which could be roughly correlated with the lithology of the ground truthing. Positive magnetic residuals were associated with migmatite, while negative residuals were associated with granite and quartzite. The map of the study area clearly revealed six major folds based on this study, a new geologic map from ground truthing and magnetics i.e. aeromagnetics was generated to enhance the previous information and research that was carried out regionally. The study concluded that the magnetic character of the rock units in the study area are different for example the magnetic susceptibility of migmatites is higher than that of quartzites and granite.
