Commentary - (2014) Volume 2, Issue 2
Keywords: Watermelon; Rainfall; Moisture; Dry season; Wet season
Watermelon (Citrullus lanatus) belongs to the family Cucurbitaceae [1]. It is one of the most widely cultivated crops in the world with global production reaching about 89.9 million mega gramme [2]. Its centre of origin has been traced to both the Kalahari and Sahara deserts in Africa [3] and these areas have been regarded as point of diversification to other parts of the world [1]. The crop has a wide distribution as a garden crop, while as a commercial vegetable production; its cultivation is confined to the drier savanna region of the Nigeria [4]. It is a horticultural crop [5,6] that provides a high return and has relatively low water requirement compared to other crops [7]. It is a traditional food plant in Africa [8,9] with potential to improve nutrition, boost food security, foster rural development and support sustainable land cares [10,11]. Smallholder farmers in the semi-arid eastern Kenya grow watermelon, mostly under rain conditions and to a lesser extent supplemental furrow irrigation. However, the yields remain low mainly due to erratic rainfall. For example, in 2007 the yield was a paltry 1.66 mg/ ha [12] compared to the expected 25 to 35 mg/ha in commercial fields [13].
The growth and development of watermelon describes the sequential order of the different stages of growth attained by this crop. The growth phase of watermelon includes the emergence stage, vegetative stage, flowering stage, yield formation stage and the ripening stage. Growth can be measured as increase in length, width, volume, fresh or dry weight of a plant [14]. At each of these stages, the crop is seen or observed to increase in height and the leaves are also seen to be larger as they increase in area. Also, the roots start going deeper into the soil in order to get necessary nutrients for crop growth and also to hold the plant firmly to the soil.
However, crop growth and development depends largely on climatic factors such as precipitation, relative humidity, solar radiation, evaporation, etc. Each of these climatic factors affects the growth of crops, most especially in the tropics. For instance, the presence or absence of precipitation will have either positive or negative impact on the crop growth and productivity. Climate is also responsible for seasonal variation in the tropics, particularly in Nigeria. In Nigeria, it is mostly cultivated in the Northern part because it is a warm loving plant and this makes its production seasonal in the Southern part of the country [15]. The crop is affected by excess water especially in its least developmental stage [16]. The high demand of this vegetable fruit is not met in the Southern part of the Nigeria because this part has high rainfall covering many months of the year. The production of watermelon all year round in all parts of Nigeria is expected to improve nutrition, contribute to food security as well as increase revenue of the producers/farmers and create employment opportunities thereby improving on the efficiency of utilization of labor [17].
Nigeria, by virtue of its location, enjoys a warm tropical climate with relatively high temperatures throughout the year and two seasons – the rainy or wet season that lasts from mid- March – November in the South and from May to October in the north; and the dry season that occupies the rest of the year [18]. In the wet season, the full effect of the tropical maritime air mass is the main reason that brings rainfall, while in the dry season the rainfall is less. The total annual rainfall decreases from the south to the north. The southern two-thirds of the country have double peak rainfall while the northern third has a single peak. In view of all these, it could be clearly stated that seasonal variation will affect the growth and development of crops. This calls for the need to observe the difference between the r
The main aim of this research work was to observe how each season affects the growth and development of watermelon. The specific objectives are to; examine the variation in the growth and development of the plant between the two seasons, explain the likely climatic parameter causing the growth difference in each season by comparing the growth rate of the plant with climatic parameters and determine the best season to plant watermelon in this region
A field experiment was conducted at the farm of the Federal University of Agriculture Abeokuta (FUNAAB) to study the impact of seasonal variation on the growth and development of watermelon [19]. FUNAAB is situated on a land area of about 97 ha between longitude 3° 24¹ and 3° 26’, latitude 7° 13’ and 7° 14’. It is bounded in the South by Ogun Osun River Basin Development Authority (OORBDA) Headquarters in the West of Ogun River. The University is located in Abeokuta; the capital of Ogun State which is situated in the South- Western part of Nigeria which covers a geographical extent of about 150 square kilometers. To the West of the State is Republic of Benin, Lagos State lies on the South while Ondo State to the East and Oyo State to the North [20].
The study looked at the growth and development of watermelon in FUNAAB in South Western region of Nigeria. It observed the different types of seasons in the country and with that understanding; watermelon was planted to observe how each of the seasons affect the growth and development of watermelon. The study looked at the rainfall variation in each of the season and how it affected the growth of watermelon in each season Figure 1. It did not look at other factors such as temperature, relative humidity, solar radiation, amount of evaporation etc.
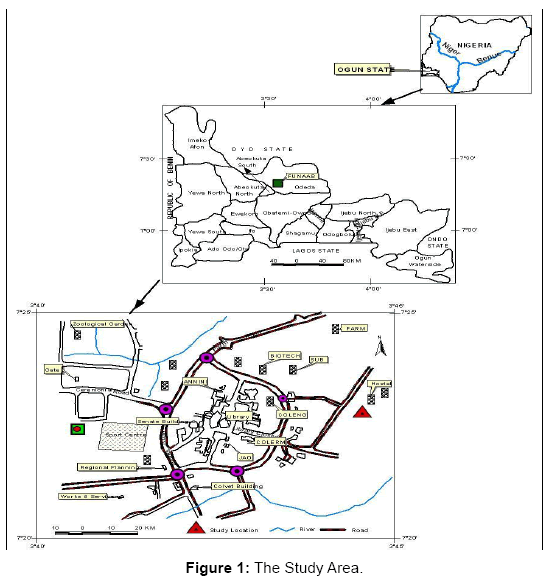
Figure 1: The Study Area.
The experiment was arranged randomly within the plot with three replicates. The field plot size is about 225 m² and each plot size was 9 m² with a 2.25 m² pathways across the field to easily differentiate between one field plots from the other. There were nine plots in the field, each of which, irrigation was applied at the same rate during the dry season and none was applied during the rainy season. This was done to observe the performance of watermelon in both dry and wet season.
Plant establishment
The experimental site was cleared and the residues were burnt as part of land preparation. The soil is sandy loam and small ridges were made for the cultivation of watermelon which makes it easier for the roots of watermelon to penetrate through the soil with ease and to obtain the necessary nutrients required at each growth phase.
Dry season planting
The dry season planting was carried out between 5th January and 16th March 2013 during which observation was made on the various stages of growth before the start of the rainy season. Seeds of watermelon (Citrullus lanatus) were sown using the direct seeding method (i.e. planted directly in the soil). Two to three seeds were sown per hole in the subplot after which thinning was practiced after 15-20 days in order to reduce competition for nutrients and other resources.
As part of post planting operation, weeding, mulching and spraying were also practiced. Though the study was carried out during the dry season period, weeding was still necessary as some unwanted plants were found to be growing around the region where water was applied. The weeding operation during the dry season was less frequent as the weeds were found to be growing side by side with watermelon plants. Thus, weeding was necessary to make room for the effective growth of the seed planted. Mulching was as well practiced to retain moisture in the soil, prevent nutrient leaching and at the same time, improving soil aeration. Beside these, it also helps in suppressing weed growth. Residues of the weeds and other dry plant materials were used as part of materials for mulching.
Irrigation
Irrigation was practiced in order to study the behavior of the crop in question during each phase of its growth and development. The type of irrigation applied was the traditional form of irrigation which involves applying water directly into the soil within the area where the crop was planted. Irrigation was applied to the plant almost every day because of the small quantity of water supplied to the plant which was enough to satisfy the growth of watermelon. The root depth at each dekad was observed and used to determine the quantity of water to supply the crop at each phase of growth and thus, the total quantity of water supplied during the period was determined by multiplying the area of the plant irrigated (i.e 1m²) by the root depth at each dekad [21].
Irrigation Quantity= Area × Root Depth
Wet season planting
Wet season planting took place between 29th March and 6th June 2013 (70 days). The same procedure used during the dry season was as well repeated. Only at this time, weeding was necessary as this season promotes weed growth and the incidence of pest and diseases. Also, mulching was not necessary as there was constant supply of rainfall and thus, no need of preserving moisture in the soil. Irrigation was not applied at this time in order to effectively observe the growth and development of watermelon during the wet season. The plants were also sprayed with pesticides namely fostocine and bestman to prevent damage from pests and diseases.
Plot layout
The field plot has an area of 225 m² and has 9 mini-plots each with a dimension of 3 m*3 m. On each of these mini-plots, a total of 9 seeds were planted due to the 1 m * 1 m spacing. The Plot layout is shown in the diagram below Figure 2.
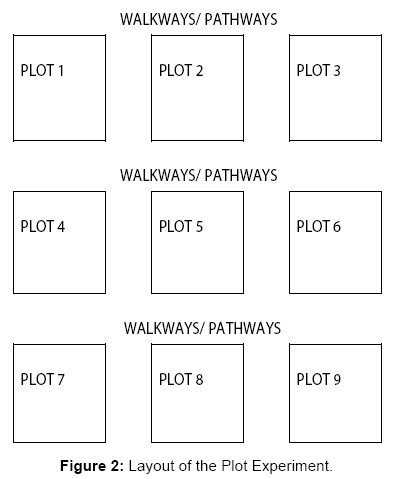
Figure 2: Layout of the Plot Experiment.
Plot dimensions
Number of Plots: 9, Plot size: 3 m by 3 m, Inter-row Spacing: 1 m, Intra row Spacing: 1 m, Number of stands per Plot: 9, Total number of Plant Stands: 81
Data collection
Two classes of data were collected which are the climatic data and the plant growth data. The climatic data were collected from the meteorological station of the University. The climatic data were collected in both seasons and these data include rainfall, relative humidity, evaporation, and sunshine amount, air temperature (maximum and minimum). Plant growth data were collected from each of the treatments in each plot every ten days (from the day the seeds were sown). The data were collected using a ruler.
The plant growth data of watermelon that were taken are Number of Leaves, Stem height/ Vine Length, Number of Internodes. Below are the descriptions of each of these parameters:
Number of leaves: This data helps to determine the rate at which leaves increase every ten days as part of the determination of the growth and development process of watermelon.
Stem height/ vine length: The stem height is used to quantify the height of the plant reached before the plant starts creeping while vine length refers to the total length of the plant after it starts creeping. These data are as well needful to monitor the systematic process of growth and development of the plant every ten days.
Number of internodes: This refers to the portion of the plant stem between the nodes (which hold bud which grows into one or more leaves). Thus, the internode is the gap between two leaves and it is one of the major parameters measured in observing watermelon growth and development.
Data analysis
Dekadal (i.e., ten days) data was collected from the experimental treatment units which spanned for seven dekads (70 days) for both seasons. These data was subjected to Student t-test using the Statistical Package for Social Sciences (SPSS). Student T-test is an inferential statistical test designed to identify significant differences between two means or levels of behavior. It was used to compare the data obtained from the plants between the two groups (in this case wet season and dry season) to see whether or not there is significant difference. SPSS 17.0 was used in the analysis of this data.
H0: There is no significant difference in the growths of watermelon between the 2 seasons
H1: There is significant difference in the growths of watermelon between the 2 seasons.
Reject H0 if tcal = ttab and accept H1 if tcal ≠ ttab.
ttab = 0.05 (i.e. 5% significant level) which indicates that the error of this experiment is not more than 5%
N.B: tcal: Calculated t-value
ttab: Tabulated t-value
The summary of climatic data that was collected during the study period is given in Table 1
| Total | Mean | |||||
|---|---|---|---|---|---|---|
| Period | Rainfall (mm) |
Evaporation (mm) |
R.H(%) | Sunshine (hr/day) |
Max (ºC) |
Min (ºC) |
| Dry Season | 91.9 | 335 | 57.5 | 5.64 | 35.7 | 23.7 |
| Wet Season | 210.6 | 288.6 | 70.0 | 5.60 | 31.8 | 23.5 |
Table 1: Summary of climatic Data collected during the period.
The table showed that a total value of 91.9 mm of rainfall was recorded during the dry season while 210.6 mm of rainfall was received in the wet season.
The result of root depth, Irrigation amount, Soil Moisture Content, Evaporation and Precipitation observed in Dry Season is given in Table 2.
| Dekads | Root depth (cm) |
Applied Moisture(mm) | Soil Moisture Content22.5cm Depth (%) | Precipitation (mm) |
Evaporation (mm) |
|---|---|---|---|---|---|
| 1 | 2.3 | 23 | 1.7 | - | 4.5 |
| 2 | 3.4 | 34 | 2.3 | 33.8 | 4.0 |
| 3 | 4.5 | 45 | 2.2 | - | 4.4 |
| 4 | 5.8 | 58 | 2.2 | - | 5.4 |
| 5 | 7.0 | 70 | 4.6 | 23.5 | 5.7 |
| 6 | 9.1 | 91 | 4.2 | 23.3 | 4.6 |
| 7 | 10.9 | 109 | 4.1 | 11.3 | 5.0 |
Table 2: The result of root depth, Irrigation amount, Soil Moisture Content, Evaporation and Precipitation observed in Dry Season.
The table above provided data for the dry season production of watermelon while indicating the root depth at each dekad and at the same time the irrigation quantity needed for plant growth support. The soil moisture content was also determined to know the depth of soil moisture content which was seen to increase when there is rainfall.
Result of number of leaves
The result of the number of leaves in both seasons is given in Table 3.
| Days | Wet Season | Dry Season |
|---|---|---|
| 10 | 2 | 2 |
| 20 | 4.375 | 11 |
| 30 | 5.625 | 12 |
| 40 | 7.75 | 36 |
| 50 | 13.875 | 55 |
| 60 | 20.71 | 67 |
| 70 | 32.571 | 84 |
Table 3: Result of Number of leaves.
The table showed that the number of leaves produced by the plant in dry season was relatively more than that produced during the wet season. At the end of the first dekad, 2 leaves were recorded in both season and immediately after the first dekad, the numbers of leaves produced were found to vary for both seasons.
Result of stem height/ vine length
The result of the stem height/vine length is given in Table 4. The table above revealed the stem height data of watermelon for the first three dekad and then the vine length data for both seasons. The first three dekads which indicate the stem height data could be seen to vary with a wide margin in both seasons. On the average, the stem height recorded 2.6 cm in wet season while the dry season was measured to be 9.3 cm. This wide variation could be seen to continue throughout the entire growth cycle of watermelon.
| Days | Wet Season | Dry Season |
|---|---|---|
| 10 | 2.6125 | 9.3 |
| 20 | 3.7625 | 35 |
| 30 | 6.9125 | 36 |
| 40 | 20.7625 | 97.5 |
| 50 | 32.6285 | 162 |
| 60 | 43.186 | 256.3 |
| 70 | 54.014 | 415.8 |
Table 4: Result of Stem Height/ Vine Length.
Result of number of internodes
The result of number of internodes is given in Table 5. This result in Table 5 is somewhat related to that of Table 4 as it could be seen that they follow the same trend since the number of internode is the gap or space between two leaves. While 2 leaves were recorded in both seasons in the first dekad, 1 internode was recorded in both seasons and then afterwards, the variation in the number of internodes in both seasons can therefore, be traced out from the table which follows the same trend as well with that of Table 4.
| Days | Wet Season | Dry Season |
|---|---|---|
| 10 | 1 | 1 |
| 20 | 2 | 2 |
| 30 | 3.375 | 12 |
| 40 | 6.125 | 29 |
| 50 | 12.28571 | 51 |
| 60 | 19 | 64 |
| 70 | 26 | 81 |
Table 5: Result of Number of Internodes.
Comparison of crop parameters between wet and dry season
The result of the T-Test analysis in crop growth parameters for both seasons is given in Table 6
| Pairs (Wet - Dry) | Means | T-value | Significance (2 tailed) |
|---|---|---|---|
| Number of Leaves | -25.73 | -3.192 | 2.447 |
| Stem/Vine Length | -121.15 | -2.507 | 2.447 |
| Number of Internodes | -25.32 | -3.152 | 2.447 |
Table 6: Comparison of Crop Parameters between Wet and Dry Season.
The results of the number of leaves observed (at every ten days after seeds were sown) in both wet and dry season are shown in the table above. This table reveals a negative result for the mean and the t-value for each observed parameters; this is because the leaf number, stem height/vine length and number of internodes observed in the wet season is less than that received during the dry season [22]. Comparing the calculated t-value with the tabulated value, we notice that the calculated t-value (neglecting the negative sign) is greater than the tabulated t-value therefore; we reject the null hypothesis and accept the alternative hypothesis, and then conclude that there is a significant difference in the crop growth parameters observed for watermelon between the two seasons.
Result of correlation analysis between moisture and growth parameters
This shows the results of correlation values obtained between moisture applied and the observed crop parameters In Dry Season. The result of the correlation values shows a significant increase in dry season (this is because of the irrigation applied during this period which was frequent.) while it is relatively lower in the wet season. Table 7 below clearly shows the result.
| Pair | Correlation Value(Dry) | Correlation Value(Wet) |
|---|---|---|
| Moisture-Leaf | 0.985 | 0.308 |
| Moisture-Stem Height | 0.969 | 0.176 |
| Moisture-Internodes | 0.987 | 0.280 |
Table 7: Result of Correlation Analysis between Moisture and Growth Parameters.
Table 7 above shows the level of relationship between the amount of precipitation received and the effect it had on each of the observed crop parameters. In the dry season, the irrigation water received by the plant shows a corresponding increase in the growth of watermelon whereas, in the wet season, negative relationship exists between the amount of rainfall received and the crop growth parameters.
Graphical representation of applied moisture on growth parameters
The results above are also presented in form of graphs in Figures 3 and 4 for each season.
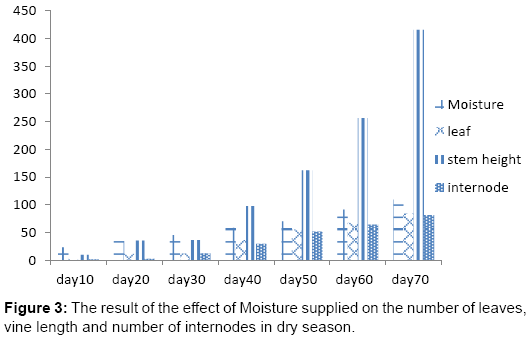
Figure 3: The result of the effect of Moisture supplied on the number of leaves, vine length and number of internodes in dry season.
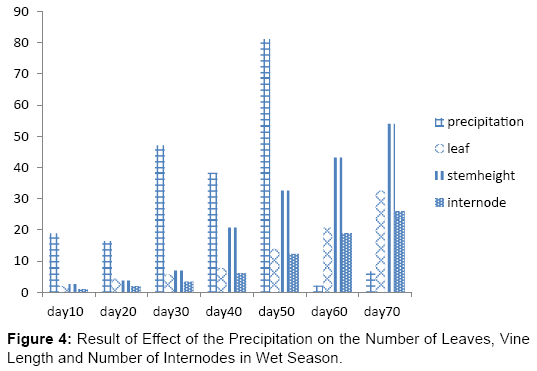
Figure 4: Result of Effect of the Precipitation on the Number of Leaves, Vine Length and Number of Internodes in Wet Season.
The Figure 3 above showed the effect of irrigation water applied on the number of leaves, stem height and the number of internodes in dry season. From the figure we see how the increase in the irrigation water (applied at each decade) translated into each of the respective crop parameters observed this agreed with Lee et al. who reported the Sensitivity of cucurbits to water and temperature stresses has been reported by Lee et al. and Moon et al. [23,24].
The Figure 4 above showed the effect of irrigation water applied on the number of leaves, stem height and the number of internodes in wet season.
Decision: Since the results show that calculated t-value is greater than the tabulated t-value, Ho is rejected and H1 is accepted, therefore there is a significant difference between the growth of watermelon during wet season and dry season.
The study was conducted in order to determine whether watermelon crop grown in dry season will be different from that of dry season under irrigation condition. The growth and development of watermelon was therefore, observed for a period of 70 days during which data of crop growth parameters were collected. These data obtained were analyzed by using T-test analysis and correlation analysis which allows for the comparison of the data obtained for both seasons. Also, the data were presented graphically so as to see the effect of precipitation on the growth parameters for each of the seasons. Hence, the results obtained for these analyses are hereby discussed;
The result above showed the level of significance in the crop growth parameters during the wet and dry season. As we see from the bar graph, we notice that each of the observed crop parameters increases as the irrigation water supplied (frequently) increase at each dekad and hence the optimum growth of the plant was attained. It revealed that crop growth was more rapid in the dry season than the wet season and that the growth rate significance level is highly significant. It further showed that the growth of each of the three observed crop parameters (i.e., number of leaves, stem/vine length) was highest in dry season as a result of frequent irrigation supply than that of the wet season when rainfall is infrequent and unpredictable hence, this agrees with Kintomo statement when he said, ‘that it was more profitable to grow vegetables during the dry season when water is made available’ [25].
After the comparing the relationship that exists between moisture and plant growth, it was observed that there was a positive relationship between them in both seasons except that the growth process varies due to the regularity of moisture supply. In the dry season, moisture was applied on a regular basis artificially while no moisture was applied during the wet season and hence, the rate of growth was observed to be slowed during the wet season which might in turn lead to longer life cycle of watermelon.
The correlation analysis further revealed the degree with which the moisture (supplied to the plants in each season) affects the growth of watermelon. From this, we observe that there is a strong and positive relationship between moisture and each of the observed crop parameters during dry season, that is, an increase in the moisture supplied to watermelon will lead to an accelerated and corresponding increase in watermelon growth whereas, it shows a weak relationship in wet season which could result into moisture stress and longer growing season of the crop.
Based on the analysis carried out, the dry season should be maximally utilized and irrigation facilities should be made available for the quality growth and development of Watermelon in Nigeria. Also, during the rainy season, supplemental irrigation should be made available when rainfall is not frequent.
Though, watermelon planted in both season grew well, it is advisable to grow watermelon during the dry season and then ensure that ample moisture is supplied to crease its growth and development with safety from pest attacks.
