Research Article - (2015) Volume 3, Issue 1
Keywords: BlueNile; GCM; HEC-HMS; RCP; Scenario
In these days the awareness of the effect of climate change due to human activities has been accelerating. Climate change and variability has many significant effects on the hydrological cycle and thus also on hydrology and water resources system. The Intergovernmental panel on climate change [1] has addressed this realization. Green house gasses have played a great role in changing the climate change at global as well as regional level. The release of these gases to the atmosphere has been disturbing the normal composition of the atmosphere [2].
Nowadays there is strong scientific evidence that indicates the average temperature of Earth surface is increasing due to greenhouse gas emissions. For example, the average global temperature has increased by about 0.6°C since the late 19th century and the latest IPCC [3], scenarios project temperature rises of 1.4 - 5.8°C and sea level rise of up to 100 cm by 2100.
Global Warming and precipitation are expected to vary considerably from region to region. Average change in climate, changes in frequency and intensity of extreme weather events are likely to have major impacts on natural and human systems [4]. With respect to hydrology, climate change can cause significant impacts on water resources by resulting changes in the hydrological cycle. For example, the changes on temperature and precipitation can have a direct consequence on the quantity of evapotranspiration and on runoff component. Consequently, the spatial and temporal availability of water resource can be significantly changes which in turn can affect agriculture, industry, and urban development [5].
The Blue Nile River is a main water resource for different transboundary countries which is already under immense pressure due to various competitive uses as well as social, political, and legislative conditions. In addition to these, previous studies show that many parts of the Nile Basin are sensitive to climatic variations [6-9] implying that climate change could have considerable impacts on the water resource availability. Therefore, it is necessary to analyse the possible changes in the available water resource aspect under the changing climatic conditions. However, due to variable climatic regions this impact might not be similar throughout the basin. Hence, dividing the basin into different regions will be a convincing and proficient approach when studying climate change impact.
Despite the fact that the impact of different climate change scenarios projected at a global scale, the exact type, and magnitude of the impact at a catchment scale is not investigated in most parts of the world [10]. Hence, identifying local impacts of climate change at a catchment level is quite important. The Upper Blue Nile River catchments are the main sources for the Blue Nile River basin and their water resources are an important input for the different water development projects and the livelihood support of the people/communities in the basin. Currently, different multipurpose water resources development structures are proposed and under constructions in the river basin. It is very critical to determine the hydrological response to climate change for the sustainability of the projects and looking for the possible mitigation measures otherwise all the cost indebted will be lost in failing to meet the objectives. In this study, the new RCP (Representative concentration path) climate scenarios data of the future climate output under assumed radiative forcing scenario will be used for each catchment in the River basin. Then the data will be used as input to the hydrological model (HEC-HMS 3.5) to simulate the effect of climate on the hydrological regimes of the catchments.
In this study the upper Blue Nile River Basin (Gilgelabay, Gumera, Ribb, and Megech) catchments will be modelled and the impacts of the climate change using (RCP 4.5 and RCP 8.5 emission scenarios) climate data will be used to analyse the future water availability in the region.
The upper Blue Nile River basin which is located in the Ethiopian Highlands. The Blue Nile River runs from its origin, Lake Tana, to the Sudanese border and eventually meets the White Nile River at Khartoum, Sudan. The Lake Tana basin is located in north-western Ethiopia (latitude 10.95° and 12.78°N, and longitude 36.89° and 38.25°E) with a drainage area of about 15,000 km2 [11]. The Lake Tana, the largest lake in Ethiopia and the third largest in the Nile Basin, is located in this basin. The major rivers feeding the Lake Tana are Gilgel Abay, Gumera, Ribb, and Megech. These rivers contribute more than 93% of the flow to the Lake Tana (Figure 1) [12].
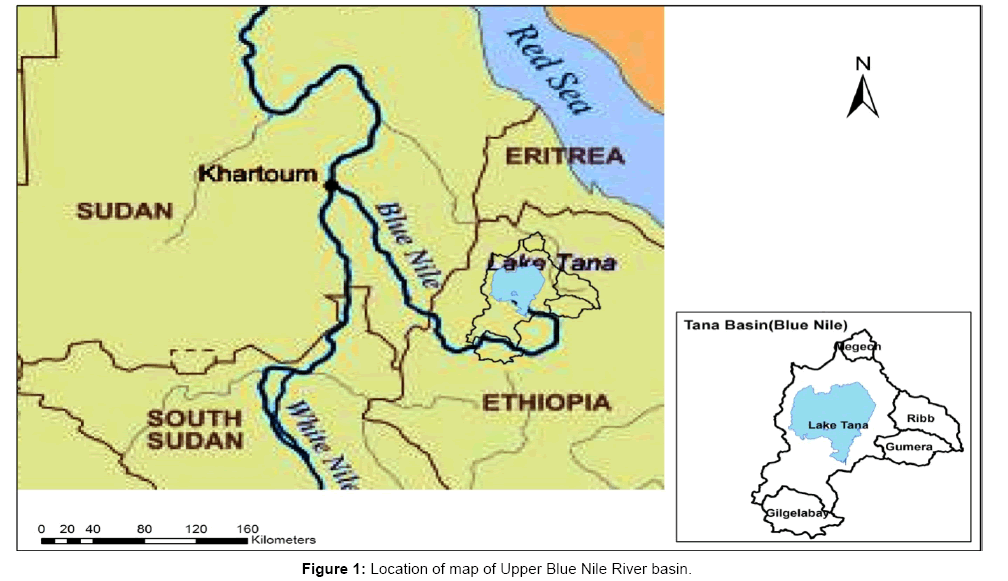
Figure 1: Location of map of Upper Blue Nile River basin.
The climate of Upper Blue Nile River basin (Tana basin), is dominated by highland tropical monsoon. Even if the basin is located near to equator the climate is comparatively mild due to high elevation. Most of the rainfall (70-90% total rainfall) occurs from June to September, [13]. April and March are intermediate seasons with some rainfall. The mean annual rainfall of the area is about 1465 mm with significant spatial variation (Figure 2). The mean annual maximum temperature is 25.5 °C and mean annual minimum temperature is 10.8°C (1988-2005).
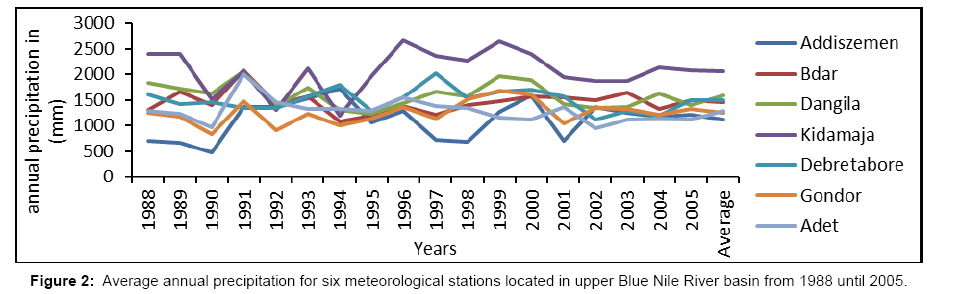
Figure 2: Average annual precipitation for six meteorological stations located in upper Blue Nile River basin from 1988 until 2005.
Lake Tana has more than forty tributaries, but the major rivers feeding the Lake are Gilgelabay (the largest river from the south direction), Gumera, and Ribb from the east and Megech from the north, these four main rivers accounts about 93% of inflow. The only river flowing out of the Lake Tana is the Blue Nile River (Abay River) as shown in Figure 3. The Blue Nile flow approximately reaches annually about 4 billion cubic metric at the out let of the lake Tana. From the Lake Tana, the Blue Nile travels around 35 Kms and reaches to a fountain place so called Tisesat which is 50 meter high, then flows in gorges towards the Sudan border. The Blue Nile flow at the Ethio-Sudan border annually reaches about 50 billion cubic meters. In the mean while major tributary rivers joins the Blue Nile, like Beles, Didessa, Fincha, Guder, Muger, Wenchit, Jemma, Beshilo and Temcha. The Blue Nile contributes two third of the Nile River Basin flow [11].
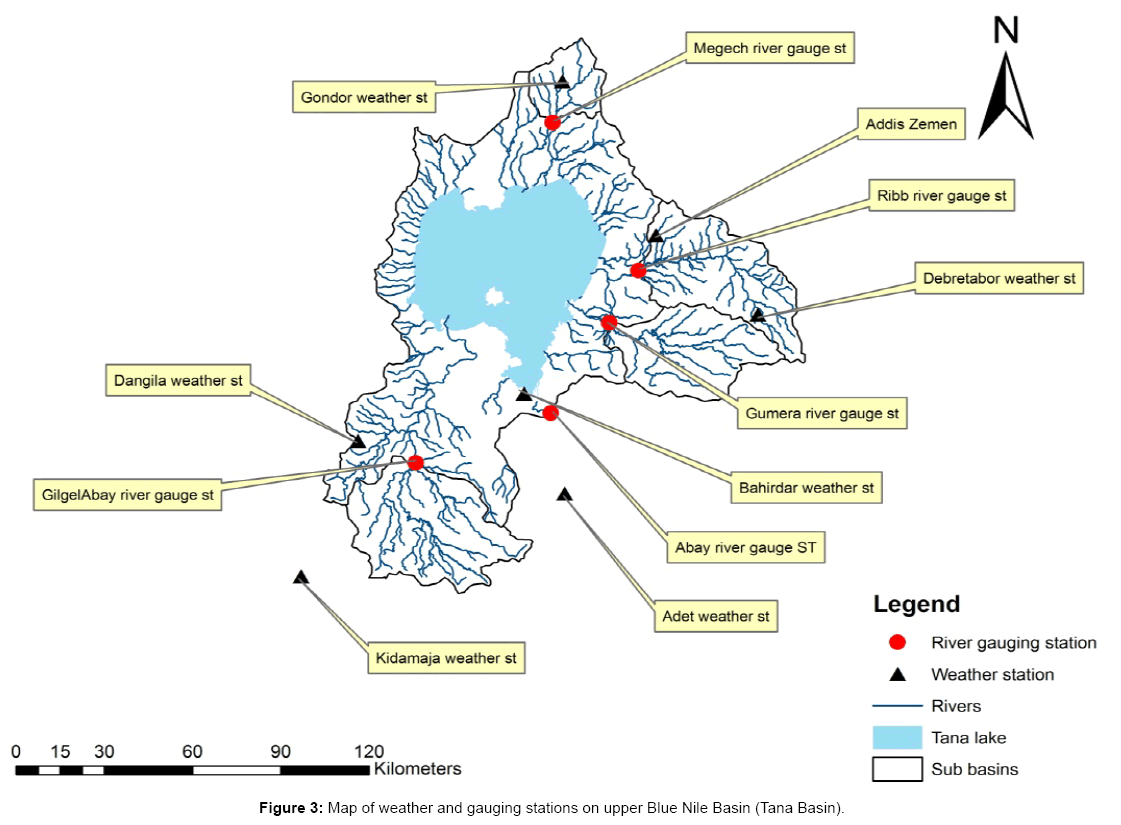
Figure 3: Map of weather and gauging stations on upper Blue Nile Basin (Tana Basin).
General frame work of the study
Data sources and availability
GIS-data SRTM 90 m DEM data was used as an input data for Arc GIS software for catchment delineation and estimation of catchment characteristic. Hydrological data; stream flow of upper Blue Nile River catchments were used for the calibration and validation the model. Soil, land use, and geological data also used for better understanding of the catchments. All these data were collected from the Ethiopia Ministry of Energy and Water Resources (MoEWR). Meteorological data also collected from National Metrological Station Agency (NMSA), in Addis Ababa and Bahirdar (Figure 4).
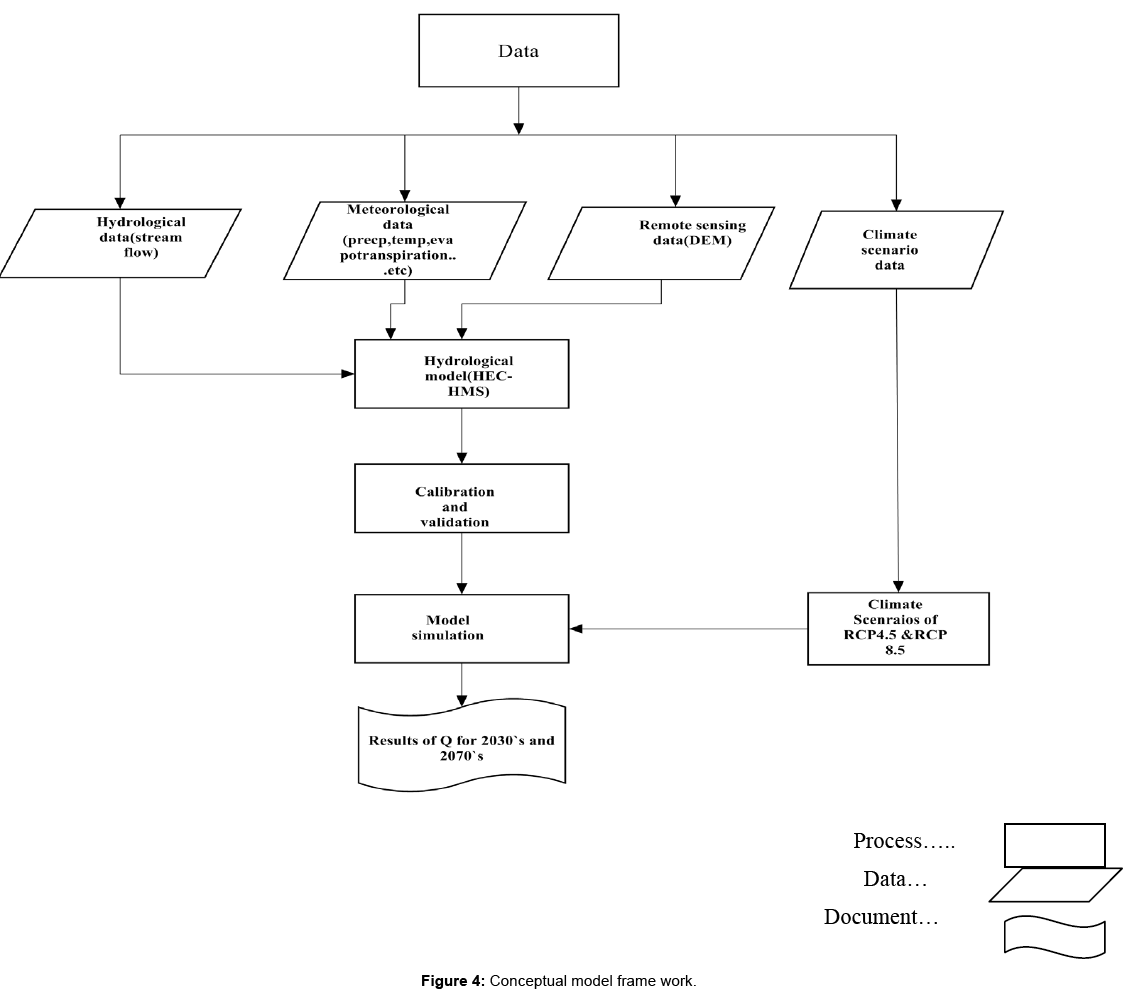
Figure 4: Conceptual model frame work.
Catchment size and weather stations
For each catchment areal precipitation was prepared using Thiessen polygon techniques. The number of observed weather station which contributes for each catchment determined and their areal contribution calculated (Table 1).
| Names | Area size (Km2) | Weather stations inside the catchment |
|---|---|---|
| GilgelAbay | 1664 | Kidamaja, Adet and Dangila |
| Gumera | 1335 | Addis Zemen, Debre Tabore and Bahirdar |
| Ribb | 1595 | Addis Zemen and Debre Tabore |
| Megech | 531 | Gondor |
Table 1: Area size and weather stations of four catchments in Upper Blue Nile River basin.
Climate scenario data
Five GCMs 0.5 degree by 0.5 degree resolution of RCP 4.5 and RCP 8.5 emission scenarios collected from (Wageningen University, ESS group). These future projections generated based on the Coupled Model Intercomparison Project5 (CMIP5). The inter comparison project started few years ago under the international climate scientist agreed for AR5 (Fifth assessment report). The projections rely on the bases of the new greenhouse gas concentration emission of representative concentration pathways (RCP) stated in [14]. The five different climate models are MPI-ESM-LR, IPSL-CM5A-LR, HadGEM2-ES, EC Figure EARTH-DMI, and CNRM-CM5. In this study we used RCP 4.5 and RCP 8.5 emission scenarios output of the earth`s system model. The meteorological variable includes; maximum temperature, minimum temperature, mean temperature, wind speed, surface down welling short wave radiation, surface down welling long wave radiation, snow fall and precipitation. The climate data ranges from 1st January 1960 until 31st December 2005 as historical period and for RCP 4.5 and RCP 8.5 comprised data from 1st January 2006 until 31st December 2100 except for HadGEM2-ES which ended at 31st December 2099. The temperature, precipitation, and snow fall data were bias corrected using method developed by [15]. The radiation and wind speed series data bias corrected used by [16]. Both the bias correction methods used WATCH forcing data series (1960-1999) (Table 2) [17].
| No | GCMs | Modelling Group,orgin of country | IPCC model ID | References |
|---|---|---|---|---|
| 1 | MPI | Max Planck Institute | MPI-esm | [18] |
| 2 | IPSL | Institut Pierre Simon Laplace, France | IPSL-CM5 | [19] |
| 3 | HadCM | Hadley Center for Climate and UKMO-Prediction and Research, UK | Hadgem2-es | [20] |
| 4 | Ecearth | European Insititute and ECMWF | Ec-Earth | [21] |
| 5 | CNRM | Centre National de Recherches Meteoroliques,France |
CNRM-cm5 | [22] |
Table 2: GCMs descripition and sources.
Areal precipitation for grid based GCM data
Areal precipitation also prepared for the 50 Kms by 50 Kms grid based GCM data for upper Blue Nile River basin (Figure 5).
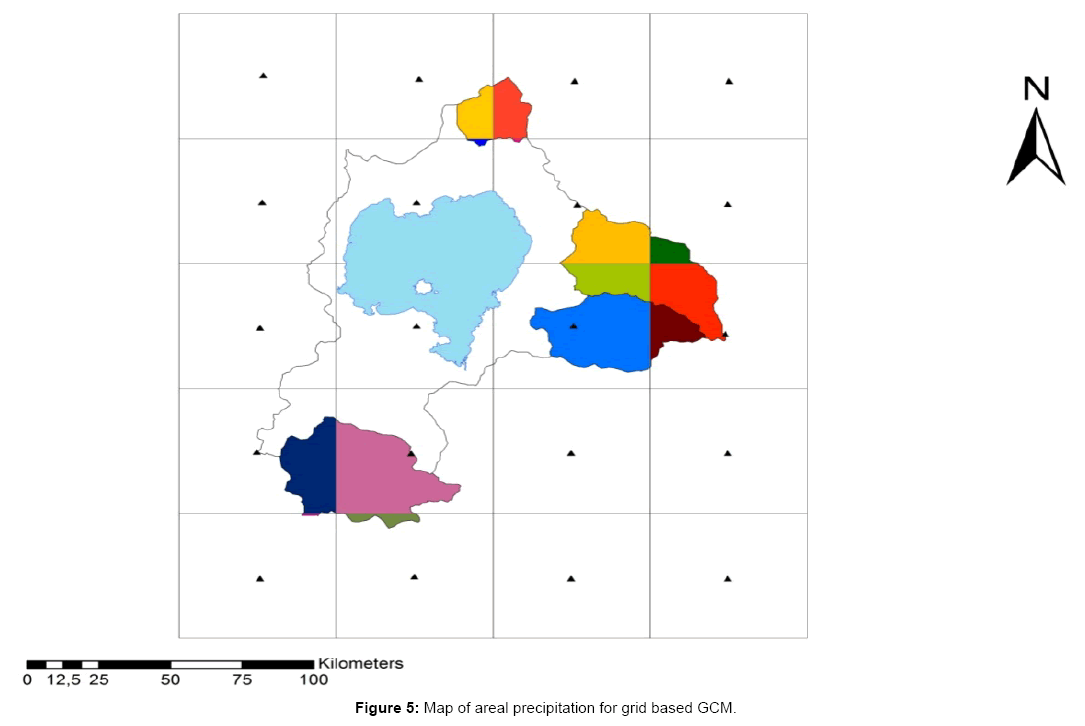
Figure 5: Map of areal precipitation for grid based GCM.
Potential Evpotranspiration (PET)
There are a number of methods to estimate potential evapotranspiration. However, the methods vary based on climatic variables required for calculation. The temperature based method uses only temperature and day length; the radiation based method uses net radiation and air temperature and some other formula like, Penman requires a combination of the above net radiation, air temperature, wind speed, and relative humidity.
The FAO Penman_Monteith method is recommended as the sole ET0 method for determining reference evapotranspiration when the standard meteorological variables including air temperature, relative humidity, and sunshine hours are available [23].
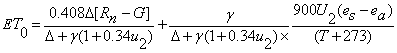 (1)
(1)
Where,
ET0 = Reference Evapotranspiration, mm/day,
Rn = Net radiation, MJm-2 day-1
G= Soil heat flux, MJm-2 day-1
es= Saturated vapor pressure, KPa,
ea= Actual vapor pressure, KPa,
es-ea= Saturated vapor pressure deficit, KPa,
Δ = Slope of the saturation vapor pressure temperature relationship, KPa°C-
γ = Psychometric constant, KPaC-1
U2= Wind speed, ms-1 and
T = Mean daily air temperature at 2m height (°C)
In this study the potential evapotranspiration for the study area was computed by FAO Penman-Monteith method for each weather station and for grid based GCM data which falls on the study area.
Methods
Arc GIS 10.2 was used to delineate the catchment area. The watershed and sub basins delineation was carried out based on an automatic delineation procedure using a Digital Elevation Model (DEM) and digitized stream networks.
Potential evapotranspiration
Potential Evapotranspiration (PET) is determined primarily by net radiation and temperature but also by the moisture-holding capacity of the air and other factors (e.g. wind speed). Increased temperature will lead to more evaporation, although the effect is complicated by the above factors [24]. Estimates of potential Evapotranspiration (is calculated using the penman- montheith equation with temperature, wind speed, solar hour and humidity as input). Air temperature data are used for calculations of snow accumulation and melt, or to calculate potential evaporation. If none of these last options are used, temperature can be omitted in snow free areas. The calculated Long term average monthly potential evpotranspiration for each observed weather station from 1988-2005.
HEC-HMS hydrological model
HEC-HMS-3.5 software used to simulate future runoff model. The hydrological model was calibrated and verified using observed stream flow data of the basin. The model was selected because of its simplicity, availability, and widely acceptance. HEC-HMS Model setup consists of four main model components: basin model, meteorological model, control specifications, and input data (time series, paired data, and gridded data) [25].
HEC-HMS calibration and validation
The deficit and constant loss method used to model infiltration loss. For the transformation of excess precipitation into direct surface runoff, synder unit hydrograph method was used, and for the base flow recession method was employed. These methods selected based on checking up of every methods for the best fit options.
Therefore, automated calibration in conjunction with manual calibration was used to determine a practical range of the parameter values preserving the hydrograph shape and minimum error in volume. The model calibrated from (1988-2000) and validated from (2001-2005).
HEC-HMS model performance criteria
Model performance was evaluated for both calibration and validation in different ways including coefficient of determination (R2) and Nash-Sutcliffe efficiency [26]. R2 and ENS [27] are often used to assess hydrological model performance. In addition to Nash-Sutcliffe efficiencies (ENS) and coefficient of determination criteria, the simulated and observed hydrograph visually inspected and checked.
Nash-Sutcliffe efficiencies (ENS)
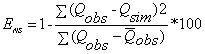 (2)
(2)
Where:
Qobs=observed discharge
Qsim= simulated discharge
 = mean of observed discharge
 = mean of simulated discharge
Nash-Sutcliffe efficiencies can range from -∞ to 1.
An efficiency of ENS = 1 corresponds to a perfect match of modelled discharge to the observed data. An efficiency of ENS = 0 indicates that the model predictions are as accurate as the mean of the observed data, whereas an efficiency less than zero (-∞
Coefficient of correlation (R2)
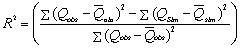 (3)
(3)
Where:
Qobs=observed discharge
Qsim= simulated discharge
= mean of observed discharge
= mean of simulated discharge
R2 is indicates how the simulated data correlates to the observed values of data. The range of R2 is extends from 0 (unacceptable) to 1 (best) [29].
In this study, 0.5 degree by 0.5 degree grid resolution of five different bias corrected GCM model outputs based on RCP 4.5 and RCP 8.5 emission scenarios for upper Blue Nile Basin used for analysis. Period from 1971-2005 taken as a base period and two future periods considered for impacts investigation of 2030`s (2035-2064) and 2070`s (2071-2100). The following GCMs model used, MPI, IPSL, Hadgemes, Ecearth and CNRM-cm5. Only for Hadgem-es of future horizon of 2070`s ranges from 2071-2099. Inorder to check the exactness replication of the multimodal prediction for the basin. Each historical climate data output compared against observation data for each catchments. The mean monthly precipitation, maximum temperature, minimum temperature and potential evapotranspiration of observed (1988-2005) and GCMs (1971-2005) compared for four catchments (Gilgelabay, Gumera, Ribb, and Megech) for Upper Blue Nile Basin.
Historical GCMs output comparison with observed data for blue nile river basin
The raw GCM of long term mean monthly precipitation, temperature, and evapotranspiration indicated that there is good agreement in trend and pattern with the observed data as shown in Figure 6. In each case the coefficient of determination (R2) has resulted more than 0.96, which proofs that the GCM simulated the reality of the observation of climate data over the basin. However the mean monthly precipitation has shown a very slight discrepancy during the major rainy season. Relative annual percentage change comparison technique also used such kind of performance measurement metrics also has been done by [30]. The assessment result shows a slight under estimation of the GCM models prediction relative to the observed precipitation (Table 3).
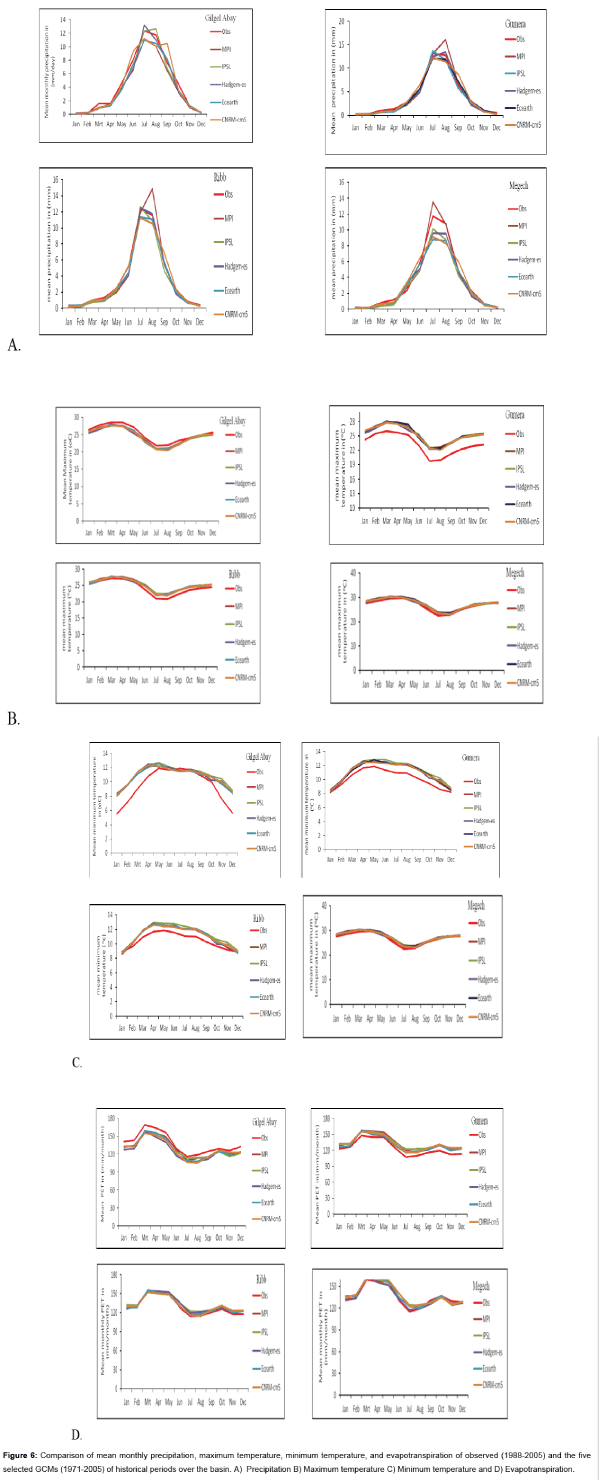
Figure 6: Comparison of mean monthly precipitation, maximum temperature, minimum temperature, and evapotranspiration of observed (1988-2005) and the five selected GCMs (1971-2005) of historical periods over the basin. A) Precipitation B) Maximum temperature C) Minimum temperature and D) Evapotranspiration.
| Catchment name | Factor | Observed | MPI | IPSL | Hadgem2-ES | Ecearth | CNRM-cm5 |
|---|---|---|---|---|---|---|---|
| Gilgel Abay | Average Annual Rainfall in mm | 1630.3 | 1388.7 | 1511 | 1528.3 | 1472.4 | 1605.1 |
| R2 | 0.99 | 0.98 | 0.98 | 0.99 | 0.93 | ||
| Percentage change in (%) | -14.8 | -7.3 | -6.3 | -9.7 | -1.5 | ||
| Gumera | Average Annual Rainfall in mm | 1442.1 | 1467.7 | 1341.5 | 1392.7 | 1386.8 | 1438 |
| R2 | 0.97 | 0.99 | 0.99 | 0.99 | 0.96 | ||
| Percentage change in (%) | 1.8 | -7.0 | -3.4 | -3.8 | -0.3 | ||
| Ribb | Average Annual Rainfall in mm | 1306.4 | 1325.8 | 1210.2 | 1269.4 | 1228.5 | 1283.4 |
| R2 | 0.96 | 0.99 | 0.99 | 0.99 | 0.98 | ||
| Percentage change in (%) | 1.5 | -7.4 | -2.8 | -6.0 | -1.8 | ||
| Megech | Average Annual Rainfall in mm | 1240.8 | 1229.5 | 1051.2 | 1112.1 | 1078.9 | 1149.9 |
| R2 | 0.98 | 0.99 | 0.98 | 0.97 | 0.94 | ||
| Percentage change in (%) | -0.9 | -15.3 | -10.4 | -13.1 | -7.3 |
Table 3: Comparsion of observed precipitation with five slected GCMs for the Blue Nile Basin.
Generally, all the GCMs output prediction of precipitation, maximum temperature, minimum temperature, and evapotranspiration resembled in producing the observed data for base period. Therefore, it is plausible to use the GCMs data output for future prediction for the basin.
Future projection of climate impacts on precipitation, maximum temperature, minimum temperature, and potential evpotranspiration of the upper blue nile river basin.
Precipitation: The multimodal average monthly and seasonal precipitation result showed that in the future precipitation generally increases over the basin. In all four catchments, the mean monthly precipitation increased in a positive direction particularly in August, September, and October under both future periods. At 2070`s maximum precipitation change projected during the month of October ranging from +71.4% to +255.2% as shown in Figure 7. In the future, mean seasonal precipitation generally increase in all catchments. Particularly, during spring (Belg season-mild rainy season) and summer (Kiremtmain rainy season), precipitation will increase, this will help rainy fed agriculture dependent farmers to produce more crops (Figure 8).
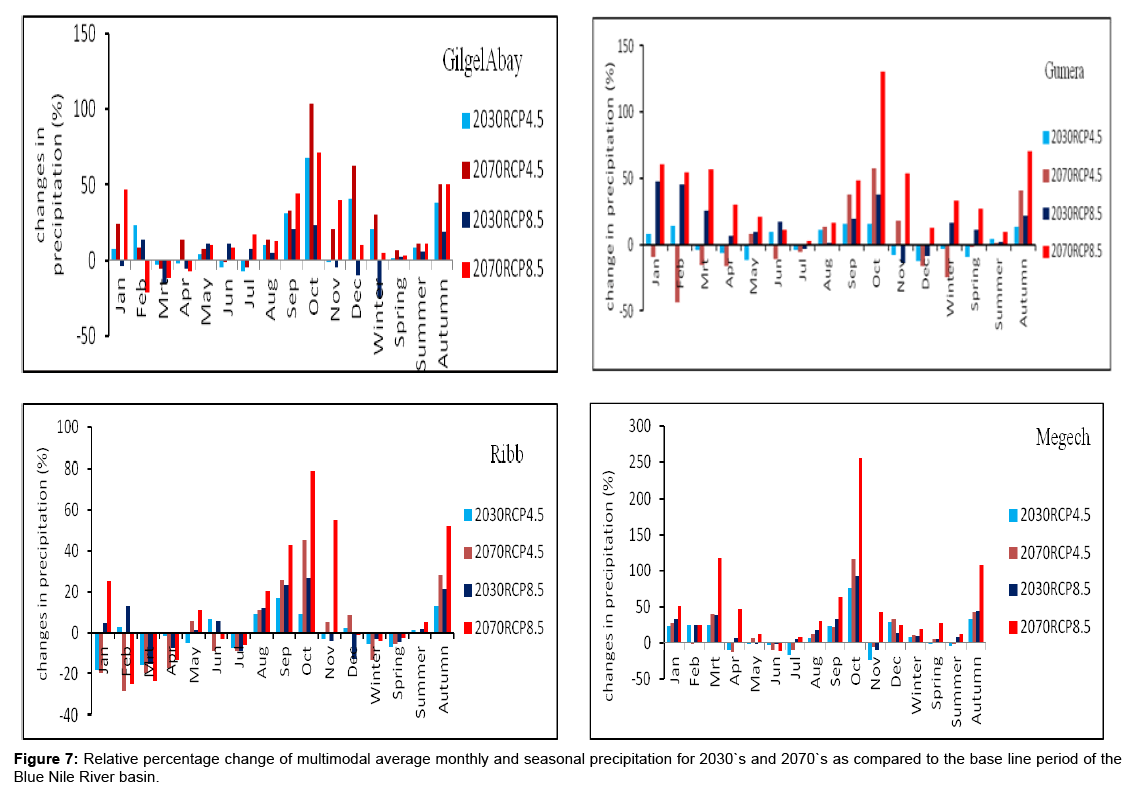
Figure 7: Relative percentage change of multimodal average monthly and seasonal precipitation for 2030`s and 2070`s as compared to the base line period of the Blue Nile River basin.
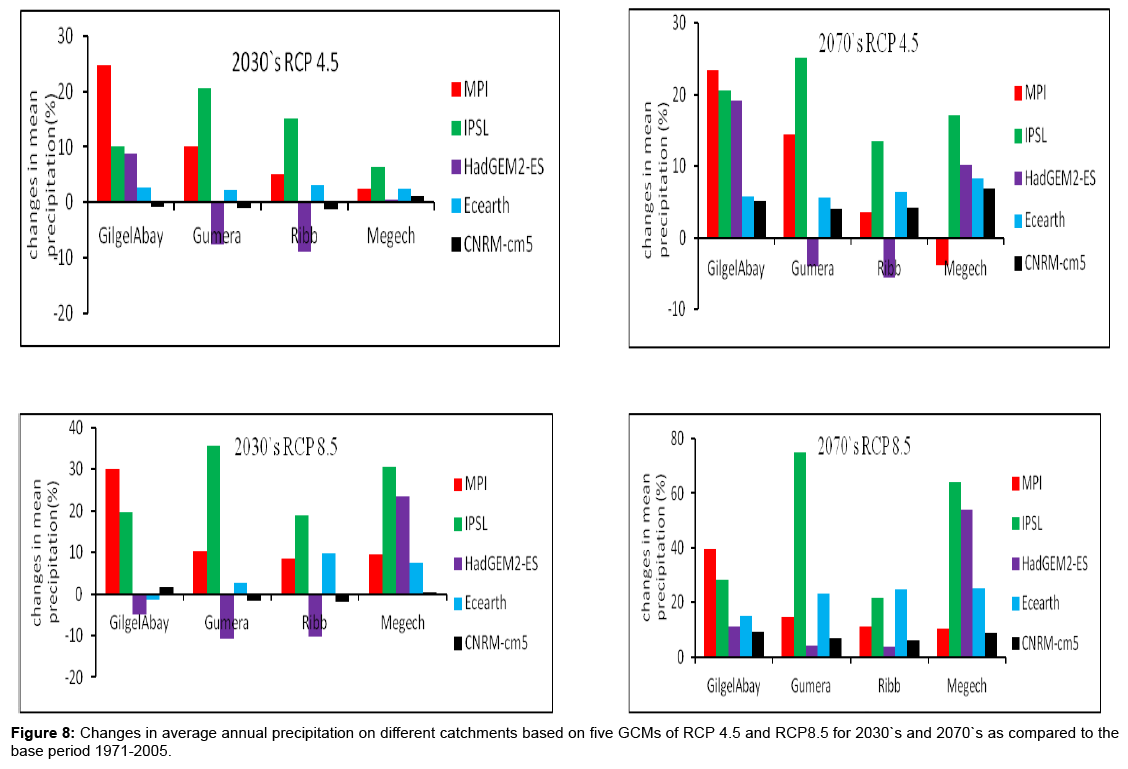
Figure 8: Changes in average annual precipitation on different catchments based on five GCMs of RCP 4.5 and RCP8.5 for 2030`s and 2070`s as compared to the base period 1971-2005.
Long term average annual precipitation change showed that, precipitation significantly increases under both future periods and RCPs scenarios. At 2070`s of RCP 8.5, all the GCM models projected that precipitation will increases in the future. Particularly, IPSL GCM model predicted maximum change in average precipitation than the other GCM models on the basin.HadGEM2-ES GCM model projected relatively a decrease in average annual precipitation over the basin. CNRM-cm5 GCM model also projected minimum change for the basin. The relative change in average annual precipitation in RCP 8.5 is more pronounced than RCP 4.5. Moreover the change at 2070`s is relatively more than at 2030`s over the basin. For 2030`s average annual precipitation change projected between (-8.9% and +24.6%) for RCP 4.5 and between (-10.8% and +35.4%) for RCP 8.5. At 2070`s average annual precipitation change projected between (-5.6% and +25.2%) for RCP 4.5 and between (+3.8% and +74.7%) for RCP 8.5 emission scenario.
Maximum temperature, minimum temperature, and potential evapotranspiration
Average annual maximum and minimum temperature significantly increases in both future periods and RCPs scenarios. At 2070`s of RCP 4.5 and RCP 8.5, the change in average maximum and minimum temperature is magnificent compared to 2030`s of RCP 4.5 and RCP 8.5 for the Blue Nile basin. At 2030`s and 2070`s, average annual maximum temperature increases up to +3.9°C for RCP 4.5 and up to +7.1°C for RCP 8.5 emission scenario, respectively. The mean annual minimum temperature may increases up to +4.5°C for 2030`s and up to +8.4°c for 2070`s. Average annual evapotranspiration also increases significantly especially for RCP 8.5 emission scenario. HadGEM2-ES GCM projected the maximum relative change under all the variables for the basin (Figure 9).
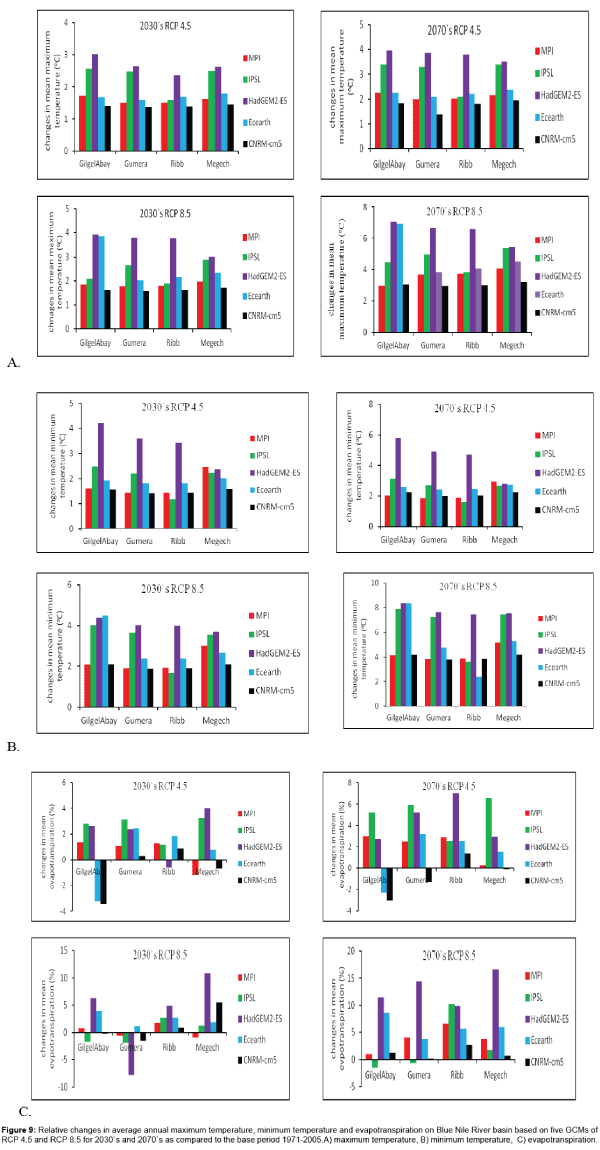
Figure 9: Relative changes in average annual maximum temperature, minimum temperature and evapotranspiration on Blue Nile River basin based on five GCMs of RCP 4.5 and RCP 8.5 for 2030`s and 2070`s as compared to the base period 1971-2005. A) maximum temperature, B) minimum temperature, C) evapotranspiration.
Over all, it is clearly observed that individual GCM projected different variation for the basin in precipitation and temperature. Maximum temperature, minimum temperature, and potential evapotranspiration show fairly a consistence patterns, but there is much less consistency and instability of certainty about future precipitation pattern because of the low convergence in climate model projections in the region of upper Blue Nile River basin. On the basis of the result from seven GCMs model experiments, Conway [31] indicated that there is large inter-model difference in the detail of rainfall changes over Ethiopia. Also in IPCC (2008a) [32] indicates that there is a considerable variation in various models projection. A study done by [33] shows that, the observed precipitation of the last century resulted that precipitation decreases over Africa, even if many climate model projected in increase in precipitation. Hulme et al. [34] and Giannini et al. [35] indicated in their studies, particularly precipitation changes predicted by GCMs in much of Africa involve considerable uncertainty because of the lack of capability of climate model predictions to account for the influence of land use changes on future climate and the relatively weak representation in many of climate models of the important aspect of climate variability that are crucial for Africa (e.g., ENSO).
Over all, we found in our analysis that temperature and potential evapotranspiration significantly increases in the future period in all five GCM models, high increment in RCP 8.5 than RCP 4.5 scenario indicated, the reason is because due to high radiation concentration projection in RCP 8.5 emission scenario. Even if, Precipitation prediction varies over the basin, but precipitation normally increases. The prediction is in line with the previous studies carried out for the basin, though there are some differences in magnitude of change that is due to the difference in GCM models and emission scenarios.
Hydrological modelling of catchments
A semi-distributed hydrological modelling technique applied for GilgelAbay, Gumera, and Ribb catchments in order to increase the performance of the model. However a lumped system applied for Megech catchment due to its small area size. The catchments are classified into sub basins and each sub basin parameters manually adjusted by trial and error method and automatically optimised to get the best fit. The model performance was checked using ENS and R2, the values during calibration period (1988-2000), for Gilgelabay (0.71, 0.73), Gumera (0.52, 0.72), Ribb (0.55, 0.72) and Megech (0.50, 0.51) respectively. During validation period (2001-2005), the values of ENS and R2, for Gilgel Abay (0.77, 0.78), Gumera (0.57,0.76), Ribb (0.53,0.78) and Megech (0.5, 0.51) respectivly,the results obtained are satisfactory and acceptable to simulate the basin runoff for future projection. The closer the model efficiency is to 1, the more accurate the model is. ENS values greater than 0.5 are fairly acceptable to use the hydrological modele for simulation [28].
Future impacts of climate change on runoff on upper blue nile river basin
The impact of climate change on stream flow predicted on upper Blue Nile based on the changes in temperature and precipitation projected in the five different GCMs under RCP 4.5 and RCP 8.5 emission scenarios. The future stream flow prediction was analysed taking stream flow from 1988-2005 as a base line against future runoff projection of 2030`s (2035-2064) and 2070`s (2071-2100). In this study, namely Gilgelabay, Gumera, Ribb and Megech catchments were considered and analysed and presented in the following sections.
Mean monthly and seasonal average multimodal GCM runoff of the upper blue nile river basin
Generally, mean monthly and seasonal runoff of multimodal GCM projection indicated that, average runoff increases under both future periods and RCPs emission scenarios as compared to the base line period (1988-2005). Runoff change in the mid of the century is relatively small in both RCP 4.5 and RCP 8.5 emission scenarios. At 2070`s (2071-2100), average monthly and seasonal runoff by far will increase over the basin than 2030`s (2035-2064). At 2030`s average monthly runoff change projected in between -25% and +84.5%, while at 2070`s average monthly runoff change ranges between -14.9% and +127.9%. Relatively small change of average seasonal runoff projected during mild and main rain seasons (spring and summer) compared to autumn and winter. During rainy season, average seasonal runoff change reach up to +46.2% and up to +90.7% in the mid of the century and at the end of the 21st century respectively (Figure 10).
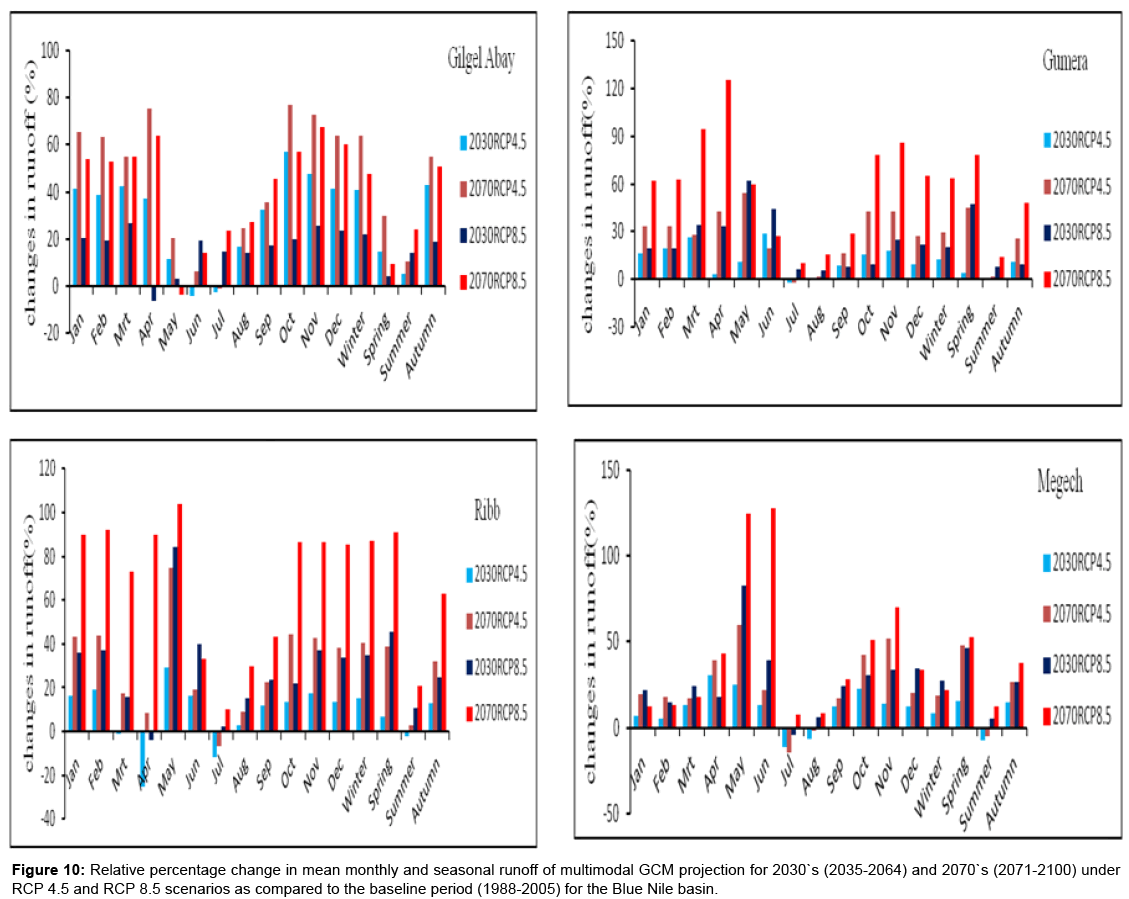
Figure 10: Relative percentage change in mean monthly and seasonal runoff of multimodal GCM projection for 2030`s (2035-2064) and 2070`s (2071-2100) under RCP 4.5 and RCP 8.5 scenarios as compared to the baseline period (1988-2005) for the Blue Nile basin.
Comparison of future impacts of climate change on average runoff of the upper blue nile river basin based on five GCMs model projections
In this study analysis (Figure 11), the relative long term average runoff projection of the different GCMs showed that runoff increases on the upper Blue Nile River basin under both RCP 4.5 and RCP 8.5 emission scenarios. Future projection change at 2070`s of RCP 8.5 is more than at 2030`s of RCP 4.5 emission scenario, due to high increase in precipitation and potential evapotranspiration over the basin. At 2030`s, average annual runoff changes in between (-13.5% and +67.7%) for RCP 4.5 and in between (-16% and +74.8%) for RCP 8.5 scenario. At 2070`s,average annual runoff changes in between (-12.2% and +73.5%) for RCP 4.5 ,and between (-19.6% and +127.4%) for RCP 8.5 emission scenario under five GCMs out puts as compared to the base line period.
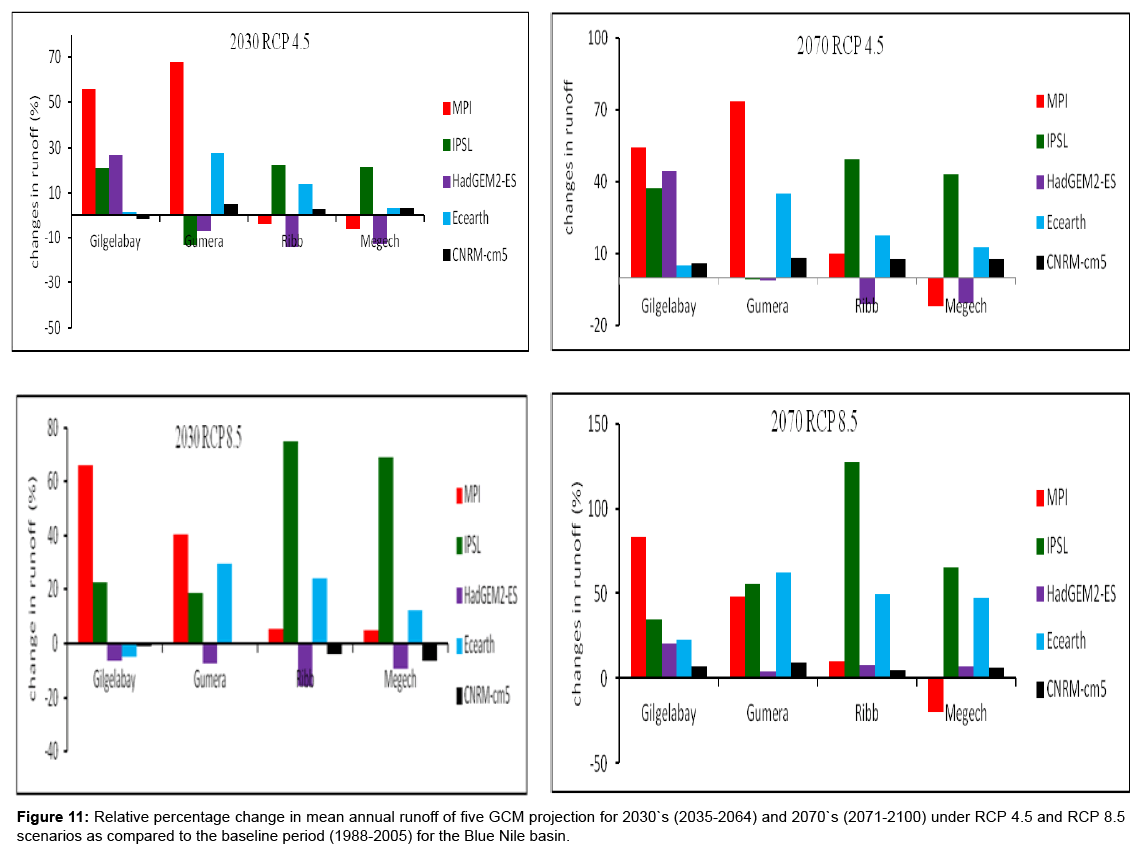
Figure 11: Relative percentage change in mean annual runoff of five GCM projection for 2030`s (2035-2064) and 2070`s (2071-2100) under RCP 4.5 and RCP 8.5 scenarios as compared to the baseline period (1988-2005) for the Blue Nile basin.
In this study, the different GCMs model resulted different projection response to climate change over the basin. Ecearth and IPSL GCM projected more or less increase in runoff change where as HadGEM2-ES projected decrease in average runoff change for the different of the catchments of the Blue Nile basin.
In previous study conducted by [36] estimated that in the midcentury the mean annual flow change ranges from −72% to 75% using VHM and from −81% to 68% using NAM model. The result obtained in our study is quite within the estimated range of change in mean annual flow of the upper Blue Nile River basin. Generally in our study almost 4 out of 5 models projected increase in mean annual flow. According to IPCC study, 18 models out of 21models projected that there will be a great robust of precipitation increase in core of East Africa [1].
Generally, in this study almost all of the five GCMs model result projected that, precipitation increases in the future over the basin, this suggests that the increase in runoff may be due to the increase of precipitation.
Climate impact has potential impacts on future hydrological and meteorological variables due to increased green house emissions which is associated in increasing temperature of the globe. The future impact of climate change on hydro- meteorological characteristics of the basin has been studied like: precipitation, Temperature (Maximum and Minimum) and Potential evpotranspiration (PET) for 2030`s (2035- 2064) and 2070`s (2071-2100) using CMIP5 projection output. HECHMS 3.5 hydrological model was used to study impacts of climate change on runoff.
In the future, mean monthly and seasonal precipitation will increase over the basin. At 2030`s and 2070`s, average annual precipitation may increases by +35.4% and by +74.7%, respectively. The average annual potentialevpotranspiration, maximum and minimum temperature projection results showed that temperature will increase in both future horizon periods. High maximum change predicted at the end of 21st century for RCP 8.5 emission scenario. The direction and magnitude changes of projection results are in line to the global change projection by IPCC, 2007. Moreover, the results shown in this report are inconsistent with previous studies conducted in the basin by Kim et al. [8] and Setegn et al [37]. They both had used CMIP3 results while in this study we used CMIP5 results.
HEC-HMS hydrological model calibrated and validated for each catchments. The daily Nash and Sutcliffe efficiency ( ENS) and coefficient of determination (R2) of model performance criterion used to evaluate the model applicability for different catchments. The results obtained are satisfactory and acceptable. Therefore, we assured in this study, HEC-HMS model can be used for modelling and projection of future impacts of climate changes on runoff for upper Blue Nile river basin.
The impacts of climate change in precipitation and temperature has produced a significant change on runoff in the basin. Conway et al. [38] Clearly indicated that the combined effects of precipitation and temperature changes would have profound effects on the stream flow regime of the Blue Nile River. According to our study of multimodal average GCM shows that, mean monthly and seasonal runoff will increases in all months and seasons for both future periods of RCP 4.5 and RCP 8.5 emission scenarios. At 2030`s and 2070`s, average annual runoff volume may increases up to +74.8% and +127.4%, respectively. The increase in runoff on the future may highly associated to the increase in precipitation over the basin. The average runoff change in magnitude and direction report results are similar compared to other studies report results indicated by Beyene et al. [9] and Abdo et al. [39].
In this study, we used different GCM model out puts and hydrological model, different models gives different results, particularly there is high biases in rainfall in climate models. Using of bias corrected data also adds its own uncertainty to our results [40].
This study result confirmed that, in the future average annual runoff increases due to climate change at the out let of each catchment that feeding the great Lake Tana on upper Blue Nile River. The increases in water availability will play significant benefits for small and large scale farmers for agricultural activities more over for water resources development projects. The climate change may contribute in a positive direction for crop water availability, if and only if farmers are adopted themselves to cropping schedule. However, precautionary notion has to be taken to control flooding on the flood plains.
The authors gratefully appreciate Dr. Iwan Supit (Wageningen University, ESS department) for providing NETCDF GCMs Climate data. Our gratitude also extends to Ethiopian Ministry of Water and Energy (MoWE), and Ethiopian National Meteorology Service Agency (NMSA) for providing hydro meteorological data.
