Research Article - (2013) Volume 1, Issue 2
Keywords: Extreme weather; Temperature; Precipitation; Future projection; Water resources; Agriculture, Morocco
Around the world, climate change can be observed more and more. Record temperatures were recorded from year to year in major cities. Heat waves and important recurring aunts floods have occurred in recent decades. These disorders weather hitting the planet causing dramatic affect humans and agriculture, so the economies touched. Given this situation, the concern is to predict what climate changes can we expect to be able to build a socio-economic adapted to this climate. Morocco is not immune, either, extreme weather events. Covering an area approximately 710,850 km2, it has nearly 3,500 km of coastline along its Atlantic and Mediterranean coasts. The four mountain ranges in the High Atlas, Anti Atlas, Middle Atlas and Rif give it a diverse geography and a subdivision into at least four climatic zones: the Mediterranean coastal area, the Atlas Mountains and steppe or Saharian climate zone south of the line of the watershed. The regions of the Atlantic and Mediterranean coasts receive most of their rainfall between November and March. Because of the terrain, they vary between 300 mm on the Mediterranean coasta little drier and more than 700 mm in the north-west of Morocco. In winter there is often above 2500 mm, a snow cover that persists more than six months a lot. The foothills of the Sahara receive less than 200 mm per year, mostly in autumn and spring. This study aims to examine trends in extreme temperatures and rainfall recorded in various weather stations over the past five decades and future projections of these trends over the next five decades. It also aims to assess the potential impact of these trends on water resources and threats to agricultural production and biodiversity [1].
Climate data were used, namely daily values of the precipitation and maximum temperatures (TX) and minimum (TN), spread over the period 1960-2004. The data from five weather stations (Agadir, Ifrane, Marrakech, Oujda and Tangier) and are representative of regional and climatic contrasts of Morocco. Used for the calculation of trends, the slope estimator based on Kendall’s criterion, since this method is robust and does not impose any particular distribution for residues. The estimated slope is admitted only if it is strictly less than the error [5%]. The trend is considered significant at 95% if the probability is less than 0.05. The indices of temperature and precipitation used in this study appear in Table 1. Percentiles of a statistical series are the 99 values (P1, P2,. ..., P99) of character who share the population into 100 parts of equal strength (Figure 1): -10% of the population, the character value is less than P10; in these southern - 90% of the population, the character value is less than P90, F(Pk)=k/100, 1
| Indexes | Defining |
|---|---|
| TX90e : Tmax > 90e percentile |
Number of days where maximum temperature is above the 90th percentile. |
| TX 10e : Tmax < 10e percentile |
Number of days where maximum temperature is below the 10th percentile |
| TXS: Tmax > Threshold |
Number of days where the temperature exceeds a threshold. |
| IVC: Tmax> 90th percentile for at least 3 consecutive days |
Number of "waves" or times during the summer season for three consecutive days, the maximum temperature was above the 90th percentile. |
| TN 10e Tmin < 10e percentile |
Number of days with minimum temperature is below the 10th percentile |
| TN 90e : Tmin > 90e percentile |
Number of days with minimum temperature is above the 90th percentile |
| IVF: Tmin <10th percentile for at least 3 consecutive days |
number of "waves" or times during the winter season for three consecutive days where the minimum temperature was below the 10th percentile. |
| PRCPTOT | Cumul annuel des précipitations. |
| R 10 mm | Number of days per year where total precipitation> = 10 mm |
Table 1: Indices of temperature and precipitation used.
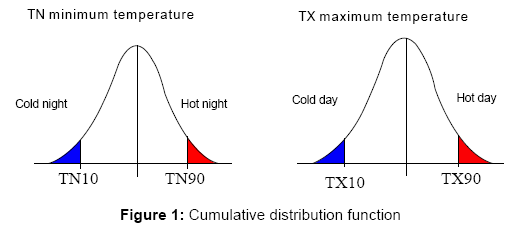
Figure 1: Cumulative distribution function.
Evolution and trends of climate change indices
Temperatures: To more easily compare results from one city to another and from one season to another, the trends have been expressed in number of days per 44 years. Thus, a positive trend reflected in an increase in frequency, and a negative trend to decrease. The trend values thus calculated are shown in Table 2.
| Indices | Trend during the period 1960-2004 ( days/44ans) | |||||
|---|---|---|---|---|---|---|
| JJA | TX90 TN90 TX10 TN10 IVC |
Agadir | Oujda | Marrak. | Tanger | Ifrane |
| 2.4 9.2* -11.6* -13.2* -0.14 |
8.3* 10.8* -8.2* -8.7* 1.28* |
-0.22 3.33 -6.76* -10.85* -0.34 |
10.77* 2.9 -7.85* -3.22 1.025 |
12.85* 11.64* -8.98* -7.17 1.52* |
||
| SON | TX90 TN90 TX10 TN10 |
-1.02 6.2* -2.5 -2.84 |
3.7 2.84 -1.21 -5.17 |
0 4.15 -3.81 -4.15 |
2 1.49 -3.22 0.4 |
2.38 3.41 -5.09* -0.96 |
| DJF | TX90 TN90 TX10 TN10 IVF |
7.53* 5.25* -9.81* -8.25* -0.562 |
2.17 2.37 -4.22* -2.64 -0.58 |
7.38* 6.67* -5.41* -5.11* -0.008 |
6.51* 3.29 -4.51* 3.2 0.88 |
10.3* 1.43 -5.79* -2.09 -0.29 |
| MAM | TX90 TN90 TX10 TN10 |
4.18 8.51* -7.99* -11* |
2.26 5.62* -6.99* -4.14 |
-0.03 4.29* -6.33* -11.8* |
3.36 -0.14 -8.38* -4.7 |
0.24 3.82 -6.77* -4.92* |
| TXS | -0.198 | 16.5* | 13.5* | 13.5* | 15.5* | |
Table 2: Trends in extremes of temperature on the period 1960-2004 and for the four seasons of the year.
Overall, we find, for the five stations and the four seasons of the year, a downward trend in the trend for the indices and TN10 TX10 while in the case of indices TN90 TX90 and the evolution of the trend is increasing. The indices of cold wave (ICW), the downward trend in the trend occurs in most cities of Morocco. Conversely, the heat wave indices (IHW) have seen their tendency to move upward rather in the northern cities of Morocco.
Analysis of indices of extreme cold (TN10, TX10): For the cold nights or days where the temperature is below the 10th percentile, except for Tangier, located in north-western Morocco, where a slight upward trend was held in the fall (+0.4 days/44 years) and winter (+3.2 days/44 years), there were four other cities for the frequency indices of the extreme cold (TN10) has shown a significant trend downward. This decrease varies between -0.96 days/44 years, in Ifrane, and fall to the lowest values, and -13.2 days/44 years in Agadir, in the summer, for values larger, indicating a significant reduction in the number of the cold nights especially in the southern Morocco (Figure 2a). For the cold days or days when the maximum temperature is below the 10th percentile, regardless of the season and for all cities, changing the frequency of extreme cold indices (TX10) have also shown a downward trend but significantly lower compared against the cold nights. This decrease varies between -1.21 days/44 years in Oujda, in the fall, for the lowest values, and -11.6 days/44 years in Agadir, in the summer, for larger values meaning, again, a sharp reduction in the number of the cold days especially in the south of Morocco (Figure 2b). We find, again, the same observation made for the cold nights: “These are cold days that are reduced further”.
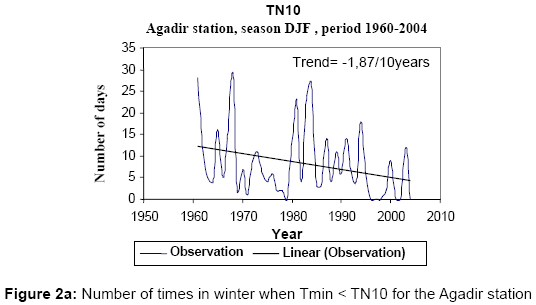
Figure 2a: Number of times in winter when Tmin < TN10 for the Agadir station.
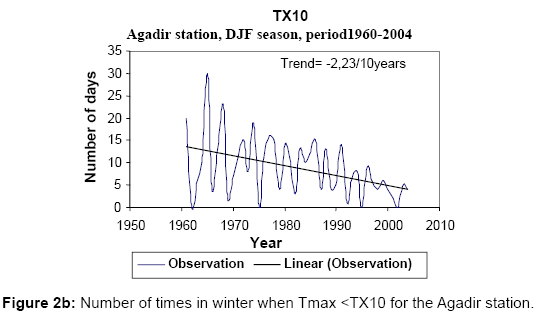
Figure 2b: Number of times in winter when Tmax < TX10 for the Agadir station.
Thus, for the cold nights and for the cold days, the sharp declines in trends, particularly in the Moroccan south areas, reduce the duration of the cold episodes, and promote, thereby warming the climate regions.
Analysis of indices of extreme heat (TN90, TX90): Contrary to what was previously seen for the indices of extreme cold, to warm nights or number of days when the minimum temperature is above the 90th percentile (TN90), excluding the city of Tangier, located in the northwest of Morocco, where there was a slight downward trend in spring (-0.14 days/44 years), the other four remaining cities shows a significant increase in trends. This increase varies between +1.43 days/44 years, in Ifrane, a mountain station with the Atlas in the winter, for the lowest values and +11.64 days/44 years also for the Ifrane higher values, but during the summer, meaning an increase in the number of the hot nights in particular in the northern of Morocco (Figures 3a and 3b). For the hot days or days when the maximum temperature is above the 90th percentile (TX90), except Marrakech, located in the central of Morocco, where a slight downward trend took place twice a year : during the summer (-0.22 days/44 years) and spring (-0.03 days/44 years), but also Agadir in the southern of Morocco, which has experienced a decline trend in the fall (-1.02 days/44years), other towns in the northern Morocco, they, have trended upward significantly. It varies between +0.24 days/44 years, to Ifrane in the spring to the lowest values, and +12.85 days/44 years, again in Ifrane, in the summer, for values larger, indicating an increase in the number of hot days especially in the north of Morocco (Figures 4a and 4b). We find, again, the same observation made earlier for warm nights, “it is the warm days that are growing more”.
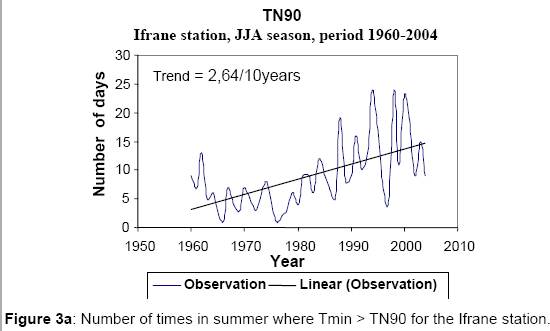
Figure 3a: Number of times in summer where Tmin > TN90 for the Ifrane station.
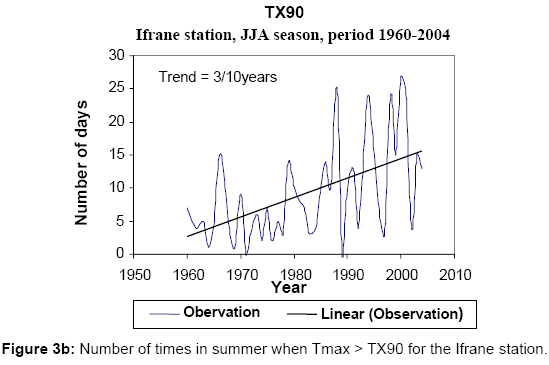
Figure 3b: Number of times in summer when Tmax > TX90 for the Ifrane station.
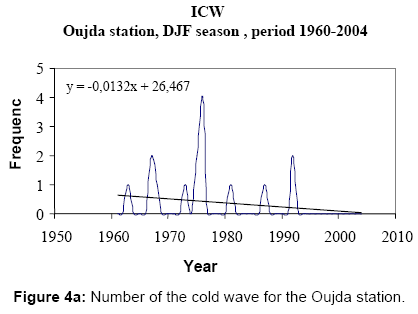
Figure 4a: Number of the cold wave for the Oujda station.
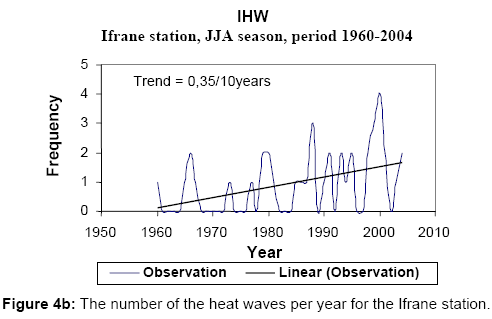
Figure 4b: The number of the heat waves per year for the Ifrane station.
Thus, for the warm nights like the hot days, the sharp increases in trends, particularly in the Moroccan northern areas, increase the duration of extreme heat and promote, thereby warming the climate in these northern regions.
Analysis of indices of cold waves (ICW): For ICW or number of times in the winter, where for three consecutive days, the minimum temperature was below the 10th percentile, regardless of the season and for all cities, the indices of the cold wave lagging in general, a slight downward trend (Figure 4a) with the exception of Tangier, located in the northwest of Morocco, where a slight increase in trend (+0.88 days/44 years), took place then in the winter. For the other four cities, Oujda, in the lead, with -0.58 days/44 years, followed by Agadir (-0.562 days/44 years), Ifrane (-0.29 days/44 years) and Marrakech (-0.008 days/44 years), meaning thereby a small decrease in the number of the cold waves.
Analysis of indices of heat waves (IHW): Unlike IVF, or IVC for the number of times or for three consecutive days during the summer, the maximum temperatures were above the 90th percentile of the five cities studied, only three of them showed a trend up, to proved significant : Ifrane and Oujda in the north-east and the Middle Atlas with respectively +1.52 and +1.28 days/44 years and the third largest city, Tangiers, located in north-west of Morocco, with an increase of +1.025 days/44 years but insignificant. (Figures placed in Appendix I). By contrast, cities in the south of Morocco, they, show a slight decline in non significant trend as in Agadir (-0.14 days/44 years), and Marrakech (-0.34 days/44 years) (Figure 4).
Thus, as indices of extreme cold and extreme heat, the downward trend even insignificant, registered in the southern regions of Morocco, for the ICW, and that the rise in the northern regions of Morocco, in the case of the IHW, reflect a possible migration of the warm southern regions to the north of Morocco. This increase in temperature, we have seen previously, was particularly pronounced in the recent years. But these upheavals are they due to chance or do we witnessing the early signs of climate change announced? It is clear that the number of extremely hot days will tend to increase with rising average temperatures. Indeed, the mathematical behaviour of the frequency distributions showed a typical distribution of the average summer temperature measurements (Figure 5).
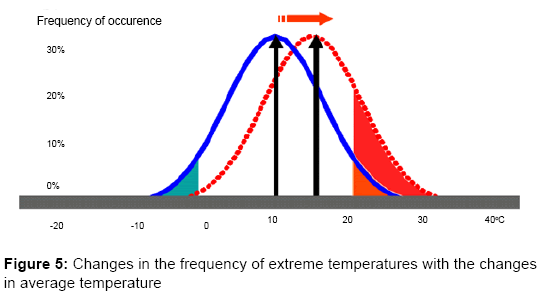
Figure 5: Changes in the frequency of extreme temperatures with the changes in average temperature.
It’s a classic curve, where values near the mean are more frequent and less frequent than extreme values. Under a warmer climate where the temperatures vary regularly, the curve keeps the same shape but is shifted to the right with considerable consequences. The number of summer with the high average rates temperatures between the two graphs. In addition, where there was a low value of temperature on the left curve, there is a high value on the right. In other words, an extremely hot summer could be repeated frequently in a warmer climate. It is a theoretical illustration, but that shows how a small change in mean temperature causes significant changes in extremes temperature [2]. Thus, the observations made on extreme temperatures are illustrative of climate change gaining ground.
Conclusion
The study of variations and trends in extreme temperature conducted over the period 1960-2004, at five weather stations, subject to climate indices, selected according to the seasons, shows, in general, the frequency of cold days has significantly decreased and that of hot days has increased significantly, indicating a slight warming of the climate in Morocco. This warming leads on the one hand, a decrease in the number of cold days, especially in areas south of Morocco, on the other hand, by increasing the number of hot days, especially in areas north of Morocco, indicating thereby, a possible migration of the arid regions of southern Morocco to the north of Morocco.
Precipitation
If the analysis of the precipitation indices, calculated according RCliDex, has found no significance of trends for the all stations, the approach of the precipitation indices measured “and PRCTOT R10mm” used in this study, however, shows a downward trend but not significant for most cities exception for the Oujda city where a significant reduction at 95% is noted. Annual changes over the period 1960-2004, differences in the average precipitation, are shown in Figure 6 for the Oujda city.
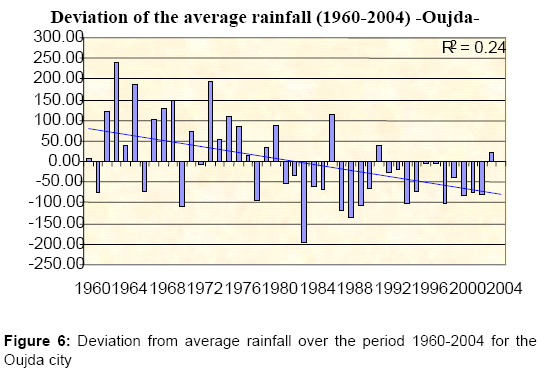
Figure 6: Deviation from average rainfall over the period 1960-2004 for the Oujda city.
We note in Oujda city, the majority of histograms are directed upwards from 1960 until 1982, and beyond that date, a reversal in the direction of the histogram occurs. In Figure 7 it has been shown, for the Oujda city, the annual variations in the number of days with precipitation totals above10 mm. It is seen that the trend line, which expresses a good approximation of the evolution of deviations of the average rainfall experienced a reversal trend: 12 days at the beginning of the period and 6 days in the end, a decrease by half during the past five decades, reflecting a net reduction of rainfall and the north-eastern of Morocco.
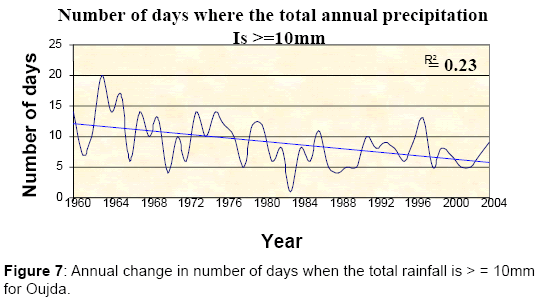
Figure 7: Annual change in number of days when the total rainfall is > = 10mm for Oujda.
For temperature, this study of trends in foreign exchange and precipitation in Morocco was on the following period 1960-2004. The Four Seasons of the Year, shows that the trends of simulated rainfall indices are not significant for all the stations, while the quantity rainfall, are not either significant for the majority of the cases with an exception in Oujda station where trend down seems to take place.
Forecasting future climate in Morocco
Future projections of climate in Morocco, our study is based were developed The Software MAGICC / SCENGEN.
The MAGICC model
MAGICC (Model for the Assessment of Greenhouse-Gas Induced Climate Change), consists to set of coupled cycle greenhouse gas emissions, climate and ice melt in one integrated package. It allows the use to determine the changes in the atmospheric concentration of the carbon dioxide (CO2), the average temperature of the air at the surface and the mean sea level between 1990 and 2100. These are the result of anthropogenic emissions of CO2, methane (CH4), nitrous oxide (N2O), halogenated hydrocarbons (eg., HCFCs, HFCs, PFCs) and sulphur dioxide (SO2). The years 1990 and 2100 are respectively the beginning and the end of such changes. This software is designed to: Compare, within the same application, the consequences on the global climate scenarios of two separate programmes. MAGICC appoint one of these scenarios “references”, which corresponds to the high values of the parameters and the other “political”, which corresponds to the low values (optimistic). It is possible to evaluate two different emissions scenarios.
Determine the sensitivity of the results of the different emission scenarios to changes in the parameters of the model. The basic interval of uncertainty is calculated implicitly. But it is possible to compare the results of a given emission scenario for the parameters of the model specified by the user and the results produced by the implied values parameter. The software offers 48 scenarios of the future greenhouse of gases and aerosols. For our study, we chose the P50 scenario, because it is the median of all the greenhouse gas emissions scenarios. The parameters of the model can be changed; it cites the model of carbon cycle, climate feedbacks on the carbon cycle, aerosol forcing, climate sensitivity, the thermohaline circulation, the vertical diffusivity and the melting snow. Thus, the nature of the output calculated and displayed by the MAGICC including one year “reference” for the outputs of the model on the basis of which changes in global mean temperature and mean sea level are calculated. A year “start” for the model outputs for which information on the diagnosis of the MAGICC is listed in the report files viewable from the main menu. And the year “end” to the model output, which informs on the MAGICC year, stops the calculations and reporting. The year 2100 is implied, but the user can opt for one year before or after (until 2500). However, the MAGICC only calculates the times, which correspond to the files of gas emissions, if these files go to 2100.
The SCENGEN model
SCENGEN is a scenario generator, global or regional climate change. This software consists of a database containing the results of many experiments of General Circulation Models (GCMs) and also observed climate data on a global scale. He manipulates these various data fields using the information on the speed and magnitude of the global warming that provides MAGICC and depending on the choice made by the user of the main characteristics of the climate scenarios. This model can be operated in conjunction with MAGICC, but it can also be used alone with a more limited number of functions. When running, the software from MAGICC, window or control panel is available to users at least five parameters: the first concerns the choice of variables to be displayed (average temperature or precipitation), the 2nd, concerns the choice of the scale “linear or exponential” and choose the period (monthly, seasonal or annual), the third, selection of a model among the 17 models available from GCM (Global Circulation Model), the fourth , refers to the choice of the place where you can view the results, the 5th, the projection year or date for which the calculations were made, dates are an average of 30 years around that date and scenario displays both scenarios (Reference and Strategy) used for the calculations and selected software and MAGICC, analysis of change in relation to the current situation defined as an average over the period 1961-1990 for temperature and for the period 1981-2000 precipitation.
Projection of the future climate
The first part to develop a climate change scenario process (CCS) deals MAGICC and the selection of the emission scenarios and the settings MAGICC. The medium scenario P50 was used, without changing the default settings of the MAGICC. The second step is to use the emission scenario B1 A1F and to define a wide range of change.
Projection that the average scenario P50
Under this scenario, by 2050, compared against the current situation, the average global temperature could rise from a low of 0.9°C and a maximum of 1.9°C, with an average of 1.4°C, CO2 concentrations would be associated with these projections, between 490 and 571 ppmv, with an average of 516 ppmv, and rising sea level (ENM) will be between 5 and 27 cm, the average would be15.5 cm. In 2100, the corresponding increases in temperature are respectively 1.9°C, 4.28°C and 2.9°C, corresponding ENM are respectively16.8 cm, 67.5 cm and 38.5 cm.
Projection scenarios as A1F and B1
In order to define a wide range of possible future global climate, given the uncertainty associated with future emissions of greenhouse gases, we also used emissions scenarios A1F and B1 to define an interval changes in mean temperature and concentrations of CO2 worldwide. The range of warming projected for these three choices, in 2050, evolves from 0.7 to 2.3°C, CO2 concentrations between 472 and 595 (ppmv), and ENM, for each scenario vary between 6.3 (B1 scenario) and 27.6 cm (scenario A1F). This gap will be wide in 2100, to oscillate between 1.2 and 5.8°C, CO2 concentrations between 503 and 1032 ppmv.
Climate change at regional level
Once MAGICC was executed, is performed after the development of the regional climate change scenarios for Morocco in 2050 by combining the software SCENGEN. For the profile selection warming, it was used in the development of an SCC is using several GCMs, or a scenario CSC with an average profile of GCMs. Both options have been successively used to examine the effects of CSC products for different regions of Morocco. Like all the observed climate data and available in SCENGEN is a resolution of 5° latitude / longitude, Morocco was divided into seven dials (Figure 8) which correspond to the climatic regionalization of the Kingdom.
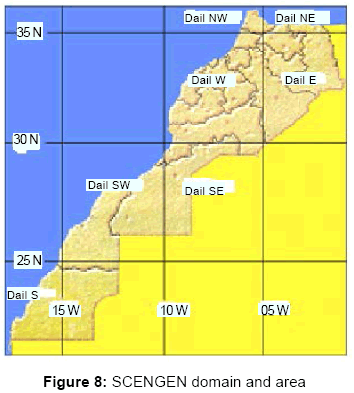
Figure 8: SCENGEN domain and area.
To represent the range, the future regional climate change was used, we have seen above, several models. Then proceeded to the determination of GCMs SCENGEN proposed, which exhibit extreme changes in temperature and precipitation in each region of Morocco. Table 3 summarizes the extreme variations in temperature and precipitation in 2050, according to the emission scenario P50 and in a climate sensitivity of 2.6°C for each dial.
| Regions | Variation of temperature | Variation of precipitations | ||
|---|---|---|---|---|
| Minimum °C | Maximum °C | Minimum (%) | Maximum | |
| NW | +1.5 | +2.8 | +7.6 | -31.1 |
| NE | +1.7 | +3,0 | -1.2 | -34.9 |
| W | +1.5 | +2.9 | -2.4 | -47.9 |
| E | +1.8 | +3.1 | -6.1 | -48.8 |
| SW | +1.4 | +2.4 | +15.6 | -31.3 |
| SE | +1.8 | +3.2 | +29 | -56.7 |
| S | +0.6 | +2.1 | +30.7 | -33.9 |
Table 3: Changes in 2050, extremes of temperature and precipitation for each quadrant according to the emissions scenario P50.
Analysis of results has yielded the following observations: Global warming called on all models but with low temperature dispersion within each region and widely dispersed across the regions
• A strong dispersion between the models for the simulation of the precipitation changes, both quantitative and qualitative.
• A difference of presentation, models used, extreme changes in the temperatures; to better to frame projections, in 2050, the future climate in Morocco next month, seasons and years, we opted for a composite profile of 17 profiles of GCMs.
Monthly cycle
To detect the changes in the likely changes following the months of the year, we plotted the histogram curves illustrating both the annual cycles of temperature over the period 1961 to 1990 and estimated the rainfall on the other from 1981 to 2000. The changes to the dial north-eastern of Morocco, the annual cycles of the temperature and precipitation averages, were represented in the Figures (placed in Appendix I) Figure 9. It notes that in 2050 the overall trend of the global warming will be widespread across Morocco, as the P50 scenario, with a magnitude greater in the northern regions of Morocco compared to southern regions of Morocco. The annual trend of warming in the north of Morocco, shows that the maximum of the temperature will be reached between the months of May and July, the minimum, it would appear between January and February. By cons, in southern Morocco, the maximum of the temperature is reached, from October to November but with lower amplitude. This decrease in the annual change of the temperature from west to east and from north to south of Morocco is due mainly to the ocean and latitudinal effect. As for the precipitation, large disparities both qualitative (drought and humidity) and quantitative (magnitude of change) will be perceived, however, the downward trends remain the most likely.

Figure 9: Annual cycles in mean temperature and precipitation - Dial NE Morocco.
Seasonal cycle
The seasonal distribution of potential changes in the temperature and precipitation arouse particular interest to the agricultural sector. To illustrate these changes, we used the composite profile as the P50 scenario. The evolution of changes in the temperature and precipitation compared to observed values, respectively, during the years 1961-1990 and 1981-2000, was represented in the Figure 10 (placed in Appendix I).
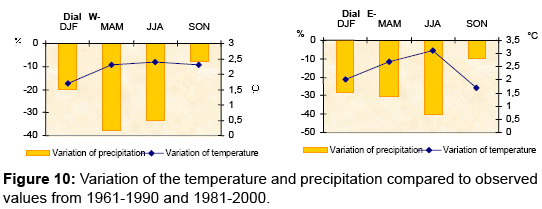
Figure 10: Variation of the temperature and precipitation compared to observed values from 1961-1990 and 1981-2000.
It can be seen here again in 2050, the overall trend in the global warming, will be on all Morocco. In general, the increase in Δtemperature would be very substantial during the summer in the northern of Morocco (Temperature=2°C), where the ocean and latitudinal effects reappear. But the maximum increase characterized mainly the eastern of Morocco (Temperature = +3.1°C). As for the southern Morocco (Temperature =1.7°C), the increase will occur in the fall (the reductions of precipitation, consistency does is demonstrated or the spatial scale or temporal scale. Indeed, the strong decrease during the winter in western of Morocco, substantial falls in the north-west of Morocco, and would be more intense in the east than in the west of Morocco. Thus, despite the fact that the maximal decrease in the precipitation would be recorded outside the rainy season, even small decreases in rainfall, though they had been projected during the winter, should have had an influence on the potential of water resources particularly in the north of Morocco.
Annual cycle
It is observed for the temperature, the increase was estimated between 1.7°C in the south of Morocco and 2.6°C in the north-east. As for precipitation, the reductions are estimated between 15 and 22% in northern Morocco and between 9 and 16 % in its southern part. The effect of latitude and the ocean is net in the north 30th parallel (Figure 11). The temperature elevation and instability resulting from lower precipitation contributes to this situation.
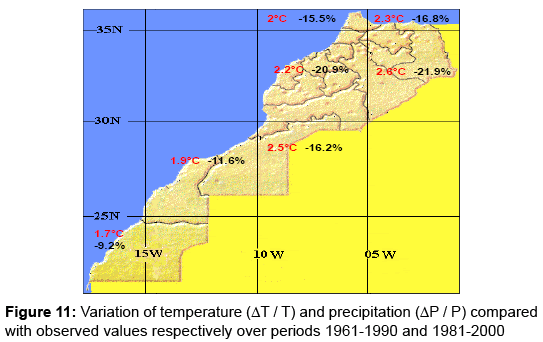
Figure 11: Variation of temperature (ΔT / T) and precipitation (ΔP / P) compared with observed values respectively over periods 1961-1990 and 1981-2000.
Water resources
Surface water: Were Represented in Figure 12 Overall contributions Recorded at all dams. Observed reductions in water yield at all the Existing dams Have Reached 20% When Comparing the Period To The 1970-2005 period 1940-2005. This reduction is estimated at 35% when compared To the Same Period The Period 1940-1970.
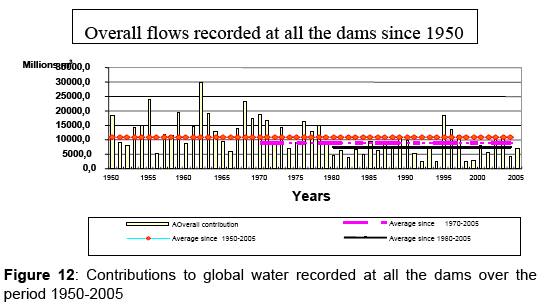
Figure 12: Contributions to global water recorded at all the dams over the period 1950-2005.
Groundwater: In Figure 13, have been shown some piezometric levels. The later recorded an alarming decline in most quifers: 40 in the Souss area, 30 m in the Haouz and 60 m in the Saïss area reflecting lower recharge. This reduction would result from the imbalance between water withdrawals and groundwater recharge of that aquifer.
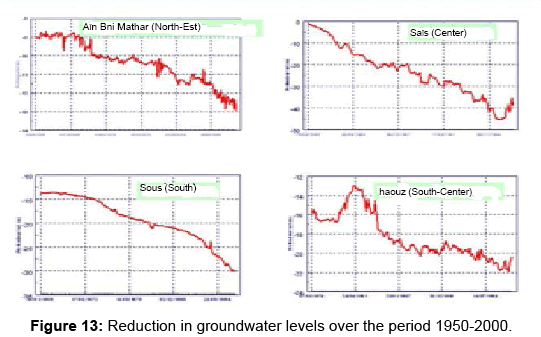
Figure 13: Reduction in groundwater levels over the period 1950-2000.
Future projection: The correlative analysis between rainfall recorded in three basins (Moulouya Sebu and Errachidia) and flow rates recorded at their outlets controlled by three major dams (Mohamed V and Hassan Idriss 1st Eddakhil) was used to estimate a reduction water supplies in 2050 from 14% to 20% for dams in question.
Agriculture: The study of the impact of climate change on agriculture has been the subject of two national communications [3]. The first, dated early 2001, involved essentially two key sectors of the Moroccan economy: agriculture and water resources for 2020. The second, dated late 2009, affected, in addition to agriculture and water, other sectors such as health, forests and climate in 2030. These impacts can be summarized as follows:
Crops grown-in will suffer the most from the effects of drought, seeing their grain production vacillate between 100 million quintals a year of good rainfall to 18 million quintals for dry year and yields between 17 quintals hectare and 4 quintals per hectare. This is especially the period of growth that would be affected and there is no doubt that the risk of dry periods will increase. - Reduction of the crop cycles; - The gap and reducing the growing period; - Increased risk of dry spells in the beginning, middle and end of the cycle of annual crops; - The disappearance of some crops such as canary grass and some trees as Argan; - The emergence of new diseases. - The impact on livestock is associated with the impact on agriculture; livestock production in Morocco is inseparable from crop production system.
Forest
The observable climate change has visible consequences on the forests with Moroccan kills standing trees, and sometimes a complete lack of germination of seeds of cedar. According to LEPOUTRE & PUJOS (1964), the germination can occur only when the temperature reaches a value of about 9°C to +10 °C for a period of at least 9 to 10 days for temperatures minimum of not less than -5 °C, until April or May, as is the case throughout the Middle Atlas. If one stands in the climatic conditions of the Middle Atlas cedar forests, especially in Ifrane, where the number of cold days has accused the spring, a decrease of -6.77 days/44 years (Table 2), we can estimate that the natural regeneration of this species will disappear in 65 years, hence the idea of finding an alternative solution to this problem. Flora fauna follows regressive in this dynamic and also shows his vulnerability.
Health and risk of reactivation of disease outbreaks
The health vulnerability related to climate change in Morocco, can be explained by the presence of endemic foci of disease may be exacerbated by climate change, including malaria, bilharzia, typhoid and cholera [4]. Although efforts in the fight against these diseases are deployed, the risk of reactivation as a result of climate change is always possible.
Coastal
The impact of CC on the coastal environment has been very little studied. A study conducted by BAZAIRI Synthesis [5] showed that the two environments that suffer the most vulnerable are: the first is low-lying coastal plains and beaches, but also coastal wetlands such as estuaries where the slightest rise sea level (ENM) has a direct impact on erosion and / or flooding of coastal wetlands (lagoon of Nador Lagoon Smir), mouthpieces (Moulouya) and the beaches of the Mediterranean Morocco (Tetouan Mdiq , Restinga-Smir, Al Hoceima, Cala Iris, Nador and Saidia) causing losses of large areas of farmland causing, thereby, reduced agricultural productivity. It also causes sodification soil and groundwater salinization, leading to a shortage of drinking water especially in the central and eastern Mediterranean coast of Morocco, threatens the port infrastructure (Tangier, Nador, Al Hoceima) and resorts adjacent to the coast (Bay of Tangier, a seaside resort of Saidia), and is responsible for the proliferation of phytoplankton and the emergence of new diseases, particularly in aquaculture sites located offshore Mdiq. Added to indirect impacts that affect the socioeconomic crises including declines in activities in the fisheries sector where declines in catches are considered in relation to the CC, and services continued to decline attractiveness of coastal areas that would be affected by heat waves as is the case of resorts Saidia and Tangier. The second, where the impact of climate change on ecosystem vulnerability manifests itself differently in different settings: ENM only especially for coastal habitats of Mediterranean Monk Seal by loss of small Moroccan beaches inside the caves used as breeding; across the Mediterranean as in the case of species of flora and fauna of the southern areas, where the conditions necessary for their move up the shore does not arise. So, for example, the giant limpet (Patella ferruginea) and vermetid (Dendropoma paetreum) and changes the geographical distribution of marine invertebrate species of coral (Anthipathella Wallaston) in the region of Ceuta (Dendrophyllia Laborel) in the region of Cabo Negro respectively Macaronesian and limited distribution between Mauritania and Ghana including the Canary Islands, have been encountered in the Mediterranean Sea, too, the red coral (Corallium rubrum), the mollusk bivalve (Lithophaga lithophaga) and cnidarian (Paramuricea clavata) are sensitive to climate; Same in marine seagrass beds (Zostera noltii, Cymodocea nodosa) are relatively more abundant on the Mediterranean coast of Morocco in relation to seagrass Posidonia oceanica, which them are known only around Chafarinas Islands; Biological invasions of ecosystems hosting a significant biodiversity on the Mediterranean coast (the lagoon of Nador, the mouth of Moulouya and coastal areas of Al Hoceima and Tetouan) although many species and habitats are protected and identified as “hot spots” of pollution; significant change in phenology of avian migration of wetlands.
In this study, we examined the evolution of the climate of Morocco on the basis of extreme temperatures (maximum and minimum) through the hot and cold extreme (TX90, TN90, TX10, TN10, IVF, IVC) and precipitation through indices and R 10mm PRCTOT the four seasons of the year on the period 1960-2004 in five cities. The two parameters examined, the temperature is the one with the clearest effect. Indeed, for the temperature, and for the five study sites for the four seasons of the year, the frequency of hot days per year have increased in recent years and the frequency of cold days decreased, reflecting a slight warming Morocco. For precipitation, if no clear conclusion has been reported by this study about their changing trends for all stations surveyed, the approach of deviations from the mean rainfall, revealed a statistically significant rainfall in the only station in Oujda. Climate projections, in 2050, at the regional level were conducted using the new software version MAGICC / SCENGEN seventeen coupled general circulation models (GCMs), as the average emission scenario P50, with a sensitivity average climate (2.6°C) and a mesh SCENGEN. The projection results for the whole country showed a marked warming trend of about 1.7°C to 2.6°C, whereas for precipitation, the trend is down about 15 to 22% in the northern part of Morocco and between 9 and 16% in the south. For cons, the reduction in annual rainfall is more important: it varies between 6 and 13% in the north and between 0.7 and 8% in the south. Moving to the north of the arid zone; we recommend the following studies: Looking for a possible correlation between the indices of extreme temperature and sea surface; the use of regional models for projecting future climate of Morocco.
