Research Article - (2012) Volume 3, Issue 9
Objective: To elucidate how iron deficiency anemia influence the natural history of diabetes mellitus and to study the effect of iron indices, mitochondrial oxidative capacity and oxidative stress on insulin resistance and secretion in established cases of type 2 diabetes.
Research design and methods: A comparative cross-sectional study was conducted in 40 healthy controls, 40 iron deficiency anemia (IDA), 40 type 2 diabetes without iron deficiency anemia and 40 type 2 diabetes with iron deficiency patients. All the Patients were BMI, age and sex matched. Glycemic indices, fasting serum insulin levels, iron indices, inflammatory markers, Total Antioxidation Capacity (TAOC), Mitochondrial Oxidative Capacity (MOC) were analyzed.
Results: In iron deficiency anemia there was decrease in MOC, TAOC and HOMA B (p<0.001). Iron was positively correlated with MOC which in turn was positively correlated with HOMA B. In type 2 diabetes there was increase in free iron, ferritin, transferrin, TNF-alpha and HOMA IR (p<0.001) and decrease in TAOC, MOC and HOMA B. In type 2 diabetes with IDA there was decrease in iron, ferritin HOMA-IR (p<0.001), TNF- α (p<0.05) and increase in IL-6(p<0.05) as compared to type 2 diabetes without IDA.
Conclusion: Iron deficiency anemia is associated with decreased mitochondrial oxidative capacity and insulin secretion with no change in insulin sensitivity. This prompts us to question whether chronic IDA predisposes to early development of diabetes especially where both diabetes and IDA are highly prevalent. Both diabetes and iron deficiency anemia can together worsen the oxidative stress and the pathophysiology of diabetes mellitus despite improvement in insulin resistance.
IDA: Iron Deficiency Anemia; TAOC: Total Anti Oxidation Capacity; MOC: Mitochondrial Oxidative Capacity; TNF-α: Tumor Necrosis Factor Alpha; IL-6: Interlukin-6; HOMA B: Homeostasis Model Assessment Beta Cell Secretion; HOMA IR: Homeostasis Model Assessment Insulin Resistance
Understanding how iron deficiency anemia influences glucose metabolism and insulin kinetics will be highly relevant especially in the populations where both iron deficiency anemia and diabetes are widely prevalent.
Increased iron stores have been found to predict the development of type 2 diabetes mellitus, while iron depletion was protective [1]. Iron induced damage might also enhance the development of chronic diabetes complications. Oxidative stress and inflammatory cytokines influence these relationships in amplifying and potentiating the initiated events [2].
Iron depletion has been demonstrated to be beneficial in coronary artery responses, endothelial dysfunction, insulin secretion, insulin action and metabolic control in type 2 diabetes mellitus [2]. All these studies show that iron is intimately linked to human pathophysiology.
Regulation of iron uptake by insulin occurs in parallel with its effects on glucose transport [3]. Insulin causes a rapid and marked stimulation of iron uptake by fat cells, redistributing transferrin receptors from intracellular membrane compartments to the cell surface. Insulin is also responsible for the increased ferritin synthesis in cultured rat glioma cells [4]. Studies have shown that iron influences insulin action, by interfering with insulin inhibition on glucose production by the liver. Hepatic secretion and metabolism of insulin is reduced with increasing iron stores, leading to peripheral hyperinsulinemia [5].
Mitochondria is one of the most important site for iron based enzymatic machinery involved in oxidative metabolism of fuels like glucose and lipids. They integrate and generate metabolic signals, there by coupling glucose recognition and insulin secretion [6]. Mitochondrial oxidative stress and mitochondrial oxidative damage have been implicated in the etiology of several diseases. Hence optimal mitochondrial function is essential for optimal beta cell function.
Correlation studies between iron metabolism and mitochondrial oxidative markers and their influence on glucose metabolism, insulin secretion and action, especially in the setting of iron deficiency anemia are lacking in the literature. Hence this type of study was planned to investigate the role of iron deficiency in type 2 diabetes mellitus cases.
A comparative cross-sectional study involving age, sex and BMI matched subjects divided into four groups.
Group I comprised of 40 healthy controls, Group II had 40 iron deficiency anemia patients, Group III, 40 newly diagnosed type 2 Diabetes without iron deficiency anemia and Group IV, 40 newly diagnosed type 2 Diabetes with iron deficiency anemia patients. All the patients included in the study were of age group between 20 to 50years of age, sex and BMI matched. Due care was taken to include patients with normal BMI between 19 to 23.8 kg/m2 as higher BMI may increase insulin resistance and interfere with glucose regulation.
The study was approved by the Osmania Medical College Ethical committee, and the work was carried out in the Department of Endocrinology, Osmania General Hospital, in collaboration with Sai’s Institute of Endocrinology, Banjara hills Hyderabad, A.P, India.
All the patients and healthy controls were enrolled after informed consent was obtained, and thorough physical and medical examination was done to rule out any acute or chronic systemic illnesses. All the patients were screened for normal LFT, RFT, lipid profile, TSH, and stool for occult blood. Subjects with history of smoking, alcoholism, steroid medication and pregnant women were excluded from the study.
In healthy control group, oral glucose tolerance tests, HbA1c tests were performed to rule out diabetes. Complete blood picture and iron indices were done to exclude iron deficiency anemia patients.
Iron deficiency anemia group with and without diabetes were selected based on WHO standards of hemoglobin concentration less than 12 g/dl in females and less than 13 g/dl in males, and with microcytic and hypochromic slide picture and all these patients were found to have low iron and ferritin levels as compared to controls. Diabetes groups with and without iron deficiency anemia were selected based on HbA1c and fasting blood glucose according to ADA diagnostic criteria. All the diabetes patients enrolled in the study were newly diagnosed and were not on any antidiabetic medications at the time of the study. None of the subjects in all four groups were on iron supplementation (Table 1).
| GROUP 1 | GROUP II | GROUP III | GROUP IV | |
|---|---|---|---|---|
| NUMBER | 40 | 40 | 40 | 40 |
| AGE(yrs) | 35±15 | 35±15 | 35±15 | 35±15 |
| BMI (kg/m2) | 21.5±2 | 22±1.8 | 22±1.8 | 22±1.8 |
| SEX | 23M/17F | 20M/20F | 20M/20F | 20M/20F |
Table 1: Anthropometric characteristics of study samples.
Collection of blood sample
Under aseptic conditions, blood samples (12 ml) were drawn from antecubital veins of all the subjects. 4 ml blood was transferred into sodium citrate vacutainers for the separation of WBC for the isolation of mitochondria and to assess the activity of complex IV cytochrome C oxidase. 2 ml of blood sample was collected in EDTA vacutainers for complete blood picture and HbA1C, 6 ml of blood sample was transferred into plain vacutainer, was allowed to clot for 30 minutes and then centrifuged at 2000 rpm for 15 minutes for clear separation of serum. Serum was taken for the analysis of iron indices, inflammatory markers, and insulin. Fasting blood sugar was estimated from the serum, separated in fluoride vacutainers.
Separation of WBC
4 ml of the whole blood was collected in sodium citrate vacutainers, diluted in 1:2 ratios with normal saline. The diluted blood was layered over a HI media’s Hisep LSM isoosmotic, low viscosity medium containing polysucrose and sodium diatrizoate adjusted to a density of 1.0770 ± 0.0010 g/ml solution [7] and centrifugation was done at 2000 rpm for 20 minutes. Erythrocytes get sedimented and a band of mononuclear leukocytes above Hisep LSM was formed which was aspirated by using a clean and dry Pasteur pipette. Aspirated layer of mononuclear leukocytes was washed twice with phosphate buffer of pH 7.6 and centrifuged at 1500 rpm. The collected WBC pellet was further processed for the isolation of mitochondria and mitochondrial activity assay (Cytochrome C oxidase activity Assay measured at 550 nm in 10UV genesis spectrophotometer). Kits were purchased from Biochain Institute (CA, USA).
Inflammatory markers Serum TNF alpha and IL-6, ferritin and transferrin were measured by Enzyme Linked Immunosorbent Assay (ELISA) kits from immunetech. Total antioxidant capacity was measured by ELISA kits purchased from Caymans chemical company (MI, USA). Insulin was measured by Chemiluminisence Immune Assay (CLIA) method, HbA1C by HPLC method, glucose by glucose oxidase and peroxides (GOD-POD) method and iron and TIBC by Ferrozine method. All other chemicals were of the highest purity commercially available. HOMA IR and HOMA B were calculated from fasting sugar and fasting insulin levels. HOMA IR=fasting insulin (μIU/ml) multiplied by fasting glucose (mmol/L) divided by 22.5 and HOMA B=20 multiplied by fasting insulin (μIU/ml)-3.5 divided by fasting glucose (mmol/L) [8,9].
Statistical analysis
All values of analysed parameters were expressed as mean ± SD. Statistical analysis was performed using the Statistical Package for Social Sciences (SPSS/PC; SPSS-9, Chicago, USA). One-way analysis of variance (ANOVA) was used to compare the mean values in the four groups followed by multiple comparison post-hoc tests. Pearson’s correlation was applied to correlate between the parameters. A p value of <0.05 was considered statistically significant.
Iron deficiency anemia as compared with healthy control group
There was significant decrease in iron indices free iron, ferritin, and transferrin saturation (p<0.001), total antioxidation capacity (p<0.001), mitochondrial oxidative capacity (p<0.001), beta cell secretion HOMA B (p<0.001), insulin (p<0.001). Significant increase was found in transferrin and total iron binding capacity (TIBC) (p<0.001). However no statistical significant changes were observed in HOMA IR, glycemic indices fasting blood sugar and HBA1C, inflammatory markers IL-6 and TNF-α. On Multiple comparison analysis in iron deficiency anemia group, iron was positively correlated with MOC which inturn is positively correlated with HOMA B (Figures 1 and 2).
Type 2 diabetes Mellitus without iron deficiency anemia in comparison with controls
Significant increase was seen in iron indices: free iron (p<0.001), transferrin saturation (p<0.001), transferrin (p<0.001), glycemic indices FBS (p<0.001), HbA1C (p<0.001), HOMA IR (p<0.001) and inflammatory markers TNF alpha (p<0.001). Significant decrease was observed in HOMA B (p<0.001), TAOC (p<0.001), MOC (p<0.001). However no significant change was found in IL- 6 and TIBC in type 2 diabetes without IDA patients.
Type 2 Diabetes mellitus with IDA as compared with type 2 Diabetes mellitus without IDA
Significant decrease was seen in iron (p<0.001), transferrin saturation (p<0.001), ferritin (p<0.001), fasting blood sugar (p<0.001), HbA1C (p<0.001), HOMA IR (p<0.01) and TNF alpha (p<0.05). Significant increase was found in Interlukin-6 (p<0.05). However no significant change was observed in mitochondrial oxidative capacity, beta cell secretion, TAOC, transferrin and TIBC. But in comparison with control group, diabetes mellitus with IDA patients had a significant decrease in mitochondrial oxidative capacity, beta cell secretion, and total antioxidation capacity and increase in TIBC (p<0.001) (Table 2).
| PARAMETER | GROUP I | GROUP II | GROUP III | GROUP IV |
|---|---|---|---|---|
| HEMOGLOBIN( g/dl) | 14.7±1.92 | *9.19±1.54 | 13.34±1.30 | **9.44±1.81 |
| IRON (µ/dl) | 93±30 | *58±19 | *114.79±18.8 | **68.52±19.63 |
| TIBC (µ/dl) | 337±56 | *362±64 | 318.87±73.14 | 315.12±56.33 |
| TRANSFERRIN SATURATION % | 28±9.3 | *16.74±6.29 | *38.19±11.50 | **22.24±7.65 |
| FERRITIN (ng/ml) | 55.5±22 | *17±4.3 | *103.67±50.09 | **37.92±23.91 |
| TRANSFERRIN (ng/ml) | 308±22 | *339±18 | *348.61±24.93 | 350.08±29.32 |
| INSULIN (µU/ml) | 15.23±2.67 | *8.67±2.67 | *24.98±21.35 | **19.09±12.37 |
| HbA1C (%) | 5.72±0.63 | 5.17±1.06 | *7.85±2.24 | **6.46±2.07 |
| FASTING BLOOD SUGAR (mg/dl) | 84.3±8.75 | *69.91±11.84 | *159.53±87.63 | **120.9±31.30 |
| HOMA IR | 1.81±0.66 | 1.68±0.46 | *11.6±10.46 | **5.95±5.13 |
| HOMA B | 172.40±79 | *48.52±16 | *58.38±45.43 | 55.49±34.09 |
| INTERLUKIN-6 (ng/ml) | 4.5±3.5 | 6.54±4.6 | 3.36±2.66 | **19.30±7.96 |
| TUMOR NECROSIS FACTOR ALPHA (ng/ml) | 10.5±5.39 | 14.28±4.7 | *29.06±8.90 | **24.33±19.89 |
| *TOTAL ANTIOXIDATION CAPACITY (mMol/L) | 7.38±2.4 | *4.01±1.13 | *3.43±0.89 | 3.78±1.21 |
| MITOCHONDRIAL OXIDATIVE CAPACITY ( nMol/min/ml) |
465±187 | *158±65 | *204±63 | 179±70 |
Table 2: Biochemical characteristics of study samples.
Our study highlights the following important observations:
1. In IDA, low free iron lead to decrease in beta cell secretion and mitochondrial oxidative capacity thus reflecting pathophysiologic relation between iron metabolism and beta cell secretion.
2. In T2DM without IDA significantly increased iron, TNF alpha and insulin resistance (HOMA IR) were observed. Conversely, mitochondrial oxidative capacity and TAOC were significantly decreased indicating oxidative stress. This clearly suggests a link between free iron and pro-oxidant, oxidative stress, inflammatory markers, insulin resistance and beta cell secretion in the pathogenesis of T2DM.
3. In T2DM with IDA marked improvement in insulin sensitivity correlated well with a significant increase in IL-6.
4. Significant decrease in mitochondrial oxidative capacity was consistently observed in all 3 groups compared with control group.
Iron deficiency anemia versus controls
Effect of mitochondrial oxidative capacity on beta cell secretion: In iron deficiency anemia group we found significant decrease in free iron, which positively correlated with mitochondrial oxidative capacity. We measured the activity of cytochrome c oxidase which reflects the mitochondrial oxidative capacity (Figure 1).

Figure 1: Multiple comparison analysis in Group II, Iron is positively correlated with mitochondrial oxidative capacity (p<0.01).
Cytochrome c oxidase is an iron based complex IV enzyme of the electron transport chain which catalyses the terminal oxidation causing the transfer of two electrons one at a time to molecular oxygen, where there is a maximum chance for the formation of oxygen free radicals [6,10]. Optimal balance between oxidant and antioxidant system is maintained within the normal mitochondria. Thus decrease in iron leads to decrease in the activity of the cytochrome c oxidase and decrease in mitochondrial oxidative capacity in the iron deficient state.
In IDA decrease in TAOC has been demonstrated vs. controls in our study. This in addition to the decreased cytochrome c oxidase activity contributes to the imbalance between oxidants and antioxidants within the mitochondria and further diminishes the mitochondrial oxidative capacity.
In this group the measured MOC positively correlated with insulin secretion i.e., HOMA B (Figure 2). Mitochondriae integrate and generate metabolic signals by coupling glucose recognition to insulin secretion [6]. Normally glucose oxidation within the mitochondria produces ATP, and increases ATP/ADP ratio. Likewise within the beta cells ATP/ADP ratio is primarily regulated by the mitochondrial oxidative capacity. Increase in ATP/ADP ratio contributes to inhibition of potassium channels, which lead to plasma membrane depolarization, opening of voltage gated calcium channels, calcium influx and secretion of insulin. This explains the finding that decrease in MOC is positively correlated with decrease in insulin secretion i.e. HOMA B. Hence a functionally integral electron transport complex is essential for the optimal function of mitochondria [6].

Figure 2: Multiple comparison analysis in Group II, Mitochondrial oxidative capacity is positively correlated with HOMA B (p<0.01).
Effect on insulin resistance: Low iron status in iron deficiency has been reported to improve insulin secretion and peripheral action [3,11,12]. In contrast to these findings our study demonstrated decreased insulin secretion and no significant change in insulin resistance in IDA.
Also in other studies similar levels of glycemia in IDA was associated with higher concentrations of HbA1c [13] but we found no significant change in HbA1c and inflammatory markers such as IL-6 and TNF alpha in IDA vs controls.
Type 2 diabetes mellitus without IDA versus controls
The observations of increased iron and decreased MOC in T2DM in our study affirms the earlier works which indicated iron induced damage to mitochondrial DNA and impaired mitochondrial function in diabetes mellitus [2,5,10,14,15]. Further glucose recognition defect of pancreatic cells in diabetes also contributes to decreased glucose oxidation and decreased insulin secretion [16].
Human Studies of Swaminathan et al. [16] and Dandona et al. [17] shows that iron caused hyperinsulinemia and insulin resistance by inhibition of insulin internalization and action. Increased free iron and ferritin levels correlated well with the significantly increased insulin resistance in our study (Figures 3 and 4).

Figure 3: Comparison between Iron and Homa B in four groups.

Figure 4: Comparison between Iron and Homa IR in four groups.
Other iron indices such as transferrin and ferritin levels were found to be significantly elevated in this group. Transferrin is the binding protein responsible for the transport of iron and is upregulated in iron deficiency anemia to maximize the efficiency of iron transport from the intestine to the tissues. Similar upregulation of transferrin occurs in diabetes mellitus even in the presence of adequate iron due to the decreased ability in transferring iron to tissues consequential to decreased binding of ferrous iron to glycated transferring [18]. Fujimoto et al. found glycation of transferrin decreases its ability to bind ferrous iron there by increasing the pool of free iron and stimulation of ferritin synthesis [19]. Glycated holotransferrin is additionally known to facilitate the production of free oxygen radicals, such as hydroxide, that further amplify the oxidative effects of iron [19].
Type 2 diabetes mellitus and oxidative stress
Significantly decreased TAOC which reflects increased oxidative stress has been documented in all the three groups in comparision to the controls.
Elevated free iron and ferritin levels in addition to the significantly decreased TAOC contributes to the oxidative stress by formation of reactive oxygen species via Fenton and Haber-weiss reaction [20,21].
 (1)
(1)
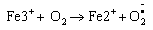 (1)
(1)
Netreaction
 (1)
(1)
Cussimanio et al. [22] found that in diabetes mellitus, hyperglycemia induced glycation of hemoglobin and myoglobin leads to the formation of advanced glycated end (AGE) products on lysine residues of the protein chain which also causes the destruction of heme group and release of iron from these two proteins [22-24]. Free iron released further enhances the process of AGE formation through Fenton reaction. This circle reaction promotes oxidative stress and damage which lead to the development of diabetic complications.
In diabetes mellitus in addition to oxidative stress caused by AGEs [11,12,20-22,25], increased shunting of glucose through the polyol (sorbitol), pathway also results in enhanced production of superoxide anion. Enzymatic sources of reactive species in diabetes include nitric oxide synthase, NAD(P)H oxidase and xanthine oxidase [26,27]. The reactive oxygen species and reactive nitrogen species generated by the enzymatic and nonenzymatic reactions contribute to the decreased total antioxidation capacity.
Increased oxidative stress correlates with increased insulin resistance and decreased beta cell secretion in diabetes mellitus by the activation of stress sensitive intracellular signaling pathways like nuclear factor nf-kβ, p38 mitogen activated protein kinases, hexosamines [28-30]. Studies have shown that in vitro, ROS and oxidative stress lead to the activation of multiple serine kinase cascades. The insulin signaling pathway offers a number of potential targets of these activated kinases, including the insulin receptor and the family of insulin receptor substrate protein (IRS-1 and 2). An increase in serine phosphorylation decreases the extent of tyrosine phosphorylation and is consistent with the attenuation of insulin action [31,32].
Type 2 Diabetes mellitus and inflammatory markers
Type 2 Diabetes mellitus and Inflammatory markers, significantly increased TNF-α observed in this group correlated well with increase in HOMA IR (Figure 5). Stephens JM et al. in their work elucidated mechanisms underlying the TNF-α induced serine phosphorylation of IRS-1 which inturn inhibits the insulin receptor to autophosphorylate and its ability to phosphorylate on tyrosine residues, which are its major substrate. TNF-α reduces the transcriptional activity of glut-4 gene in murine adipocytes, and reduces mRNA transcription of a number of relevant proteins required for the insulin stimulated glucose transport. This includes GLUT-4, IRS-1, and insulin release from pancreatic beta cells [33-35].

Figure 5: Comparison between inflammatory markers in group III and IV.
T2DM with IDA compared to T2DM without IDA
Statistically significant decrease in free iron, TNF-α and insulin resistance was observed in this group. Decrease in insulin resistance can be explained due to the decrease in serum iron and ferritin levels. Studies of Facchini [11] and Hua et al. [12] have shown that glucose turnover increases in iron deficiency, and this increase is primarily due to enhanced peripheral insulin responsiveness [3].
In contrast to other studies which indicated that low iron status improved insulin secretion and peripheral action [3,36,37], increase in Interlukin-6 as documented in this group of patients in our study showed a good statistical correlation with decrease in insulin resistance compared with patients of diabetes without anemia (Figure 6).

Figure 6: Comparison between Homa IR and IL-6 in group III and IV.
These findings are supported by the observations of Pedersen and Febbraio [38] that acute IL-6 infusion in different mice and human studies increases insulin sensitivity in skeletal muscle, but no significant change in insulin secretion.
Significant improvement in glycemic parameters, both fasting blood sugars and HbA1c observed in patients with DM and IDA in comparision to the patients of DM without IDA and can be explained on the basis of improvement in insulin sensitivity.
(1) Iron deficiency anemia without diabetes is associated with decreased mitochondrial oxidative capacity and decreased insulin secretion with no change in insulin sensitivity. This observation is highly relevant especially in the population with high prevalence of both diabetes mellitus and iron deficiency anemia and prompts us to question whether chronic iron deficiency anemia predisposes to the early development of diabetes mellitus.
(2) The improved insulin resistance and glycemic status in type 2 diabetes with iron deficiency anemia may give a falsely gratifying impression about the status of diabetes mellitus. Conversely, both diabetes and iron deficiency anemia can together worsen the oxidative stress and pathophysiology of diabetes mellitus despite improvement in insulin resistance.
(3) Injudicious supplementation of iron in type 2 diabetes mellitus without iron deficiency anemia may aggravate oxidative stress and deterioration of glycemic status. Large correlation studies are needed to establish as to what extent iron indices affect the mitochondrial oxidative capacity and oxidative stress and influence the pathophysiology of diabetes mellitus.
We acknowledge Dr. Vishnu Vardhan, Head of statistics department, National Institute of Nutrition, Hyderabad, for helping us in making the statistical report of the data and all the patients who made this study valuable through their participation in this study.
