Research Article - (2023) Volume 11, Issue 3
Extensive land use changes and soil management practices are the result of rapidly increasing human populations and their needs and/or uses of the land for various agricultural activities and for other purposes. This study was carried out with the objective of evaluating the effects of different land use practices on socioeconomic activities in Taltalle watershed, West Shoa. Field observation and sample collection were carried out with the help of topographic map of the study area. Four land use types were identified. There is a rapid change of land use land cover in the study area due to its proximity to Ambo Town, land degradation, population growth, climate change, etc. Knowing of this fact, the present study was initiated and conducted in Taltalle watershed area of Ambo, Central Ethiopia, with the objective of assessing the impact of land use land cover on socio-economic activities.
Land use • Land cover • Land cover change • Socio economic • Activities
Background and justifications
One of the most important components of socioeconomic growth is land use and land cover [1]. It is directly connected to human directed activities and related to political and socioeconomic functions in specific landscapes and/or regions [2].
According to the international geosphere biospehre program and the international human dimension program land cover refers to the physical and biophysical cover over the surface of earth, including distribution of vegetation, water, bare soil and artificial structures whereas land use refers to the intended use or management of the land cover type by human beings such as agriculture, forestry and building construction. Land use is obviously constrained by environmental factors such as soil characteristics, climate, topography, and vegetation [3]. It also reflects the importance of land as a key and finite resource for most human activities including agriculture, industry, forestry, energy production, settlement, recreation and water catchments and storage [4]. The anthropogenic changes in land use have altered the characteristics of the Earth’s surface, leading to changes in soil physicochemical properties such as soil fertility, soil erosion sensitivity and content of soil moisture and these changes may be caused by soil compaction that reduces soil volume and consequently lowers soil productivity and environmental quality [5].
Over the years, when land use changes from one form to other, soil biodiversity and its physical properties that control water movement and retention in the soils are largely affected due to human, animal activities as well as use of machine for soil tillage purposes [6].
The rapidly increasing human populations and their needs and/ or uses of the land for various agricultural activities have brought about extensive land use changes and soil management practices throughout the world [7]. Soil physical and chemical properties play a central role in transport and reaction of water, solutes and gases in soils, their knowledge is very important in understanding soil behaviour to applied stresses, transport phenomena in soils, hence for soil conservation and planning of appropriate agricultural practices [8].
A wide range of drivers associated with social, biophysical, environmental, economic and technological factors lead to Land Use/Land Cover (LULC) changes in different parts of the world [9]. The drivers of these changes may be well known, such as demographic change, industrial development, agricultural expansion, urbanization, global market forces, and climatological change, such as drought and rainfall variability, or they may also involve interactions of institutional or cultural impacts. These drivers have triggered drastic LULC conversions by substituting one type of LULC with another [10-13]. Through these processes, the pattern, structure and function of the natural landscape are inevitably altered, thus consequently influencing the global environment [14]. Particularly, the socioeconomic drivers are more intense than the physical drivers of these processes [15]. Understanding these factors is vital for forecasting future LULC dynamics by using models or for the design of management strategies and policies for the sustainable management of land resources [16,17].
According to Ethiopia was covered with substantial amount of forest until the 1940’s that is 41.2 million ha or 37% of the total land of the country, which eventually has changed to other land uses, such as grazing and cultivated lands. Despite the tremendous land use changes from forest to grazing and cultivated lands in Ethiopia.
There is a rapid change of land use land cover in the study area due to its proximity to Ambo Town, land degradation, population growth, climate change, etc. Knowing of this fact, the present study was initiated and conducted in Taltalle river watershed area of Ambo, Central Ethiopia, with the objective of assessing the impact of land use land cover on socioeconomic activities.
Statement of the problem
Developing countries like Ethiopia where their agriculture serves as backbone of the economy and ensure wellbeing of the people, the adverse effects of LULCs are diverse.
Recently, issues related to LUCC have attracted interest among a wide variety of researchers, ranging from those who try to model spatial and temporal patterns of land conversion to those who want to understand the causes and influences of LUCC. Although climate change, urbanization and population growth have been considered the most common factors contributing to LUCC on a global scale, there is no consensus concerning the relationships between LUCC and its driving forces, largely because of the complex interactions among physical, biological, economic, political and social factors. Therefore, to fully understand the process of LUCC, it is equally important to look into the environmental socio-economic against which the LUCC have taken place [18].
In order to anticipate an achievement on the impact of LULC change on socioeconomic activities in the study area continued researches, studies and actual field status of production areas. Therefore, the purpose of this study was to fill the gaps of researches and studies on implementation of the interventions and document relevant data on to what extent LULC would influence socioeconomic in Taltalle watershed. The study attempts to evaluate the effects of different land use practices on socioeconomic activities in the study area [19].
Description of the study area
The study was conducted in Taltalle river watershed in West Shoa zone, Ambo Woreda. The watershed is located at an estimated distance of 115 km to the West of Addis Ababa within 37047'47''-37052'51'' E and 8054'22''-8059'35'' N. The altitude ranges from 1911 m-2489 m. Taltalle river is a tributary of Huluka river and originates from Wenchi Mountains and flows to Debis River (Figure 1).

Figure 1: Map of the study area.
According to national population census report of 2008, the population of the woreda was 202,655 of which 99,859 were male and 102,796 were female. The targeted watershed has a total population of 4,058 and household of 948.
The mean annual temperature is 18.64â?? while the mean annual rainfall is 968.7 mm, the main rainy season is from the beginning of June to end of September and the mean monthly relative humidity of the study area varies from 64.6% in August to 35.8% in December.
The geology of central high land of the country is characterized by late tertiary that covers the pre-Cambrian rocks that underlie all other rocks in Ethiopia. According to Simret the soil of Ambo Woreda is highly dominated by clay minerals which cover 36.25% red, black soil covers 34.37% and mixed or brown covers 29.38% [20].
The vegetation coverage of the study area includes scattered trees, shrubs and eucalyptus tree plantations. Trees and shrub species are mainly concentrated around homestead for better management and protection. Major types found in the area are Cordia africana, Ficus vasta, Sesbania, Balanites aegyptiaca, Lippias spp, Eucalyptus globullu, Schinusmolle and Acaccia species.
Ambo woreda is characterized as having good potential for agricultural production. Rain fed agriculture mixed cropping along with livestock rearing land use systems are the major sources of food and income for maintaining the livelihoods of the study area. The common types of land use in the study area are cultivated land, eucalyptus tree, settlement and quarry area. The major dominant cereal crops are Wheat (Triticuma estivum), Tef (Eragrositis tef), Barley (Hordeum vulgar) and Maize (Zea mays L.).
The major income generating sources for farmers in the area are staple cereal sales and selling livestock products. Moreover, landless farmers have opportunities to sell their labor during peak seasons such as land tilling, weeding and harvesting.
The average altitude ranges from 1911 masl to 2489 masl. The slope classification of the watershed is largely dominated by terrain with flat to undulating and steep slopes.
Socio-economic data collection
The ultimate purpose of the field survey was to collect qualitative and quantitative information for understanding and interpret the land use and land cover change. Moreover, the data were used to know the past and present impacts of socio-economic activities in the study area. Fifty key informants were purposively selected for the detailed individual interviews and group discussions A purposive sampling technique, involving the targeting of individuals who suited the subject and nature of study using predetermined selection criterion i.e., age, the time they live on area and land owner were used to select the participants through consultation with Development Agents (DA) of the study area. A questionnaire covering a wide range of topics relevant to the central issue of interest were developed. Three focused group discussion were conducted at up, middle and downstream of the study watershed with different age, sex, educational status, land holdings and their residing time. The size of focused group discussion was 6-8 households. Historical change in land use and land covers, land degradation, soil color dynamics, economic activities of the households in different time were the main points of discussion.
Land use land cover data
Land sat imagery data scenes of the selected study area were used to analyze the trends of land cover of three periods land sat with the acquisition date 26 December 1972 (Path: 181 and Row 54), land sat Thematic Mapper (TM) with the acquisition date 04 January 1989 (Path: 169 and Row 54) and land sat Enhanced Thematic Mapper (ETM+) with the acquisition date 15 January 2019 (Path:169 and Row: 54). The download satellite images were in tiff format and the layer stacking of bands were performed in ArcGIS10.3. Image rectification was done to correct distortions resulting from the image acquisition process. All GIS data were projected to their respective Universal Transverse Mercator (UTM) projection system and datum of world geodetic system, ensuring consistency between datasets during analysis [21]. Landsat images were corrected for atmospheric, sensor and an illumination variance through radiometric calibration procedures. Image classification for the three time category was performed through supervised classification using the maximum likelihood classifier, which includes selection of signature of different features (training sites) by digitization of selected area on the image. Selection of signature was based on field knowledge and existing literature and map. Obtained signatures act as an input for digital image classification. Based on giving signature the whole study area was classified into four classes. Based on the quality of results, training samples were refined until a satisfactory was obtained. Classified images were recorded to the respective classes (i.e. cultivated, eucalyptus, grazing, and settlements land). The field information regarding each land use type was collected through field observation and GPS coordinates. The images were analyzed by using Erdas imagine and ArcGIS 10.3. The areas which were converted from each of the classes to any of the other classes were then computed. According to 21 the rate of LULC changes was also calculated using the following equation:
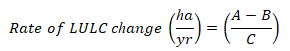
Where: A=Recent area of the LULC (km2)
B=Previous area of the LULC (km2), and
C=Time interval between A and B in years
An accuracy classification, assessment was carried out to verify to what extent the produced classification was compatible with what actually exists on the ground. It involved the production of references (samples) that evaluated the product classification.
These references were produced from Google Earth and GPS points during fieldwork, which were independent of the ground truths used in the classification. With this method, it was then be possible to find out the sources of errors. Cohen kappa within the error matric was used to determine the error encountered during classification of satellite images.
Generally, accuracy assessment was very important measurement to determine how accurate the referenced data agreed with classified images of the remotely sensed data. For all maps, produce accuracy, user accuracy, and Kappa statistics were computed. Overall, all the three maps met the minimum 87% accuracy. For the study area supervised classification was carried out for the three images of (1972, 1989 and 2019) and on the training areas and the different false color composites of 4, 3, and 2 were identified. Then, the change detection analysis was carried out by visual comparison of features and detailed quantitative approaches. Using the application of supervised image classification methods, three major land use and land cover types were identified.
Analysis of land use and land cover changes
The major land use land cover types identified include cultivated, eucalyptus/vegetation, grazing and settlement lands (Figure 2). The figures show the trend of land use land covers change which is increasing in deforestation in preference to other land uses. The maps indicate drastic LULC changes over a period of 47 years of analysis. In 1972, forest was the dominant land use land cover type in the area. However, subsequent years were accompanied by a gradual and drastic decrease in the forest surface coverage as arable land and settlements consistently increase with population and the demand for diverse products and higher standards of living. This pushed farmers to increasingly convert part of their forest land to other land use types, particularly the opening of new farms and extension of existing ones (Table 1).

Figure 2: Land use map and LULC changes of Taltalle river watershed.
| Land use type | 1972 | 1989 | 2019 | |||||||
|---|---|---|---|---|---|---|---|---|---|---|
| Area (km2) | % | Area diff | % diff | Area (km2) | % | Area diff | % diff | Area (km2) | % | |
| Urban settlement land | 1.71 | 4.51 | 0.45 | 1.18 | 2.16 | 5.69 | 10.98 | 28.89 | 13.14 | 34.57 |
| Eucalyptus/Vegetation land | 23.34 | 61.43 | 4.12 | 10.84 | 19.22 | 50.59 | 18.68 | 49.16 | 0.54 | 1.43 |
| Cultivated land | 4.58 | 12.05 | 6.53 | 17.18 | 11.11 | 29.23 | 8.32 | 21.89 | 19.43 | 51.14 |
| Grazing land | 8.37 | 22.01 | 2.86 | 7.53 | 5.51 | 14.51 | 0.62 | 1.63 | 4.89 | 12.86 |
Table 1. Area of LULC changes of Taltalle river watershed of three times.
Land covers are a physical asset if properly used by land use stakeholders. The magnitude or shifts of the land use changes were rapid and devastating unless properly managed by land users. Conversion and modifying from vegetation and grazing land to agriculture and settlement land may result in loss of natural resources and agro-biodiversity. The data in Table 1 showed that drastic shift of land cover changes from 1989-2019 years in Taltalle river watershed. Evidently, the conversion in the year 1989 for settlement land was 10.98 km2 (28.89%), eucalyptus/vegetation lands 18.68 km2 (49.16%), cultivated lands 8.32 km2 (21.89%) and grazing land 0.62 km2 (1.63%) of the total watershed area. The increase in settlement area was due to the expansion of Ambo Town towards the southern and eastern part of the watershed. The eucalyptus plantation in the watershed owned by “Lem Ethiopia” is in the study area. This plantation will be vanished if the current deforestation continues. Quarry areas were also expanded in different parts of the watershed. In contrast, the change of land use land cover from 1972-1989 was not significantly observed.
The cultivated land coverage in 2019 was (51.14%) of the total watershed area. The second largest land use type (34.57%) was urban settlement whereas; the least coverage was for grazing land (1.43%). According to the key informants, expansion of cropland supplement with increase in human population and adult labour forces are major causes for expansion in agriculture and decline of grazing land. Improper land resources utilization imbalances the equilibrium of the existing land uses.
These findings were similar to 18 in which the areal coverage of cultivated land were drastically increased from the landsat image taken in 2000 than 1973 but the forest and shrub lands were shrunken.
Socio-economic impacts of land use land cover changes
Socio-demographic characteristics of sample households: From the above Table 2 key demographic and socioeconomic characteristics of the surveyed households, a large percentage of household heads (92%) was males as females constituted the remaining proportion (8%). Large proportions (60%) of respondents were between the ages of 25 years and 54 years, while 36% and 4% of them were between 55 years and 64 years, and 65 or older, respectively. Regarding to the family seizes the largest proportions (44%) and (40%) were between 4-6 and 7-10 family sizes and the remaining were (8%) each for 1-3 and 10 family sizes and the family size ranged from one to 12 persons, with an average family size of 6.1 persons. Households with productive labor force of 1-3, 4-6 and 7-10 categories accounted for 92% of the sample households. Economically dependent age groups (0-14) and elderly (65 and above) varied from family to family. In this regard, 25% of respondents had household dependency ratios of between 0.0 and 0.38, while 8% of households had dependency ratios of between 0.5 and 3.
| Demographic and socio-economic characteristics | No | % | |
|---|---|---|---|
| Gender | Male | 46 | 92 |
| Female | 4 | 8 | |
| Age | 25-54 (Primary working age) | 30 | 60 |
| 55-64 (Mature working age) | 18 | 36 | |
| >65 (Elderly) | 2 | 4 | |
| Family size | <1 | 1 | 2 |
| 1-3 | 3 | 6 | |
| 4-6 | 22 | 44 | |
| 7-10 | 20 | 40 | |
| /10 | 4 | 8 | |
| Land size | 1-3 | 24 | 48 |
| 4-5 | 18 | 36 | |
| >5 | 8 | 16 | |
| Educational status | Write and read | 22 | 44 |
| 1-4 | 10 | 20 | |
| 5-8 | 10 | 20 | |
| 9-10 | 6 | 12 | |
| 11-12 | 2 | 4 | |
| Most income source | Crop production | 40 | 80 |
| Crop and animal production | 8 | 16 | |
| Others | 2 | 4 |
Table 2. Household’s demographic and socio-economic characteristics.
Relatively a greater proportion (44%) of the respondents could read and write whereas the educational achievements of 20% of respondents ranged from grade 1 to grade 4 and 20% of respondents ranged from grade 5 to grade 8. A small proportion of the household heads (12%) had attended grade 9 to grade 10 and only 4% attended up to grade 12 level of formal education. Most of the surveyed households were engaged in only agriculture (80%), the others were mixed farming activities (16%) and some of them (4%) were engaged in some form of off-farm activities like query, informal labor and selling charcoal and wood. The landholdings of households in the study area varied from 0.5 ha to 6 ha with an average holding size of 2.1 ha per household. A large majority of the surveyed households (63% from the three sample sites) had planted trees for reversing land degradation and ecological reasons of sustainable land management. A large number of households were aware of land degradation particularly soil erosion, soil nutrient depletion and development of gullies as major problems in their localities.
During the discussion with the group of representatives they mentioned that declining of the soil fertility from time to time, shortage of land, rainfall variability, rapid of land use change from cropping land to the settlement were the main constraints to crop production. Most of the people in the study area were looking for renting their land to others so that they faced the problems of land shrinkage. During group discussion they also pointed out that the quarrying activities were the main cause for land use land cover changes in the study area as the land owned by individual farmers were under this activity due to its provision of income generation in all seasons as compare to agriculture activities. Most of the male youths were engaged in the quarry which was considered as additional job creation in the study area but not for female as it is supposed energy base activities. They also stated that cultural and/or religious habit that was not allowed to engage in farming and other activities were the issues before 20 years/30 years ago but now seldom. Animal production became decreasing and decreasing through time due the facts that the declining of grazing land (changing of grazing land to crop land) that even causes for rising up of the milk prices in Ambo Town. The finding is similar 22 and in which socio-economic characteristics of a given area can affect the land use changes and 23 in which population growth, poverty and food insecurity, gradual change in the economic activities of communities in the area from pure pastoralist to agro-pastoralist, weak law enforcement and drought appear to explain a large part of underlying causes.
Land use change, their drivers and impact: According to the survey 96% of the respondents understand as land degradation and land use land cover change existed in their local area and can cause a problem on their normal activities and only 4% respondents couldn’t recognize whether land degradation and land use land cover change is a problem in their area. 80% of the respondents know as land degradation and land use land cover changes interrelated but only 20% respondents. Sever soil erosion on cropland and gully formation near to agricultural lands, high runoff and observing of the scattering puddles are their indicators which was not common before 40 years ago. They also narrate some of the possible causes of land use land cover changes in their area like population growth that will lead them on the limited resources for instance, land competition, urbanization (expansion of Ambo town), rainfall variability (amount, lack of temporal and spatial distribution, intensity, etc.) and land tenure.
Regarding to soil classification, all of the respondents classify soil on its colour in which 44% of them as black soil is a productive, 32% and 24% of the respondents classify the productive soil as red and black and red respectively based on the fertility status, resilience (ability to resist and recover all biological activities after a physical or chemical stress) and environmental aspects (impact of soil functioning on other compartments of the ecosystem e.g. effect on water and air quality). 100% of the respondents evaluate trend of land use land cover change over time severity of LULC change is very severe, severe, moderate and light from present to the past 40 years. 92% and 98% of the respondents also evaluate the trend of land use land cover change over time extents of LULC change is widespread everywhere, present on vulnerable land units and absent and signs of LULC change soil erosion, gully formation, vegetation degradation, soil fertility degradation, water stress respectively but only 8% and 2% give different. 84% of the respondent’s income sources were agriculture (rain fed crop production) and 16% were both crop production and animal rearing. Socio-economic activities have an impact on almost any type of land use. For example, changes in people’s lifestyles can directly affect housing types and locational preferences, as well as consumption patterns, and with that the type and location of economic production but the problem in the study area was low income due to LULC change. The result is in line with 24 LULC changes are driven by a combination of proximate and underlying drivers such as economic, demographic, biophysical and institutional factors and 25 fire wood and charcoal were the most commercialized energy sources for rural and urban households in the region as their demands have been increased over time and they are the major causes of forest cover change and degradation.
Land use changes in the past years
From the below Table 3 years (now and past) was varied significantly (p<0.05) with size of land use holding of the respondents. It means that the land use land cover in the past 40 years ago was varied with the land use type of now (during data collection i.e. early of 2019), but was not varied with the total land use coverage of the study area.
| Source of Variation | SS | df | MS | F | P-value |
|---|---|---|---|---|---|
| Years | 509.244 | 5 | 101.85 | 4.0358 | 0.002 |
| LULC | 291.6667 | 6 | 48.611 | 1.9263 | 0.0815 |
| Years*LULC | 798.0476 | 30 | 26.602 | 1.0541 | 0.4041 |
Table 3. ANOVA for land use through the past years.
According to the analysis obtained from remote sensing the vegetation coverage in the watershed was high in 1970’s and the biomass form cultivated/agricultural land was dense and tall as observed from the image of 1972 taken in autumn season. Meanwhile, high vegetation coverage indicated high decomposition which in turn indicated also good physicochemical properties of the soil specifically the organic matter and organic carbon. On the other words, good vegetation and grazing coverage by itself is an indication of good physicochemical properties of the soil. Therefore, from land use land cover of the past years, the soil physicochemical properties of the soil were indicated at good status, but due to the change in land use land cover the soil characteristics was completely depleted and low productivity. But detail analysis of the relationship between physicochemical properties of the soil and land use land cover will require through remote sensing. This result was in line with 26 land uses was changed from one from to another according the GIS and remote sensing and information obtained through social survey.
The study of land use change and its impact on soil and socioeconomic activity will help greatly to the planning work and will show the future planning ways.
The settlement was significantly different from grazing and eucalyptus land but all other types of land uses were not significantly different.
Demographic and socioeconomic characteristics of the surveyed households observed as it affects the LULC conditions of the study area. Declining of the soil fertility from time to time, shortage of land, rainfall variability, rapid of land use change from cropping land to the settlement were the main constraints to crop production.
Generally, governmental and non-governmental organizations should look through rural development programs and strategies in detail about the expansion of Ambo town to the surroundings and short and long term effects in responding to the socioeconomic activities of the area.
Study on impact of LU on socio-economic activities of the area system might be helpful for proper implementation of the research activities and reliable interpretation of the overall agricultural research findings in the area. Results of the study, however, provide only baseline information for the future research efforts on soil resources of the research area, and it needs more detailed and frequent investigation on the constraints related to effects of LU on different soil properties and its management to derive the appropriate recommendations for improving the soil productivity of the study site and the surroundings.
I extend my special thanks to Ambo university.
My deep thanks also go to my brother Dereje Merga, Mr. Bayissa Belay, Mr. Fikadu from Ambo university and Mrs. Bijigdu from Senqelle Farisi Kebele for their support during field data collection.
[Crossref] [Google Scholar] [PubMed]
[Crossref] [Google Scholar] [PubMed]
Citation: Kebebe NT, et al. "Impact of Land Use Land Cover Change on Socio-economic Activities in Taltale Water Shed, West Shoa, Oromia Regional State, Ethiopia". Int J Climatol Weather Forecaste, 2023, 11(3), 1-6.
Received: 23-Mar-2023, Manuscript No. JCWF-23-22324; Editor assigned: 27-Mar-2023, Pre QC No. JCWF-23-22324 (PQ); Reviewed: 10-Apr-2023, QC No. JCWF-23-22324; Revised: 23-May-2023, Manuscript No. JCWF-23-22324 (R); Published: 30-May-2023, DOI: 10.35248/2332-2594.23.11(3).1-6
Copyright: © 2023 Kebebe NT. This is an open-access article distributed under the terms of the Creative Commons Attribution License, which permits unrestricted use, distribution, and reproduction in any medium, provided the original author and source are credited.
