Research Article - (2015) Volume 3, Issue 3
Keywords: Multi-temporal analysis; Geostatistics; Infill method; Kriging
Introduction
Bangladesh receives some of the heaviest rainfall in the world [1]. Annual Average rainfall in Bangladesh ranges from a low of 1,200 mm in the west to almost 6,000 mm in the east where huge uplifting effects of Meghalaya Plateau compose the highest rainfalls of the world just beyond the border with India [2]. IPCC has termed Bangladesh as one of the most vulnerable countries in the world due to climate change. Hydrological changes are the most significant impacts of climate change in Bangladesh and resultant altered precipitation patterns cause frequent extreme weather events, such as floods, droughts and rainstorms etc., [3-5].
The variability of rainfall and pattern of extreme high or low precipitation are important for the agriculture and hence economy of the country. The study of rainfall patterns and intensities of heavy rainfall events which constitute the hydrologic design and analysis is the primary prioritized requirement in design of development works and study of impact assessments alike.
The variation of rainfall over an area can be studied on spatial or temporal basis. The several spatial variation approaches are by station, basin, sub-basin, watershed, etc.,
Temporal studies can be short term basis or long term basis. Short term variations are concerned with intensities of rainfall and are obtained either from recorded short interval data or from daily data by the Cof empirical formulae in 15 min, 30 min, hourly or three-hourly intervals. Long term variations are usually based on climate normals and are further studied on yearly, monthly or seasonal basis. Four distinct seasons can be recognized in Bangladesh from the climatic point of view:
i. Dry Winter season (December, January, February; DJF).
ii. Pre-monsoon Hot Summer season (March, April, May; MAM).
iii. Rainy Monsoon season (June, July, August, September; JJAS).
iv. Post-monsoon Autumn season (October, November; ON).
Objectives
The study attempts to initially infill the missing daily data within the observed data set to generate a Kriging set of data and then proceed analysis with both sets of data alike. The key objectives are:
i. Assessment of Kriging infill.
ii. Infilling missing daily data of 7 climate stations by Kriging.
iii. Station-wise comparative temporal analysis between Kriging generated data and observed data on the following basis:
a. Yearly
b. Monthly
c. Seasonal
Literature review
Geostatistics: By its introductory definition, Geostatistics offers a way of describing the spatial continuity of natural phenomena and provides adaptations of classical regression techniques to take advantage of this continuity [6].
Geostatistics is the result of introducing spatial dependence into statistical basics. Disregarding spatial dependence can invalidate methods for analyzing cross-sectional and panel data [7]. It was also established along with the already common statistical analysis of the variables, there must be an assessment of how well the models describe the spatial features of the data [8].
Geostatistical kriging approach
Kriging is a geostatistical method wherein a variable of interest Z(s) is decomposed into a deterministic trend μ(s) and a random, auto correlated errors form, ε(s).
z(s) = μ (s) +ε (s)
The symbol s simply indicates the location; it contains the spatial x- (longitude) and y-(latitude) coordinates. Deterministic trends are essentially results of math techniques based on the concept that future behavior can be predicted precisely from the past behavior of a set of data. These techniques ignore the existence of disturbances or external ‘shocks’ that may alter the data’s future pattern. In geostatistics, the information on spatial locations allows the computation of distance between observations and thus model autocorrelation as a function of distance.
Geostatistical approach is applicable and methods are optimal when data are:
• normally distributed
• stationary (mean and variance do not vary significantly in space)
The different Kriging methods vary in degrees of complexity and in their underlying assumptions. Ordinary Kriging is one of the simplest forms of Kriging. It assumes that the data points demonstrate local stationarity, i.e., they contain no significant trends over the reasonably homogeneous smaller regions designated by the interpolation search neighborhood. As a result, it is a fairly accepted belief that moderate trends in the data do not significantly affect ordinary Kriging interpolations [9].
Studies on kriging
The pioneer study on Kriging [6] was conducted by Isaaks and Srivastava, 1989. Their book Applied Geostatistics is the introductory text wherein they explain how various forms of the estimation method called Kriging can be employed for specific problems. The book highlights an instructive case study of a simulated deposit.
A recent study performs evaluation of 17 infilling methods [10] including Kriging for time series of daily precipitation and temperature. Results revealed Kriging, among other stochastic methods, performs better infill than the set of deterministic methods. The linear regression residuals between precipitation and elevation incorporated into an ordinary Kriging model gave the best results. Use of elevation in stochastic methods to produce better results in the interpolation of climate variables has been highly recommended.
A case study was conducted on four forms of Kriging [11] and three forms of thin plate splines to predict monthly maximum temperature and monthly mean precipitation in Jalisco State of Mexico. Results show that techniques using elevation as additional information improve the prediction results considerably. From these techniques, trivariate regression-kriging and trivariate thin plate splines performed best.
The study area is composed of the 4 districts Dhaka, Narayanganj, Narshingdi and Gazipur and falls within the North Central Region of Bangladesh as defined by FAP, 1989. The districts span over latitudes of 24.008° to 24.028° and longitudes of 90.006° to 90.989°. A map is illustrated in Figure 1.

Figure 1: Study area comprising of 4 districts.
Status quo of study area
In these regions, flooding due to rainfall is pronounced and drainage congestion is becoming increasingly uncontrollable [12]. Drainage congestion occurs due to inadequacy of drainage system, heavy rainfall, high water level of peripheral rivers, unplanned development and encroachment. Numerous khals which fed water retention areas are being continuously filled up by new settlements, low-lands and paddy fields are readily converted into build-up areas by the housing estates and natural depressions and wetlands have been filled by solid wastes to reduce the filling costs in many parts. Unplanned urban development sprawls in the area and rivers are subjected to increasing encroachments as a bi-product of development. Water bodies in such settlements are fatally polluted if not filled up already.
BWDB maintains 7 well dispersed climate stations within the study area as per the distribution given in Table 1.
| District | Number of Stations | Station Name |
|---|---|---|
| Dhaka | 3 | Banani, Savar, Dhaka_PBO |
| Narayanganj | 1 | Shimrail |
| Narsingdi | 1 | Narsingdi |
| Gazipur | 2 | Joydebpur,Maona |
Table 1: District wise distribution of climate stations.
Data collection
The station locations and corresponding available data is depicted in Table 2.
| Station Name | Station ID | District | Latitude | Longitude | Available Data | No. of Years | Percentage of missing data |
|---|---|---|---|---|---|---|---|
| Shimrail | CL519 | Narayanganj | 23.64 | 90.62 | 1984-2013 | 30 | 2.53 |
| Narsingdi | CL76 | Narsingdi | 23.94 | 90.75 | 1984-2013 | 30 | 17.19 |
| Banani | CL42 | Dhaka | 23.8 | 90.4 | 1993-2013 | 21 | 5.91 |
| Savar | CL31 | Dhaka | 23.83 | 90.26 | 1984-2013 | 30 | 12.35 |
| Joydebpur | CL17 | Gazipur | 24.01 | 90.42 | 1996-2013 | 18 | 15.91 |
| Dhaka_PBO | CL9 | Dhaka | 23.7 | 90.48 | 1984-2013 | 30 | 6.85 |
| Maona | CL43 | Gazipur | 24.15 | 90.4 | 1996-2013 | 18 | 3.09 |
Table 2: Stations Locations and Available Data.
Data processing
The amount of missing data each station contributes to the total missing volume of 7.95% which is generated by Kriging. Within the missing volume, Joydebpur constitutes the largest volume of missing data at 27% and Dhaka_PBO constitutes the smallest at 4%. Kriging is executed via Arc-GIS 10.1 for each missing day individually with Ordinary Kriging and Prediction Type Surface via the Geostatistical Wizard. The results obtained from data generation of April, May and August for Joydebpur station in 2013 are depicted in Figures 2 and 3.
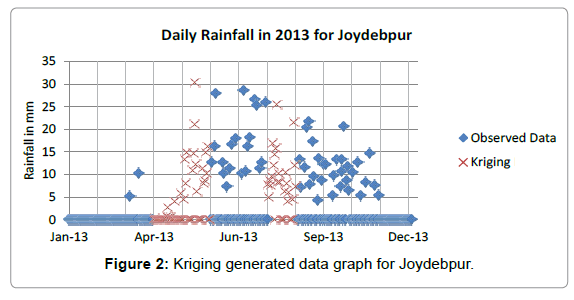
Figure 2: Kriging generated data graph for Joydebpur.
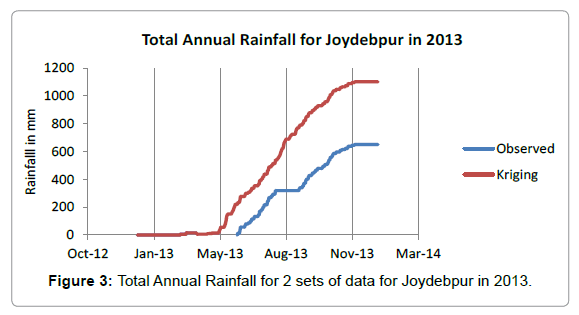
Figure 3: Total Annual Rainfall for 2 sets of data for Joydebpur in 2013.
Temporal analysis
Firstly, for each year in each station calculations for both sets of data are executed to obtain:
• Total Annual Rainfall (TAR).
• Average Daily Rainfall(ADR).
• Total no. of wet days, Total no. of dry days.
• Maximum Daily Rainfall.
• Total Rainfall for each season and each month.
Secondly, for each station the Average Annual Rainfall (AAR) and finally, for all stations, values of AAR, maximum daily rainfall and seasonal rainfall distribution calculations are executed.
Data analysis
Kriging assessment for the reference year 1999 is conducted for Joydebpur station and the months May from pre-monsoon season, August from monsoon season and October from post monsoon season. The generated Kriging data is then compared to actual observed data to reveal appreciable results via similar values and distribution.
The Temporal Analysis results of Maona station are depicted in Figures 4 and 5. The station-wise results are tabulated in Table 3. The trends observed for TAR, ADR, number of wet days, number of dry days and maximum daily rainfall, the appreciable Kriging years observed per season and highest rainfall month for each station is shown.
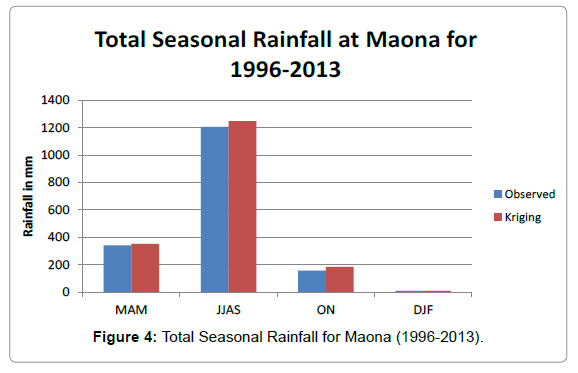
Figure 4: Total Seasonal Rainfall for Maona (1996-2013).
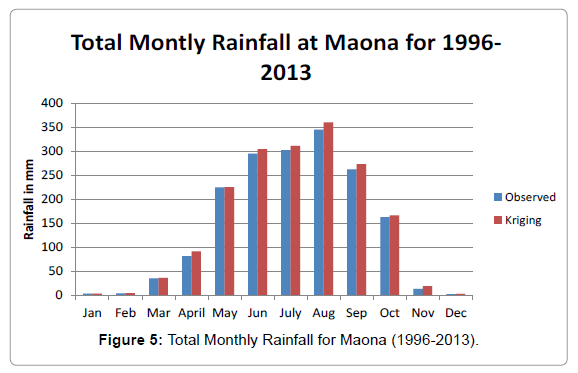
Figure 5: Total Monthly Rainfall for Maona (1996-2013).
| Station Name | Month of highest rainfall | Post-monsoon | Monsoon | Pre-monsoon | Maximum Daily Rainfall | No. of Dry days | No. of Wet days | TAR, ADR |
|---|---|---|---|---|---|---|---|---|
| Dhaka_PBO | July | Nil | 1998 | 1996 | Increasing | No trend | Decreasing | Decreasing |
| Joydebpur | July | 2004, 2005 | 1997, 2002-2005, 2012, 2013 | 1996,1997, 2002, 2003, 20012, 2013 | Decreasing | Increasing | Decreasing | Decreasing |
| Savar | July | 1993 | 1993, 1997, 2005,2009,2013 | 1997 | Decreasing | No trend | Decreasing | Decreasing |
| Banani | July | 2002 | 2013 | 2004,2013 | Increasing | Increasing | Increasing | Slightly Decreasing |
| Maona | Aug | 1996, 2002, 20013 | 2007, 2010-2013 | 1996, 1997, 2003,2013 | Increasing | Increasing | Increasing | Increasing |
| Narsingdi | July | Nil | 1997, 2003, 2013 | 1997, 2003, 2004, 2006, 2013 | Decreasing | Increasing | Decreasing | Significantly Decreasing |
| Shimrail | July | 2002 | 2002 | 2005,2007 | Decreasing | Increasing | Decreasing | Significantly Decreasing |
Table 3: Summary of station-wise results.
For all stations, AAR, maximum daily rainfall and seasonal rainfall distribution results are depicted in graphs of (Figures 6-8) respectively.
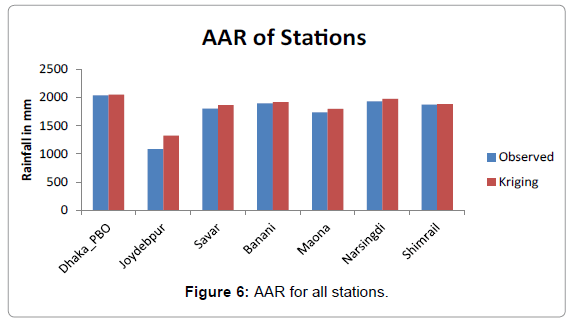
Figure 6: AAR for all stations.
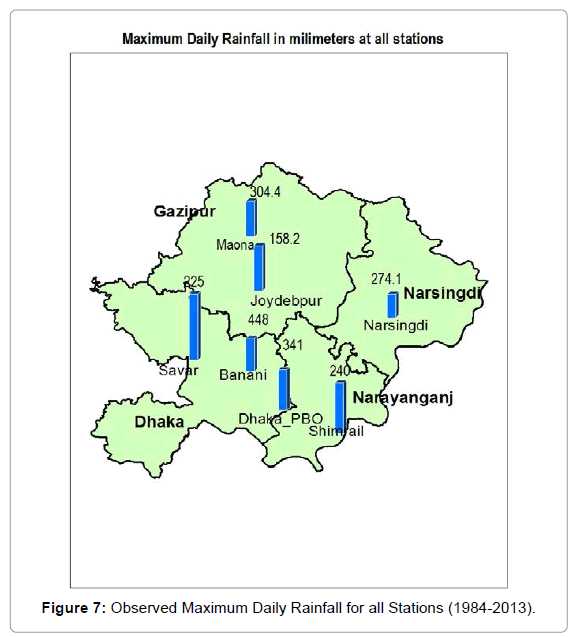
Figure 7: Observed Maximum Daily Rainfall for all Stations (1984-2013).
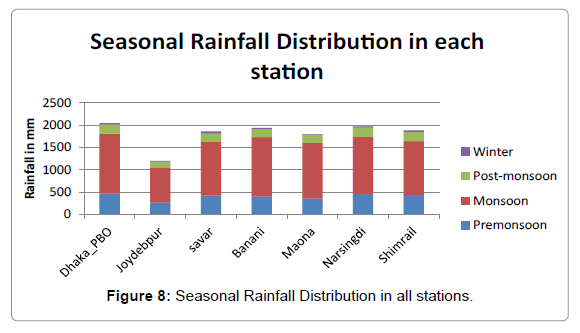
Figure 8: Seasonal Rainfall Distribution in all stations.
Kriging results are observed to be non-appreciable for post monsoon while it is significant and appreciably deviant from observed data for monsoon and pre-monsoon. The results are observed to be most effective for moderate rainfall values. Kriging for monsoon is also useful for the purpose of obtaining and studying expected moderate values although it is liable to uncertainties due to characteristic dynamism of Bangladesh’s monsoon.
Kriging results are seen to be appreciably deviant from observed data for all stations and mildly for Dhaka_PBO. It is seen to be most effective for Joydebpur which had the highest amount of missing data.
However, anomalies and limitations exist. No results were obtained regardless of moderate observed rainfalls for May 2013 at Shimrail. The only observed values were at Maona and in spite of two fold Kriging, no generation was possible. Furthermore, missing data can be calculated only for days which have observed rainfall in another location. For low rainfall values, this may not necessarily mean rain in the station of interest.
Trend interpretations
The number of wet days is increased in any year due to Kriging but the overall trend over the years is observed to be same for both Kriging and observed data.
As depicted in results by trend lines, there is a localized effect in number of wet days and in number of dry days over the years. This can be cited as a result of global warming and as a sign of Bangladesh’s North Central Zone’s vulnerability to the phenomena. This further confirms the impacts of global warming to be continuously effective over the study area.
The assessment of Kriging reveals it to be a suitable method for infilling missing rainfall data and successful data processing for stations with missing data. Minimum errors and appreciable values are obtained for a missing station from moderate values of nearby observed rainfall. The values generated only for the highest or lowest observed rainfall values depict errors and deviant results. Most significant results are obtained for pre-monsoon and monsoon seasons; the volume of expected rainfall in these seasons can be deduced using Kriging. Kriging for post-monsoon has no or negligibly appreciable effect. Kriging in winter is redundant and can be anomalous. The number of wet days is increased in any year due to Kriging but the overall trend over the years is observed to be same for both Kriging and observed data. Maximum daily rainfall is unaffected by Kriging infill for all stations except Joydebpur when the observed value of 83.7 mm is generated to be 104.12 mm.
The limitation lies in the fact that missing data can be calculated only for days which have observed rainfall in at least one other location. For low rainfall values, this may not necessarily mean rain in the station of interest. Applications of Kriging can be resourceful in studying the rainfall over ungauged vulnerable areas, locations of importance and likes. Kriging for monsoon is also useful for the purpose of obtaining and studying expected moderate values although it is liable to uncertainties due to characteristic dynamism of Bangladesh’s monsoon.
The temporal analysis firstly as per station spanning over corresponding available years of data, for both Kriging and observed data illustrates total seasonal rainfalls and total monthly rainfalls to follow a normal distribution trend with Monsoon season giving the peaks; July is the rainiest month for all stations except Maona wherein August is both observed and Kriging generated as the rainiest month. Trend line visualizations used in all graph plots of number of wet days, number of dry days and daily maximum rainfall show increasing or decreasing trends. There is a localized effect in number of wet days and in number of dry days over the years. The number of wet days is decreasing at 5 stations (Dhaka_PBO, Joydebpur, Savar, Narsingdi and Shimrail) and increasing at 2 stations (Banani and Maona). The number of dry days follows no trend at 2 stations (Dhaka_PBO and Savar) and is increasing for 5 stations (Joydebpur, Narsingdi, Shimrail, Banani and Maona). This can be cited as a result of global warming and as a sign of Bangladesh’s North Central Zone’s vulnerability to the phenomena. This further confirms the impacts of global warming to be continuously effective over the study area. Localized changes in maximum daily rainfall are observed as it is decreasing for 4 stations (Joydebpur, Savar, Narsingdi and Shimrail) but increasing for 3 stations (Dhaka_PBO, Banani and Maona).
The temporal analysis secondly for all stations combined, deduced values of average annual rainfall, maximum daily rainfall and seasonal rainfall distribution. The average annual rainfall values are highest and lowest at Dhaka_PBO and Joydebpur respectively for both observed dataset and Kriging dataset; the highest average annual rainfall values are observed to be 2034 mm and generated by Kriging to be 2047 mm.; the lowest average annual rainfall values are observed to be 1083 mm and generated to be 1322 mm. The highest value of observed maximum daily rainfall is 448 mm in 2009 at Banani and lowest of 158.2 mm in 1996 at Joydebpur. From seasonal distributions at all stations, developed from completed set of Kriging generated data, it is indicative that the monsoon season contributes highest rainfall at all stations, followed by pre-monsoon, post-monsoon and winter respectively; the highest monsoon rainfall of 1343 mm is at Maona, the highest premonsoon rainfall of 465 mm is at Dhaka_PBO and the highest postmonsoon rainfall of 208 mm is at Shimrail.
