Research Article - (2022) Volume 10, Issue 3
Climate has always been dynamic affecting natural systems through the consequence of its variability and change. Agriculture is the most vulnerable and sensitive sector that is seriously affected by the impact of manifested through rainfall variability and recurrent drought. In dry land semiarid areas of Ethiopia, including in the study areas, farmers inhabiting the area experience extreme temporal and spatial variability of rainfall in cropping season with frequent and longer dry spells. This makes them vulnerable to the risk of Meteorological Drought (MD). Thus, in order to adapt and/or mitigate the impact of MD, MD assessment has to form one dimension of research to be done whereas the use of MD indices and different soft wares provides wide scope in drought risk detection and mapping. Consequently, this study was conducted in Eastern Harerghe and Shinile Zones with the objective of assessing MD risk and preparing MD using Rainfall (RF). To assess and examine spatiotemporal variation of seasonal MD patterns and severity, a drought index namely, Standard Precipitation Index (SPI) anomalies are applied. To characterize temporal and spatial MD, rainfall data for a period of 36 years from (1980-2016) were utilized. The time of the seasonal transitions can also be an important control on drought, the result derived from index the annual trends of RF increased in Fedis; whereas, in Deder and Shinile woredas, it decreased with the time. The spatial distribution of drought frequency and its climate trend as well as different drought grades were obtained by employing the inverse distance weighting (IDW) interpolation method in ArcGIS 10.3.1 platform. In this study, the MD indices used to quantify the drought severity, frequency, trends, spatial pattern and its intensity. So, the annual high drought frequency mainly concentrated in the Eastern some areas of Fedis. From South to West part of Deder were observed slight to moderate drought. From slight to severe drought was largely experienced in shinile more than others study areas. Generally, the result revealed that SPI anomaly express decreased with the time over the study areas. Thus, the result indicated that the areas are classified into slight, moderate and severe MD risk zone. Thus, the MD study can be useful to guide decision making process in drought monitoring and to reduce the risk of drought on agricultural production and productivity.
MD (Meteorological Drought) • Meteorological drought indices • Rainfall and geographical information system
Background
Climate has always been dynamic, and affects natural systems through the consequences of climate variability and climate change [1]. Because of climate change and variability, drought has become a recurrent phenomenon in several countries across the globe. It is manifested in erratic and uncertain rainfall distribution in rainfall dependent farming areas, especially in arid and semi-arid ecosystems. Frequent and severe drought has become one of the most important natural disasters in sub-Saharan Africa and often results in serious economic, social, and environmental crises [2]. It is marked by the creation of uncertain agricultural economics [3]. Droughts are a type of environmental disaster that occur in every climatic zone, no matter if high or low rainfall area. Droughts are usually divided into four different stages. The first stage is a meteorological drought which is defined as the cumulative lack of precipitation in a region over a prolonged period of time. Second a lack of water in the soil causes an agricultural drought, which usually is accompanied by reduced crop yields or shortage of soil moisture. Third a hydrological drought is characterized by a shortage of water in surface or underground water resources, it can be visible through dried up rivers and lakes [4]. Finally, a socio-economic drought is apparent when the supply of good water does not meet the demand. This model is currently operational as yield monitoring and forecasting tools for region wide food security analyses in drought prone countries in Sub-Saharan Africa [5]. In addition, Standard Precipitation Index (SPI) is meteorological drought index used to quantify the impact of rainfall deficit on soil moisture on which it responds to precipitation anomalies on a relatively short scale. In general, applications of satellite based vegetation, crop performance and climate derived drought indices become the feasible means and acceptable decision tools for timely action against the negative consequences of meteorological drought. Thus, Assessment of meteorological drought by remote sensing or ground data is believed to be very helpful for providing countermeasures as early as possible.
GIS and Remote sensing techniques are being widely used for analysis of drought monitoring and assessment using various drought indices [6,7, 8, 9]. Ethiopia is a sub-Saharan country that has been affected by frequent drought. Millions of lives have been lost because of recurring droughts in the past several decades. Due to climatic changes, drought occurs every two years in different parts of Ethiopia [10, 3]. In addition, the drought recurrence cycle shortens over time while the affected area is widening, impacting additional parts of the country that were once unaffected. In order to respond to the effects of drought, Ethiopia has been conducting drought assessment and monitoring missions. The Ethiopian National Meteorological Services Agency (NMSA) classified three seasons per year in Ethiopia: rainy season (June to September), dry season (October to January) and short rainy season (February to May) [10]. Since agricultural activities in the dry land semi-arid areas in general and study area, Fedis, Deder and Shinile woredas in particular, are influenced and controlled by seasonal rain, the study of meteorological drought analysis is carried out season-wise using climate based drought index (SPI).These index as proxies of drought, and crop and/or vegetation health condition are vital in drought assessment and hence, they are applied in this study. Problem Statement is Ethiopia’s climate is influenced by general atmospheric and oceanic factors that affect the weather system and climatic factors such as drought has significant impact on agricultural output [11]. This makes Ethiopia vulnerable to climate variability. Climate variability over the last three decades resulted in drought and famines in Ethiopia and several other countries in Africa [12]. Due to greater reliance on climate sensitive sectors such as agriculture, Ethiopia is vulnerable to the risk of climate variability and change such as MD. MD is a period of abnormally dry weather sufficiently for the lack of precipitation to cause a serious hydrological imbalance and carries connotations of a moisture deficiency [13]. In Eastern Ethiopia, the major impact of MD is manifested through rainfall variability and recurrent drought due to climate change.
The amount and distribution of rainfall in these crops growing season is also very erratic, indeed making crops vulnerable to moisture deficit. Agriculture is one of the most vulnerable sectors to MD impact. The impact is redundantly stronger in the study areas in particular, where agriculture is truly important for the daily subsistence, and where adaptive capacity is low. Agriculture is the most vulnerable and sensitive sector that is seriously affected by the impact of MD. MD is currently more pronounced in the study area. Farmers inhabiting in the study area are exposed to the impact of MD that resulted from the current climate change. This is due to the fact that most of farmers’ cultivars (long duration crop variety) can no longer resist the existing MD and intra seasonal dry spell [10]. As a result, most of the cultivars have gone obsolete, and yield reduction and crop failure, death of livestock becomes common [14]. Therefore, the aim of this research was to study the impact of Meteorological-Drought due to precipitation performance, to assess quantitatively climate anomalies in terms of severity, intensity (magnitude of drought), duration, frequency and spatial extent) in the introduction explained areas. Generally, studying of the impact of Meteorological drought (drought severity, intensity, frequency and duration) on crops can be useful in this regard for the decision making process on drought monitoring and to avert its consequences on agricultural production and productivity for study areas. The main objective of the study was to investigate the spatialtemporal occurrence of meteorological drought in the study areas. Moreover, this study generated information about impact of MD on crops and facilitates exchange of this information among societies, field experts, policy makers and researchers. The study tried to investigate Meteorological drought spatial-temporal characteristics and its impact. The study therefore, would to provide significant recommendation for study areas.
Topography Eastern Harerghe and Shinile Zones are characterized by diverse topographic features in which high mountainous and deeply incised canyons and gorges, valleys and plateaus with steep slopes dominate its most parts [15]. Because of the diverse topography, the study area experiences different climatic conditions that range from hot and arid lowlands in the eastern part to cold and humid highlands in the western part Mentioned by the following Table 1.
| Elevation ( meter above sea level) | Traditional zone | Description |
|---|---|---|
| >3000 | Wurch | Cold Highlands |
| 2500-3000 | Dega | Cold, Humid highlands |
| 1500-2500 | Weina Dega | Temperature, Cool Sub humid highlands |
| 300-1500 | Kolla | Warm, Semi-Arid Lowlands |
| <300 | Bereha | Hot and Hyper-Arid Lowlands |
Table 1. Classification of agro-ecological zones based on altitude.
Climate
The climate of study areas in Eastern Harerghe Zone: Fedis, Deder woreda and Shinile Zone shinile woreda studied by semi-arid and sub-humid climate based on the moisture index classification of climate. The long term average seasonal rainfall that the area receives ranges from 458 to 518 mm and according to NMA study in 1996, the study areas are characterized by bimodal rain fall distribution (those were spring and summer). The warmest temperatures are recorded during February to May, while the coldest was recorded during October to January. High temperatures between 30-35oc are recorded in low altitude areas, however in highland areas the average temperatures are between 20-22oc and NMA website (maproom, www.ethiomet.gov.et) [16].
Data collection and analysis
To achieve the objective of this study the following procedures were followed: The study used ArcGIS version10.3.1 software to characterize spatial Meteorological Drought by imputing (analysed) rainfall data processed by MS Excel, woredas’ coordination (latitude and longitude) and woredas’ base map data. The study used MS excel 2010, Instant version 3.37 and XL Instat softwares to characterized temporal Meteorological Drought (i.e. to show rainfall trend, extent, frequency and duration in temporal characteristics of MD as output) by analysed rainfall and crop yield data; For this study, the study used a time series AVHRR satellite gridded and three stations rain gauges’ rainfall data used to show meteorological–drought characters by helping indices such as SPI4 based (because they are used to assess meteorological season classification based on Lemaa Gonfa studie. The data obtained from National Meteorological Agency Jijiga Branch Office (NMA JBO), AVHRR gridded rainfall data have 4km by 4km spatial resolution (satellite data) in monthly and seasonally time step basis data for the period of the main rainy season (June-September) and (Mar-may). This gridded obtained from NMA and Famine Early Warning System (FEWS-NET) archive website: (http/:iridl. Ideo.columbia.edu GCM) about 37 years (from 1980-2016 G.C) that used to fill the missing year data. The objects in this case are defined based on attributes of their physical feature and drought is a geographic object. So to So to characterize meteorological drought, (Figure 1) the study used long year’s meteorological data and different soft wares such as INSTAT 3.37 and ArcGIS 10.3.1 techniques, MS Excel 2010, and these woreda base map. Finally, this research is to assess impact of Meteorological drought using Meteorological Stations, satellite data and based on Meteorological drought indices and by helping different software packages (to assess quantitatively climate anomalies in terms of severity, intensity (magnitude of drought), duration, prediction and probability, frequency, temporal and spatial extent of drought).

Figure 1: Map of the study areas (by using GIS version 10.3.1 Software).
Data sources and collection method
For this study, the daily historical meteorological data collected from Ethiopian National Meteorological Agency (NMA) for a period of 36 years (1980-2016). These include daily rainfall; gridded (Station+satellite) RF on the study area. Three meteorological weather stations shown above in Table 2 selected for the study on the basis of spatial representative of the zone.
| Study Areas | Latitude (N) | Longitude (E) | Atitude (m) | Area Coverage (in Km2) | Annual RF (in mm) | Annual Mean Tem | (in C⁰) |
|---|---|---|---|---|---|---|---|
| Shinile | 9⁰ 41' 37.2" | 41⁰ 50' 92.8" | 41⁰ 50' 92.8" | 1029 | 0.5 | 639 | 25.7 |
| Deder | 9⁰ 19' 79.5" | 41⁰ 26' 71.3" | 41⁰ 26' 71.3" | 2144 | 0.03 | 1008.1 | 16.4 |
| Fedis | 9⁰ 07' 94.4" | 42⁰ 04' 49.7" | 42⁰ 04' 49.7" | 1699 | 0.11 | 526.1 | 19.5 |
Table 2. Representative Meteorological stations for study areas.
Data analyses
To characterize temporal and spatial Meteorological-Drought, its impact with rainfall; monthly rainfall data for a period of 36 years from (1980-2016) rearranged in a monthly, seasonally and annually time step in Microsoft excel 2010 spread sheet. For the study areas (Fedis, Deder and shinile), the trend and severity of monthly, seasonally and annually rainfall (i.e. maximum, minimum and mean rainfall). The rearranged data averaged over more than thirty years’ time span and analyzed in order to examine the seasonal, monthly, seasonal and annual Meteorological-drought characteristics by using the following indices and different soft wares. The parameters used in this study are used described in the following sections.
Standard Precipitation Index (SPI)
SPI is an index that is developed to quantify precipitation deficit at different time scales, and can also help assess drought severity of MD by helping MS Excel and by using ArcGIS version 10.3.1 software analysed spatial pattern of drought. The SPI is simplicity (only rainfall data is required for calculation). SPI is also used to analyse the impact of rainfall deficiency on crop development. Different time scales reflect the impact of drought on the availability of the different agricultural crops. According to Edwards and McKee in 1997, the mean SPI for the location and desired period is represented zero and also it represented water deficit or excess (i.e. positive SPI represents that water has been available to plants whereas negative SPI or rainfall deficiency is reflected on crop production through yield reduction). Yield reduction due to moisture deficiency is clearly explained in this issue. The formula of SPI is:

Where, Xij=is the seasonal precipitation and, Xim is its long-term seasonal mean and ẟ is its standard deviation. The final result of SPI based drought severity class are: >0=No drought, 0.0 to -0.99=Slight drought, -1.0 to -1.49= Moderate drought, -1.5 to -1.99= Severe drought, -2 and less, Very severe drought that mentioned by Gizachew in 2010 as followed Table 3.
| SPI Value | Drought severity class |
|---|---|
| Above 0 | No drought |
| 0.0 to -0.99 | Slight drought |
| -1.0 to -1.49 | Moderate drought |
| -1.5 to -1.99 | Severe Drought |
| -2 and less | Very Severe drought |
Table 3. SPI based drought severity class.
So, it is used to see the duration, severity, frequency of meteorological-drought.
Characterizing the meteorological-drought
From the daily of long term rainfall data, the onset and cessation dates, trend analysis, and dry spell risk analysed. All these Meteorological- Drought indices identified different soft wares, such as INSTAT tools version 3.37, and SPI4 and the data captured by MS Excel 2010 soft wares. In order to examine the MD of study areas for more than a thirty years (1980-2016) climatological period Statistical tools like mean, standard deviation, coefficient of determination (R2), Coefficient of Variability (CV) and pvalue comparison used in ISTANT (v 3.37) statistical software. Coefficient of Variability used to classify the degree of MD (rainfall) events as less, moderate and high. When CV <20% it is less variable, CV from 20% to 30% is moderately variable, and CV >30% is highly variable. Areas with CV> 30% are said to be vulnerable to drought [17].
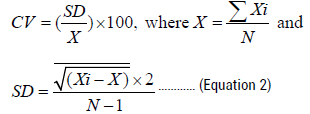
Where from equation (5) CV is the coefficient of variation, SD is standard deviation, ẟ is long year mean and N is total number of year during observations, Xi is rainfall of each month or season. The coefficient of determination (R2) also indicates the variation of the climate variable with time in the linear regression model which is defined as:
R2 = SSR / SST
Or
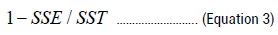
Where, SSE is the Sum of Squared Error, SSR is the Sum of Squared Regression; SST is the Sum of Squared Total. R2 measured how successful the fit was in explaining the variation of the data. P-value is a statistical measure that used to determine whether the hypotheses were correct. Usually, if the p-value of the dataset was below the pre- determined amount (say 0.05 which is the 95% confidence interval), the variability of the dataset has meaningful effect on the result [18].
Trend analysis
For trend analysis, the monthly and annually data series of the study areas weather station more than 30 years long year data analysed and test for the existence of significant trend by correlation and regression analysis using INSTAT software. To determine the trend of rainfall in the study areas, sequential plot time series analysis used. This can be mathematically denoted using the functional relationship below:

Where, Y is the value of the variable under consideration at time i.
Suppose that Yi is the estimated value of the dependent variable Yi at time i, then Yi can be predicted from the simple linear equation.
The model can be written as

Yi=the estimated value of the dependent variable(maize yield); βo = the Y intercept measuring the value Yi at time i, β1Xi=the slope of the line measuring the change in the variable Yi that results from a units change in time i, i=the independent variable (time) i=1, 2, 3, 4…30 and Ԑi=Random error. It hypothesize that there is no trend in the amount of rainfall over time. Thus the null hypothesis will stated as; H0: β1=0. Variability of annual and seasonal rainfall will be assessed using CV and Analysis of Variance (ANOVA) techniques. Standard rainfall will plotted against time (in years) to visualize the time series variation of annual and seasonal rainfall.
The regression model for the study rain fall effect will be computed as:
Where
Y=the value of the dependent variable (maize and sorghum yield/ ha)
a=Y intercept
b=regression coefficients (each b represents the amount of change in Y (yield) for one unit of change in the corresponding x-value when the other x values are held constant; x=the rainfall independent variables (i.e. rainfall) and e=the error of estimate or residuals of the regression.
Pearson Correlation coefficient (r) analyses will be used to analyse the correlation between times(expressed in year) and rainfall characteristics, value of r ranges between -1 to +1, a correlation coefficient close to +1 indicates a strong positive correlation, a correlation coefficient close to -1 indicates a strong negative correlation similarly a correlation coefficient of 0 indicates no correlation.
Spatial and temporal patterns of drought conditions using indices
Standard Precipitation Index (SPI): Drought characteristics included various drought conditions, such as duration, severity, and intensity. The SPI was determined based on seasonal classification of Ethiopian which mainly include Belg (Feb-May), Bega (Oct-Jan) and Kiremt (Jun-Sep) [10,19]. The results of SPI4 analysis are given below in Table 4 and Figure 2. The point RF was used to talk woreda based because the NMA station RF data represent about fifty Kilo meter radius coverage.
| St. Name | MK Slope | Season | |||
|---|---|---|---|---|---|
| Kendal’s Tau | Sen's slope | P Value | |||
| Shinile | -111 | Belg | -0.19 | -0.075 | Sig |
| -76 | -0.12 | -0.841 | Sig | ||
| -144 | -0.18 | -1.919 | Sig | ||
| -101 | -0.16 | -0.767 | Sig | ||
| 161 | 0.26 | 0.538 | Non- Sig | ||
| 188 | Kiremt | 0.3 | 1.58 | Non- Sig | |
| 73 | 0.12 | 0.737 | Sig | ||
| 23 | 0.04 | 0.206 | Sig | ||
| Deder | -197 | -0.34468 | -0.82857 | Non- Sig | |
| -63 | Belg | -0.10734 | -0.74 | Sig | |
| -106 | -0.17921 | -1.5167 | Sig | ||
| -117 | -0.20144 | -1.55333 | Sig | ||
| 90 | 0.154003 | 0.447815 | Sig | ||
| 6 | Kiremt | 0.010179 | 0 | Sig | |
| -52 | -0.08791 | -0.75 | Sig | ||
| -53 | -0.0903 | -0.26496 | Sig | ||
| Fedis | 4 | 0.007057 | 0 | Sig | |
| 49 | Belg | 0.0795 | 0.1579 | Sig | |
| -65 | -0.10443 | -0.6057 | Sig | ||
| 190 | 0.308521 | 0.126798 | Non- Sig | ||
| 123 | 0.197605 | 0.815302 | Sig | ||
| 170 | Kiremt | 0.271135 | 1.432248 | Non- Sig | |
| 165 | 0.263372 | 1.837037 | Non- Sig | ||
| 5 | 0.008007 | 0 | Sig | ||
| Sig: Significant, Non-Sig: Non significant, MK: Mann Kendall | |||||
Table 4. Anova of study areas.

Figure 2: SPI RF anomaly of Shinile woreda for the period of 1980-2016.
The analysis of SPI4 for Shinile woreda showed that drought has occurred at different level from 1980 to 2016 rainy season. In the below Figure 2, the drought happened in the years 1980, 1981, 1984, 1985, 1988, 1989, 1990, 1991,1995, 1999, 2000, 2002, 2003, 2004, 2005,2008, 2009 2011 and 2015. There were very severe droughts years and with their more intensity and duration [20]. These years were 1984, 2000, 2005, 2009, 2011 and 2015 those were explained with their SPI values that range from -2 to -1. The results indicated that during those years, there was rainfall deficit in the growing season and therefore, there was the worst dry season. SPI can be used to identify not only drought years but also wet years. In this regard, using SPI analysis, wet years were identified. As the maps were shown in the Figure 2, the years 1982, 1983, 1986,1987,1992, 1993, 1994, 1996, 1997, 1998, 2001,2006, 2007, 2010, 2012 and 2013 were very wet years in Shinile woreda, and based on SPI4,among these years the extreme wettest years were 1983, 1997, 1998, 1996 and 2010. Besides analysis of the 36 years (1980-2016) annual RF showed a coefficient of variation ranging from 70.4%-157.2%.
The analysis of SPI4 based for Deder woreda, from Figure 3, the years 1984, 1985,198, 1987, 1991, 1994, 2004, 2005 and 2007 to 2015 were droughts. There were very severe droughts with their SPI values ranges from -1.0 to -1.5 those were the years 1984, 1994, and 2007 to 2013. The results indicated that during those years there was rainfall deficit in the growing season and therefore, there were the worst dry years [21]. Considering of the most severe droughts years above mentioned period was a better illustration of the drought extent and intensity in this area. So based on this index, the extreme wet years were 1999, 1998, and 1997 with SPI values greater than 1.0. Besides analysis of the 36 years (1981-2016) annual RF showed a coefficient of variation ranging from 70.8%-139.0%. This was highly variation of RF.

Figure 3: SPI RF anomaly of Deder woreda for the period of 1981-2015.
The result of the analysis of SPI4 for Fedis woreda is given in Figure 4. As it can be seen, the droughts occurred in the years 1980, 1982-1986, 1990, 1991-1993, 2005, 2007, 2010, 2011, 2012 and 2015. There were very severe droughts in the years 1980, 1982-1985, 1986, 2010 and their SPI values range from -1.5 to -2.0. The results indicated that those years were rainfall deficit in the growing season and therefore, there were the worst dry seasons in Fedis woreda. Considering of the most severe droughts above mentioned period were the better illustration of the droughts extent and intensity in Fedis woreda. The years 1988, 1989, 1995, 1996, 1997, 2009 and 2014 were also extreme wet with SPI values greater than 1.0. Besides analysis of the 36 years (1981-2016) annual RF showed a coefficient of variation ranging from 75.6%-202.7%.

Figure 4: SPI RF anomaly of Fedis woreda for the period of 1980-2016.
During Kiremt season (Jun-Sep), in the Figure 5, based on SPI4 for Deder in the years 1984, 1987, 1991, 2010 and 2013 were found to be the extreme drought; whereas, during this season the years 1983, 1988, 1998, 1999, 2000, 2001 and 2002 were found to be extreme wet and based on vegetation (NDVI index) trend data these years were good production years. As the Figure 5 indicates, most years have shown more frequent drought than wet years and also drought occurrence was frequent in 1980s and 2010s;this indicates the earliest time is returned now and the RF performance is shown decreasing trend.

Figure 5: Kiremt Season (Jun-Sep) RF SPI of Deder woreda for the period of 1981-2015.
During Kiremt season (Jun-Sep) in the Figure 6, based on SPI4 for Fedis woreda in the years 1980-1986, 1990-1993, 2001,2005, 2007, 2010, 2012 and 2015 were shown droughts (the SPI4 values range from -0.1 to -2.0). Among these years, 1980, 1984, 1985 and 1986 were very severe droughts (SPI4 values range from -1.6 to - 2.0); whereas, the years 1987-1989, 1994-2000, 2002, 2006, 2008, 2009, 2011, 2013 and 2014 were wet (the SPI4 values range 0.3 to 1.6). Among these years, 1988 and 2009 were good cropping years because these years were found to be extreme wet years than others [22]. As the below Figure 6 has shown frequency of droughts years were more than wet years and also drought occurrence was frequent in the first years (1980’s).

Figure 6: Seasonal (Jun-Sep) RF SPI of Fedis woreda for the period of 1980- 2015.
During Kiremt season (Jun-Sep) in the Figure 7, based on SPI4 for Shinile woreda, in the years 1980-1982, 1984-1987,1989-1991, 1993, 1995, 1997, 2002, 2004, 2009 and 2015 were the droughts (the SPI4 values range from -0.2 to -2.1). Among these years, 1991 and 1987 were very severe droughts (the SPI4 values range from -1.6 to -2.1); whereas, the years 1984, 1996, 1998, 2001 and 2010 were extreme wet and these years were good cropping years because these years were more wet years than others. So, as the below Figure 7, based on SPI4 has shown frequency of drought years were less than wet years and also drought occurrence was frequent in the first years (1980’s).

Figure 7: Kiremt Season (Jun-Sep) RF SPI of Shinile woreda for the period of 1980-2015.
As it can be seen from Figure 8, the SPI4 values for Belg season (Feb -May), ranged from 0.1 to -1.6 for Shinile woreda, during the years 1980, 1984, 1985, 1988, 1992, 1994, 1999-2005, 2007, 2009, 2011-2013 and 2015. These values indicate drought of different levels. Based on the classification given by equation 3.3, SPI values between -1.5 and -1.6 are considered as severe droughts. In line with this, the years 2000, 2009, and 2011 are classified severe droughts [23]. The earliest years (2000’s) were characterized with more frequent drought events whereas the years 1981, 1983, 1986, 1987, 1996 and 2010 were wet and there were good cropping season.

Figure 8: Belg season (feb-may) RF SPI of shinile woreda for the period of 1980-2015.
During Belg season (Feb-May), in the Figure 9, based on SPI4 for Deder woreda, in the years 1984, 1986, 1988, 1992–1994, 2000-2005, 2007-2009, 2011-2015 were shown drought. Among these years, the years 1988, 1994, 2007, 2009, 2011-2013 were shown from moderate to severe drought (the SPI4 values range from -1.0 to -1.6). The recent years were more frequent the drought years whereas from the years 1981-1983, 1985, 1987, 1989-1991, 1995- 1998, 2006 and 2010 were wet (the SPI4 values range from 0.1 and 3.3) [24]. Among these years, in 1997 was the wettest year and expected good cropping season.

Figure 9: Belg Season (Feb-May) RF SPI of Deder woreda for the period of 1981-2015.
During Belg season (Feb-May), in the Figure 10, based on SPI4 for Fedis woreda, in the years 1980, 1982-1986, 1991,1999, 2001, 2002, 2005, 2008, 2010, 2011 and 2015 were shown droughts ( the SPI4 values range from -0.1 to -1.5). Among these years, the years 1980, 19821986, 1999, 2008, 2010 and 2015 were shown moderate droughts (the SPI4 values range from -1.0 to -1.5) specially 1984 were severe drought [25]. The earliest years (1980’s) were more frequent the drought years; whereas, in the Figure 10, the years 1981, 1988-1990, 1995-1998, 2000, 2003, 2004, 2007, 2009 and 2014 were wet (the SPI4 values range from 0.1 and 2.0). Within line this, 1998 and 1989 were found to be the extreme wet years and there were expected good cropping season.

Figure 10: Belg Season (Feb-May) RF SPI of Fedis woreda for the period of 1980-2015.
So, the implication of the above result indicated that the drought pattern such as drought frequency, severity and intensity explained by using SPI4 index in study areas. It used to know the drought years, its frequency time and its magnitude in study areas.
RF trend analysis in the study areas
As can be seen in Figure 11, annual total rainfall trend in Fedis woreda for the period 1980 to 2016 was positively increased with the time. Based on the result in Figure 11, during the above mentioned period, the highest amount of RF was 923.3 mm in the year 1988; whereas, the lowest total amount of rainfall was 89.4 mm in the 1985 and also the mean total RF was 514.7 mm. The trend of total rainfall amount was increased with the time (see Table 5).

Figure 11: Total Annual RF Trend of Fedis woreda for the period of 1980-2016.
| Significance | |||||||
|---|---|---|---|---|---|---|---|
| Df | SS | MS | F | F | - | - | |
| Regression | 1 | 433.7415 | 433.7415 | 4.011605 | 0.0529811 | - | - |
| Residual | 35 | 3784.289 | 108.1217 | ⁻ | ⁻ | ⁻ | ⁻ |
| Total | 36 | 4218 | ⁻ | ⁻ | ⁻ | ⁻ | ⁻ |
| Coeff | SE | t stat | P-value | Lower 95% | Upper 95% | Lower 95.0% | |
| Intercept | 1989.71 | 4.48 | 444.37 | 0 | 1980.62 | 1998.8 | 1980.62 |
| RF Annually | 0.02 | 0.01 | 2 | 0.05 | 0 | 0.03 | 0 |
Table 5. ANOVA Fedis Woreda RF
Simple linear regression between rainfall and years starts from 1980-2016 in Fedis woreda.
Fitted equation: y=0.0161*RF + 1989 R-squared: 1.0
Whereas, the annual total rainfall trend in Figure 12, for Deder woreda for the period of 1981 to 2016 was decreased and the highest total RF recorded in the year 1997 with the value 1933.7 mm but the minimum total amount of rainfall recorded in 1985 with the value 425.0 mm. The mean total RF was 992.95 mm (see Table 6).

Figure 12: Total Annual RF Trend of Deder woreda for the period of 1981- 2015.
| Significance | |||||||
|---|---|---|---|---|---|---|---|
| Df | SS | MS | F | F | ⁻ | ⁻ | |
| Regression | 1 | 357.2 | 357.2 | 3.4426 | 0.0722226 | ⁻ | ⁻ |
| Residual | 34 | 3527.8 | 103.759 | ⁻ | ⁻ | ⁻ | ⁻ |
| Total | 35 | 3885 | ⁻ | ⁻ | ⁻ | ⁻ | ⁻ |
| Coeff | SE | t stat | P-value | Lower 95% | Upper 95% | Lower 95.0% | |
| Intercept | 1989.71 | 4.48 | 444.37 | 0 | 1980.62 | 1998.8 | 1980.62 |
| RF Annually | 0.02 | 0.01 | 2 | 0.05 | 0 | 0.03 | 0 |
Table 6. Anova deder woreda.
Simple linear regression between rainfall and years starts from 1980-2016 in Deder woreda.
Fitted equation: y= -0.0106 * RF + 2009.2 R-squared: 1.0.
As shown in Figure 13, the annual total rainfall trend in Shinile woreda for the period of 1980 to 2016 decreased and the maximum total rainfall was 965.9mm in 2010; whereas, the minimum total amount of rainfall was 348.6mm in 2015 and the mean total RF was 639.0mm. The study showed that the trend of total rainfall amount decreased with the time. Statistically, significant all trends were detected for precipitation on annual based (see Table 7).

Figure 13: Total Annual RF Trend of Shinile woreda for the period of 1981- 2013.
| Significance | ||||||||
|---|---|---|---|---|---|---|---|---|
| Df | SS | MS | F | F | ⁻ | ⁻ | ⁻ | |
| Regression | 1 | 6.908 | 6.908 | 0.0574 | 0.812028 | ⁻ | ⁻ | ⁻ |
| Residual | 35 | 4211.092 | 120.317 | ⁻ | ⁻ | ⁻ | ⁻ | ⁻ |
| Total | 36 | 4218 | ⁻ | ⁻ | ⁻ | ⁻ | ⁻ | ⁻ |
| Coeff | SE | t stat | P-value | Lower 95% | Upper 95% | Lower 95.0% | Upper 95.0% | |
| Intercept | 1999.781 | 7.65 | 261.403 | 0 | 1984.251 | 2015.312 | 1984.251 | 2015.312 |
| RF Annually | -0.003 | 0.012 | -0.24 | 0.812 | -0.026 | 0.021 | -0.026 | 0.021 |
Table 7. Anova shinile district.
Simple linear regression between rainfall and years starts from 1980-2016 in Shinile woreda.
Fitted equation: y= -0.0028 * RF + 1999.8 R-squared: 1.0
Additionally, all drought years with seasons by using SPI index were explained (see Table 8).
| Drought years in study areas using different indices | |||||||
|---|---|---|---|---|---|---|---|
| S.N | Period analyzed | Parameters | Study areas | Season | Drought Years | Index values | Index |
| 1 | 1980-2016 | RF | Fedis | Kiremt | 1980-1986, 1990-1993, 2001,2003,2005,2007,2010,2012& 2015 | < 0,0 to -0.99,-1 to 1.49,-1.3 to -1.9,< -2.0 | SPI |
| Belg | 1980,1982-1986,1991,1999,2001,2002,2005,2008,2010 & 2015 | ||||||
| 2 | 1980-2016 | Shinile | Kiremt | 1980-1982,1984-1987,1989-1991,1993,1995,1997,2002,2004,2009 &2015 | |||
| Belg | 1980,1984,1985,1988,1992,1994,1999-2005,2007,2009,2011-2013 & 2015 | ||||||
| 3 | 1981-2016 | Deder | Kiremt | 1984-1987,1989-1991,1994,2007-2015 | |||
| Belg | 1984,1986,1988,1992-1994,2000-2005,2007-2009,2011-2015 | ||||||
Table 8. All drought years with seasons by using SPI index.
Monthly total RF trend analysis
As can be seen from Figure 14, the monthly total rainfall trend of Shinile woreda is decreased with time. The maximum RF recorded in the month of April and August during Belg season (Feb-May) and during Kiremt season (Jun-Sep) with value average 107.9 mm and 115.3 mm respectively. The minimum total RF recorded in December with value 12.4 mm and the monthly mean value was 53.3 mm.

Figure 14: Monthly Total RF Trend of Shinile woreda for the period of 1980- 2016.
As can be seen from Figure 15, the monthly total rainfall trend in Deder woreda is slightly decreased with time increased and the highest total RF is also recorded on the month April and August. The highest value on average recorded 128.2 mm and 216.7 mm during Belg season (Feb-May) and Kiremt season (Jun-Sep) respectively. The minimum total RF is recorded 11.0 mm in December and the monthly mean value was 84.4 mm.

Figure 15: Monthly Total RF Trend of Deder woreda for the period of 1981- 2016.
As can be seen from Figure 16, the monthly total rainfall trend, in Fedis woredas can be shown the increased trend with the time; and the maximum total RF recorded 128.2 mm during belg season (Feb-May) and 216.7 mm during Kiremt season (Jun-Sep). The highest value on average was recorded in the month of April and August. The minimum total RF recorded 11.0 mm in December and the monthly mean value was 84.4 mm (see Table 5).

Figure 16: Monthly Total RF Trend of Fedis woreda for the period of 1981- 2016.
Spatial pattern of drought severity, frequency and trend
Spatial pattern of drought severity, frequency and trend for fedis: Drought characteristics various characteristics can be used to describe droughts [25]. They Uses three characteristics, intensity, duration and spatial coverage. Intensity describes the magnitude of deficiency while duration is defined as the time of said deficiency, and spatial coverage the area experiencing a deficiency at a certain point of time. Spatial coverage and intensity changes with time as the drought develop. Severity can be described as a product of duration and intensity, and is frequently associated with the vulnerability of an area to drought [26]. Severity can also be defined as the socio-economic impact of droughts, often expressed in economical values of lost production or other costs affiliated with droughts. Finally, severity is also used in indices to distinguish the diẟerent phases. The spatial distribution of drought frequency and its climate trend as well as different drought grades were obtained by employing the inverse distance weighting (IDW) interpolation method in ArcGIS 10.3.1 platform [27]. There are very significant spatial differences of meteorological drought frequency from 1980 to 2016 in the study areas [28]. As it can be seen from Figure 17A, the annual spatial distribution of RF coverage increased both from western part of Fedis woreda that is large portion of woreda covered no drought from long term mean annual RF (470 mm), and from North to central part of Fedis was shown slight RF distribution and pocket areas RF was shown decreased or moderate drought the existence of some RF performance (Figure 17A). The annual spatial distribution of RF coverage was decreased or high drought frequency mainly concentrated in the Eastern some pocket areas of Fedis. From Figure 17B, the spatial pattern of most parts of the areas was slight decreased and the mean RF amount was (178 mm) from Northern to South parts of the District and also some pocket areas the RF coverage increased in the North Western; and the RF coverage was shown decreased in some pocket areas in the Eastern parts of the district [29]. From Figure 17C the spatial pattern of most parts of the areas the RF distribution was slightly decreased and the mean RF amount was (238 mm) in the North central parts of the District and also there was increased in some pocket areas in the North Western and some pocket areas.

Figure 17: Spatial coverage of RF for Fedis A) Annual B) Belg C) Kiremt.
Spatial pattern of drought severity for fedis expressed in SPI index: As shown below from Figure 18A, the SPI index of annually (Jan-Dec) result most areas of the district was wet (no drought) in the South Western areas; from North to central part of areas was shown slight drought; whereas, some pocket areas in the Eastern part was shown the most drought (Moderate drought). From Figure 18B, most areas during Belg (Feb-May) was shown slight drought in the Northern and South Western parts of areas and some pocket areas in Eastern parts of Fedis was moderate drought; whereas, from central to Western parts of Fedis was shown wet (areas had no drought). From Figure 18C, most areas during Kiremt (Jun-Sep) also covered by slight drought in the Northern and central parts of Fedis and some pocket areas in Eastern parts of Fedis was moderate drought; whereas, in the South Western parts of Fedis was shown wet (areas had no drought).

Figure 18: Spatial pattern of drought severity A) Annual B) Belg C) Kiremt for Fedis Woreda expressed in SPI index.
Spatial Pattern Drought Severity, Frequency and trend for Deder: As the result can be seen from Figure 19A, the annual spatial distribution of RF increased both from Eastern part of Deder woreda that is large portion of woreda (was shown wet) from long term mean of annual RF (754 mm); whereas, in the Western and central parts of Deder, the RF distribution slightly decreased; and it also decreased in the Western tip and Southern tip. From Figure 19B, the Belg (Feb-May) the RF distribution was the same as annually RF distribution occurrence and the long term mean of Belg RF amount was 239 mm. From Figure 19C, the Kiremt (Jun-Sep), there was good RF performance in the South Eastern parts of Deder; whereas, from central to Western parts of Deder, there was slightly decreasing of RF performance and the long term mean of Belg RF amount was 456 mm.

Figure 19: Spatial pattern drought severity A) Annual B) Belg C) of deder woreda.
Spatial pattern of drought for Deder expressed in SPI index: The study have be seen as the following figures by using SPI index anomaly most of the results was observed the same as the above observed Figures but for further explanation from Figure 20A, annually spatial pattern most of areas was shown no drought (low drought frequency) from Eastern to the central parts of areas; whereas, from South to West part of Deder were observed slight to moderate drought. From Figure 20B, Belg season spatial pattern in SPI index most of area was shown wet (no drought); from central to South and Western part of areas in SPI index were observed slight to moderate drought respectively. From Figures 20C, Kiremt season spatial pattern in SPI index most of areas was shown wet (no drought) Eastern to Central part of areas; from Western part of areas in SPI index was observed slight drought and moderate drought was observed in the Southern parts of areas.

Figure 20: Spatial pattern of drought severity A) Annual B) Beg C) Kiremt for Deder Woreda expressed in SPI index
Spatial pattern drought severity, frequency and trend for Shinile: As the result can be seen from Figure 21A, the annual RF distribution decreasing expanded from North to central and Eastern part of Shinile woreda that is large portion of woreda covered shortage of RF (was shown dry) from long term mean of annual RF (639 mm); whereas; it was increased from central to South parts of Shinile (wet area). From Figure 21(A and C), the Belg (Feb-May) and the Kiremt (Jun-Sep) drought frequency were the same as annually RF distribution occurred and the long term mean of Belg and Kiremt RF amount were 258.9 mm and respectively.

Figure 21: Spatial pattern of drought severity A) Annually B) Belg C) Kiremt of shinile woreda expressed in SPI index.
Spatial pattern of drought for Shinile woreda expressed in SPI index: The study have be seen as the following Figures, by using SPI index anomaly most of the results were observed the same as the above observed Figures but for further explanation from Figure 22A, annually spatial pattern small pocket areas of Shinile woreda was shown no drought (low drought frequency) in the South parts of areas; whereas, from South to North tip part of Shinile were observed slight to moderate drought respectively. In this time large portion of areas was covered by moderate drought and more drought patterns during Kiremt and Belg seasons was shown similar to Figures 22(B and C).

Figure 22: Spatial pattern of drought severity A) Annual B) Belg C) Kiremt for Shinile Woreda expressed in SPI index.
Climate has always been a dynamic, and it can affect natural systems through the consequences of climate variability and climate change, which is usually manifested through in erratic and uncertain rainfall distribution. Rainfall is one of the climatic variables that largely determine the occurrence of drought and also influences the growth and development of vegetation. The analysis of the 36 years (1980-2016) annual RF showed a coefficient of variation ranging from 75.6%-202.7%, 70.8%-139.0% and 70.4%-157.2% over Fedis, Deder and Shinile Woredas respectively. The trends of annual and monthly total rainfall of the period 1980 to 2016 showed positive trends for Fedis and decreasing trends for Deder and Shinile. The highest annual RF was recorded in Deder compare to other study areas. The maximum total RF recorded in the month of April and August during Belg season (Feb-May) and Kiremt season (Jun-Sep) respectively over the study areas. The spatial distribution of drought frequency and its climate trend as well as different drought grades were obtained by employing the inverse distance weighting (IDW) interpolation method in ArcGIS 10.3.1 platform. So, the annual high drought frequency mainly concentrated in the Eastern some pocket areas of Fedis. From South to West part of Deder were observed slight to moderate drought. During Belg season, spatial pattern in SPI index, from central to South and Western part of Deder areas were observed slight to moderate drought respectively. In Kiremt season, spatial pattern in SPI index, Western part of areas was observed slight drought and in the Southern parts of areas was observed moderate drought. The annual drought frequency expanded from North to central part of Shinile woreda, large portion of area covered by moderate drought (was shown dry). In Shinile woreda, for some very small pocket areas were hit by slight and moderate MD while the majority of the areas under the influence of severe and very severe level of MD. During Belg (FebruaryMay) and Kiremt (June) the Meteorological drought risk map has been prepared by integrating from the drought index, SPI. The probabilities of occurrence of MD ranges were from 3 times to 13 times for no drought to very severe drought severity level. In Shinile woreda, during Belg season, in the tip of North small area is categorized very severe drought (11-13); in Kiremt season, from North Western to North tip areas were categorized moderate drought (5-6) to very severe drought (11-13). In Deder woreda, in Belg season, from South Eastern to South western was shown severe drought (7-10). And South tip part of areas was shown very severe drought (11-13). Whereas, during Kiremt season, in North West parts of area was observed severe drought. In Fedis woreda, in Belg season, in East some part of pocket area was severe drought (11-13), whereas, during Kiremt season, in South tip and in western small parts of areas were observed severe drought (11-13). So, Meteorological drought risk can be viewed as a product of both exposures to the climate hazards and the vulnerability of farming or cropping practices to drought conditions. Thus, Meteorological drought can be useful to guide decision making process in drought monitoring and to reduce the impact of drought on agricultural production and productivity, while identifying appropriate sites for specific adaptation and mitigation actions. In general, this information is in agreement with the result obtained from the analysis climate and yields data to reduce the impact of drought on agricultural production in study areas.
There have been many climate related disasters, such as drought, that have led to famine in Ethiopia. The experience has led to the evolution of an excellent early warning and response mechanisms in Ethiopia. The NMSA provides weather forecasts and the DPPB provides the famine early warning system and assesses the food supply in the country. The situation of the 1980 to 2016 case teaches us that drought studies are very important for study areas because these areas are aid dependent and recurrent drought experienced. Drought early warning based on onset, secession, LGP and dry spell information have to be practiced by study areas. So with credible drought information with a longer lead time, the national government can and in western small parts of areas were observed severe drought (11-13). So, Meteorological drought risk can be viewed as a product of both exposures to the climate hazards and the vulnerability of farming or cropping practices to drought conditions. Thus, Meteorological drought can be useful to guide decision making process in drought monitoring and to reduce the impact of drought on agricultural production and productivity, while identifying appropriate sites for specific adaptation and mitigation actions. In general, this information is in agreement with the result obtained from the analysis climate and yields data to reduce the impact of drought on agricultural production in study areas indicate that the occurrences of drought in study areas showed temporal variation.
Based on the findings of the study, the following recommendations are suggested:
The authors are grateful to Adama Science and Technology University and lecturers who showed the research principles and they lead me on how to work the research methodologies. I want to gratitude my brother Getahun M. that he funded to me with the payment for this paper publishing or he provided financial support to my study. Finally, I am also grateful to Ethiopian National Meteorology Agency for providing rainfall data for this study.
Citation: Muche T. Meteorological Drought in Three Woredas of Eastern Harerghe and Shinile Zones, Ethiopia. J Climatol Weath Forecast. 2022, 10 (3), 001-009.
Received: 07-Feb-2022, Manuscript No. JCWF-22-15713; Editor assigned: 09-Feb-2022, Pre QC No. JCWF-22-15713(PQ); Reviewed: 23-Feb-2022, QC No. JCWF-22-15713(Q); Revised: 28-Feb-2022, Manuscript No. JCWF-22-15713(R); Published: 07-Mar-2022, DOI: 10.35248/2332-2594.22.10(3).340
Copyright:This is an open access article distributed under the terms of the Creative Commons Attribution License, which permits unrestricted use, distribution, and reproduction in any medium, provided the original work is properly cited.
