Research Article - (2015) Volume 3, Issue 3
Keywords: RCP; GFDL-ESM2M; ACCESS1-0; HadGEM2-ES
The major cause for total annual crop losses in agriculture across the world is related to weather and climatic effects such as drought, flash flood, untimely rain, frost, hail and storms [1]. Rising temperature, drought, flood, desertification and weather extremes severely affect agriculture, especially in the developing countries [2]. The Ethiopian economy is more dependent in Agriculture which contributes about 41% of the total GDP, 80% of the employment and the majority of foreign exchange earnings [3]. Many African countries including Ethiopia, their agricultural system is highly sensitive to climate, extreme weather events and climatic conditions which have major impacts on agriculture. Sesame is an important oil seed crop and is grown in tropical zones as well as in temperate zones between latitudes 40°N and 40°S [4]. The third assessment report of the International Panel on Climate Change (IPCC) indicated that developing countries are expected to suffer most from the negative impacts of climate change and climate variability [5].
Area description
Kafta Humera is located in the north-western Ethiopia and in the western part of Tigray Regional State Figure 1 and 585 km away from Mekelle and is located at 14o15’ latitude and 36o37’ longitude. Kafta Humera is bordered with “Tsegede” on the south and with Sudan in the west. In the north, the Tekeze River separates the district from Eritrea, in the east “Tahtay-Adiyabo” bordered with the district and in the southeast with “Wolqayt”. The district covers an area of 632,877.75 ha which is about 23.6 percent of the western zone of Tigray (Figure 1).
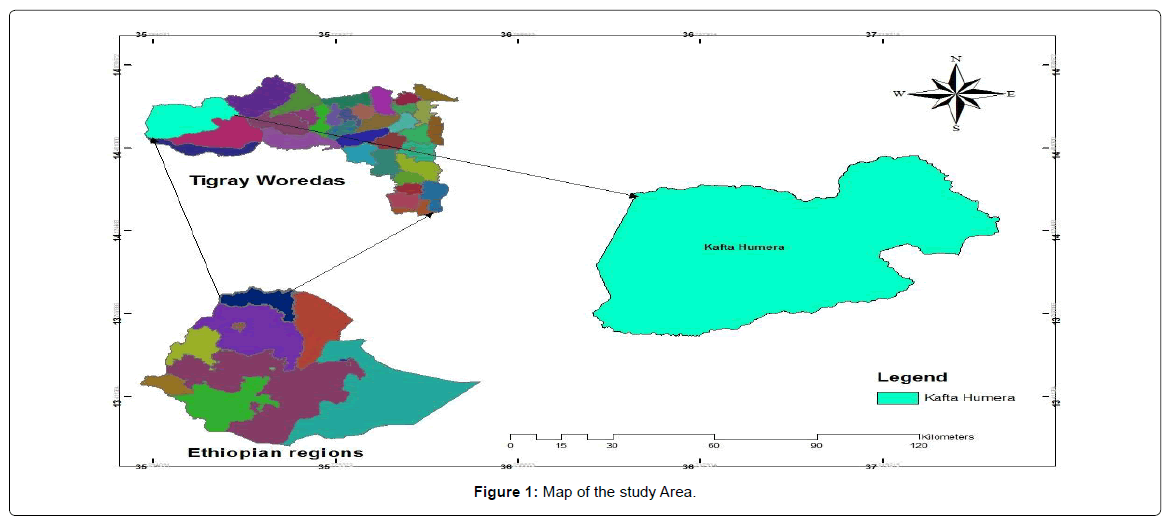
Figure 1: Map of the study Area.
Data collection
Climate, crop and management and soil data: Daily rainfall data of the study area were obtained from the National Meteorological Service Agency (NMA) of Ethiopia which is from 1980-2009 with some data gaps. The quality of the datasets was checked using freely available “tamet” software. R software script was later used to generate future climate scenarios for the near (2010-2039), mid (2040-2069) and end (2070-2099) of century using the fifth phase coupled model intercomparison project (CMIP5) protocol. Even though, there are about 20 GCM outputs in the CMIP5, only three; HadGEM2-ES, GFDL-ESM2M and ACCESS1-0 climate model were used in this study. Moreover, for the Aqua Crop model, climate data (temperature, rainfall, solar radiation, evapotranspiration and relative humidity), Crop and agronomic parameter (sowing date, sowing depth, flowering date, maturity date, days to emergency, days to heading, grain yield, fertilizer rate, type and application time, seed rate and other management activities were collected from Humera agricultural research center.
Climate data preparation: The inputs of Aqua Crop model are climate, crop, field management and soil while the required output is yield. In simulating yield, four files with extension CLI, ETo, PLU and TEMP were used. CLI is a program file which consists ETo file (reference evapotranspiration), PLU file (for rainfall) and TEMP file (for maximum and minimum temperature). ETo was calculated using Hargreaves equation [6] by the formula: ETo=0.0023 (Tmean+17.8) (Tmax-Tmin) 0.5 Ra.
Where T=average temperature Tmax=maximum temperature, Tmin=minimum temperature, Ra=radiation.
Method of data analysis
For preparing Aqua Crop simulations, the instructions for running the simulation were modified to accommodate different sets of weather records and soil types. The climatic inputs used for the Sesame yield simulation was examined for four time periods; a baseline of climate (1980-2009) and for three future 30-years’ time slices (2010-2039, 2040-2069 and 2070-2099) using RCP 4.5 and RCP 8.5.Three time periods (near term, midterm and end term) and two Representative Concentration Pathways (RCP4.5 and RCP8.5) and three sowing scenarios (Early, Normal and Late) were used to assess the impact of climate change on Sesame production in the study area. A fixed sowing date was set in the model by considering criteria when cumulative rainfall amount of 20 mm occurred over three consecutive days. It was achieved by introducing this condition in the sowing rule of the manager file.
Future climate of the study area
Projected rainfall: The GFDL-ESM2M climate model has predicted rainfall to increase by 8.2% under RCP4.5 in the near term. In the midterm, GCM ACCESS1-0 has shown a reduction of rainfall by 4.1% under RCP4. Similarly, GCM ACCESS1-0 and HadGEM2-ES climate models predicted rainfall to increase by 2.3% and 1% under RCP8.5 in the near term, respectively. In the mid-term (30 years) GCM GFDLESM2M has shown a reduction of rainfall by 6.6% under RCP8.5. However, in the end term, all models have projected a decreased rainfall under RCP4.5, while an increased rainfall was projected by ACCESS1-0 (4.4%) and GFDL-ESM2M (1.1%) under RCP8.5. Even though the magnitude of the change was small, precipitation was projected to increase under RCP8.5 for all time periods (Table 1).
| Periods | RCP4.5 | RCP8.5 | ||||
|---|---|---|---|---|---|---|
| ACCESS1-0 | GFDL-ESM2M | HadGEM2-ES | ACCESS1-0 | GFDL-ESM2M | HadGEM2-ES | |
| Near-term | -2.92 | 8.19 | -2.19 | 2.32 | -2.43 | 0.94 |
| Midterm | -4.11 | 4.25 | 0.47 | 5.17 | -6.60 | 4.16 |
| End Term | -3.45 | -1.27 | -2.87 | 4.39 | 1.12 | -0.37 |
Table 1: Summarized expected future (near, mid and end term) changes of rainfall (%) compared to the baseline.
Projected temperature: The models GFDL-ESM2M and HadGEM2-ES has shown a decreasing of temperature in the near and end term. In the mid-term, almost all models projected an increment of temperature will be occurred. However, the magnitude of increment will not be below 1°C except GCM ACCESS1-0 (1.01°C). This is also very similar with the near term RCP4.5. In the end term RCP8.5, almost all models simulate an increment of temperature by nearly 2°C (Table 2).
| Periods | RCP4.5 | RCP8.5 | ||||
|---|---|---|---|---|---|---|
| ACCESS1-0 | FGDL-ESM2M | HadGEM2-ES | ACCESS1-0 | FGDL-ESM2M | HadGEM2-ES | |
| Near-term | 1.21 | 0.98 | 1.29 | 0.02 | -0.03 | 0.24 |
| Midterm | 1.01 | 0.37 | 0.79 | 0.75 | 0.93 | 0.81 |
| EndTerm | 0.08 | -0.13 | -0.02 | 1.84 | 1.46 | 2.27 |
Table 2: Summarized expected future (near, mid and end) changes of maximum temperature (°c) compared to baseline.
Unlike the maximum temperature, the minimum temperature was predicted to increase using all GCM models. In the near term RCP8.5 and end term RCP 4.5, all models projected that the increase in minimum temperature will be below 1°C. Both RCPs of mid-term and near term RCP 4.5 indicated very similar temperature increments. However, in the end term under RCP8.5 all models projected to experience higher temperatures in the study area (Table 3).
| Periods | RCP4.5 | RCP8.5 | ||||
|---|---|---|---|---|---|---|
| ACCESS1-0 | GFDL-ESM2M | HadGEM2-ES | ACCESS1-0 | GFDL-ESM2M | HadGEM2-ES | |
| Near-term | 1.21 | 1.04 | 1.40 | 0.11 | 0.13 | 0.29 |
| Midterm | 0.91 | 0.21 | 1.81 | 1.04 | 1.23 | 0.99 |
| End Term | 0.21 | 0.75 | 0.11 | 2.23 | 2.23 | 2.88 |
Table 3: Summarized expected future changes (near, mid and end) of Minimum Temperatures (°c) compared to the baseline.
Generally, the climate models have shown an increase in temperature under future scenario even though there are slight differences in the magnitudes and extents of changes. The increase was slightly higher for minimum temperature than maximum temperature. In both maximum and minimum temperatures, all models signified that the temperature would reduce under RCP8.5 compared to the RCP4.5 during the near term period. This could be attributed due to the increase in rainfall of this period. The difference in temperature between RCP8.5 and RCP4.5 with in the same period could be due to the elevated concentrations of greenhouse gases. Compared to the east African projections (1.1 to 6.4°C), the study area could experience lower temperature and increments in the amount of rainfall [7]. However, in hotter areas, even a slight change in temperature could have a detrimental effect on crop production. Hence, the impact of climate change could be more in the end term as temperature is projected to increase and precipitation decreases.
Monthly rainfall of the study area: The area is characterized by unimodal rainfall with the highest rainfall in July and Augest months. In the near term RCP4.5, GCM ACCESS1-0 in Jun (-13.6%) and GFDL-ESM2M in Augest (-12.7%) and September (-18.3%) revealed the highest reduction in rainfall. Similarly, in the mid term, GCM ACCESS1-0 in september (-13.3) and GFDL-ESM2M in June (-17.5%) demonstrated a decrease in rainfall. Similarly, in the end term RCP4.5, only GFDL-ESM2M model in June (-15.2%) has shown reduction in rainfall (Table 4).
| Periods | Near term | Mid term | End term | |||||||||||||||
|---|---|---|---|---|---|---|---|---|---|---|---|---|---|---|---|---|---|---|
| RCP_4.5 (Rainfall deviation in (%) | RCP_8.5 (Rainfall deviation in (%) | RCP_4.5 (Rainfall deviation in (%) | RCP_8.5 (Rainfall deviation in (%) | RCP_4.5 (Rainfall deviation in (%) | RCP_8.5 (Rainfall deviation in (%) | |||||||||||||
| Month | ACCESS1-0 | GFDL-ESM2M | HadGEM2-ES | ACCESS1-0 | GFDL-ESM2M | HadGEM2-ES | ACCESS1-0 | GF DL-ESM2M | HadGEM2-ES | ACCESS1-1 | GFDL-ESM2M | HadGEM2-ES | ACCESS1-0 | GFDL-ESM2M | HadGEM2-ES | ACCESS1-0 | GFDL-ESM2M | HadGEM2-ES |
| Jun | -13.6 | 10.28 | -5.1 | -14.1 | 9.9 | -9.8 | -2 | -17.5 | 5.1 | 16.88 | -11.3 | 15 | 3.5 | -15.2 | 6.3 | 5.8 | -14.2 | 23.6 |
| Jul | 4 | -9.73 | 7.1 | 4.6 | -8.9 | 14 | -3.3 | 14.7 | -9.4 | -5.15 | -1.3 | -12.6 | -6 | 3.8 | -7.6 | -2.1 | -4.4 | -12.5 |
| Aug | 10.1 | -12.69 | 1 | 8.1 | 3.8 | 7 | -9.6 | -0.1 | -5.5 | -3.45 | -2.6 | -3.6 | -6.9 | -2.2 | -1.8 | -0.7 | -7.3 | -11.3 |
| Sep | 10.5 | -18.3 | 0.9 | 4.1 | -20.2 | -2.1 | -13.3 | 18.1 | 10.3 | -7.69 | 2.4 | 24 | -5 | 7.3 | 7.5 | -12.2 | 9.7 | 7.2 |
Table 4: Deviations of predicted monthly rainfall relative to the baseline under the three periods.
In the near term RCP8.5, the GCM ACCESS1-0 in June (-14.1%) and GFDL-ESM2M in September (-20.2%) has shown a decrease in rainfall. Moreover, GFDL-ESM2M in June (-11.3%), HadGEM2-ES in July (-12.6%) in the midterm and ACCESS1-0 in September (-12.2%), GFDL-ESM2M in June (-14.2), HadGEM-ES in July (-12.5%) and August (-11.3%) in the end term revealed the highest reduction in rainfall from the base. To the contrary, HadGEM-ES model has shown the highest increment in rainfall in the midterm in September (24%) and end term June (23.6%) under RCP8.5.
Model calibration
There is no universal model that works everywhere and hence, to capture the variability at the intended site, model calibration is important. The following inputs were used for calibration of the AquaCrop model. In addition to the crop and climate parameters, soil data was also entered into the model (Table 5).
| Parameter | Value | |
|---|---|---|
| Canopy expansion | Very fast to CGC | 17.9% per day |
| Shape | 3 | |
| Stomata closure | Moderately sensitive to water stress | |
| Canopy size | 5 cm2 per plant | |
| Plant density | 20 plant per m2 | |
| Maximum canopy cover | Very thiny cover | 60% |
| Canopy decline | Very fast | 10 days |
| Date of emergency | 4 days | |
| Senescence | 71 days | |
| Date of maturity | 94 days | |
| Yield build up HI | 47 days | |
| Day of flowering | 43 days | |
| Harvest index | 40% | |
| CWP | 14 g/m2 |
Table 5: Input parameters used for Aqua Crop model calibration.
Model performance evaluation
The performance of the Aqua Crop model in predicting the grain yield was evaluated using the root mean square error (RMSE) and the index of agreement. The Root mean square error (RMSE) quantifies the patterns of similarity by measuring the differences between values predicted by the model and the values actually observed while index of agreement (d) is a measure of agreement of the observed and simulated model (0 ≤ d ≤ 1).
For model evaluation, an independent data set of two years (2010 and 2011) which were not used in the model calibration was used. Hence, the index of agreement (d index=0.98) was able to reproduce the observed data with a very good agreement. In the same way, the root mean square error (RMSE=0.16) which indicates the pattern of similarity between the observed and simulated values indicates a promising result. Therefore, both statistical tools revealed that the Aqua Crop model can be used for further simulations.
Impact of climate change on sesame production by sowing date during the baseline period
Accordingly, the historical yield of sesame was obtained by providing the historical (baseline) climate data and other management factors to the model (Aqua Crop).The three sowing dates was evaluated using a statistical test and no significant difference (p=0.34) was found between groups (the sowing dates) (Figure 2).
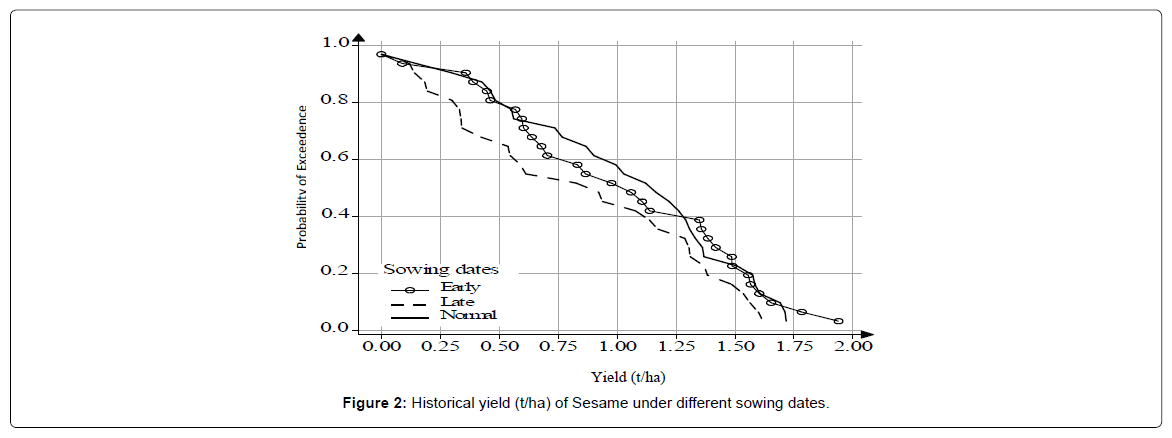
Figure 2: Historical yield (t/ha) of Sesame under different sowing dates.
Apart from the statistical tests, cumulative density function was used to see the probability of sesame yield. Accordingly, normal sowing date which is currently being practiced by the farmers was found to yield better compared to late sowing. The probability of getting 1 t/ha of sesame yield was nearly 60% for normal sowing, while about 50% and 45% for early and late sowing respectively. With certain adaptation this yield could be attained, however, the probability of getting 1.5 t/ha of yield was very unlikely (20%) which needs more cost of adaptation to get this yield.
Impact of climate change on sesame production by GCM, sowing date and time period
From the (30 years) historical data, predicted climate data were also used to simulate grain yield and accordingly evaluate the impact of climate change on yield of each sowing dates. The likely future deviation of yield from the base year yield of each sowing date was summarized in the following Table 6.
| Periods & RCPs | GFDL-ESM2M | HadGEM2-ES | ACCESS1-0 | ||||||
|---|---|---|---|---|---|---|---|---|---|
| Normal | Early | Late | Normal | Early | Late | Normal | Early | Late | |
| NT_rcp4.5 | 22.29 | 13.67 | 1.79 | 14.68 | 4.14 | -11.25 | 27.39 | 14.31 | -19.22 |
| NT_rcp8.5 | 24.05 | 18.95 | 1.68 | 8.49 | 2.11 | -16.63 | 22.92 | 17.66 | -13.48 |
| MT_rcp4.5 | 33.09 | 25.44 | 2.81 | 18.63 | 14.3 | -1.94 | 32.9 | 25.12 | -17.95 |
| MT_rcp8.5 | 22.61 | 19.17 | -6.87 | 16.81 | 15.28 | 4.16 | 15.99 | 21.22 | -10.96 |
| ET_rcp4.5 | 32.32 | 22.14 | 2.11 | 25.95 | 19.58 | 3.78 | 32.31 | 22.14 | -8.79 |
| ET_rcp8.5 | 23.58 | 16.55 | -5.88 | -3.34 | -2.07 | -23.31 | 25.01 | 16.53 | -21.97 |
Table 6: Changes of Sesame yield (%) relative to the baseline by sowing date, time period (near, mid and end term) and GCM scenarios.
In all periods and both RCPs yield has increased between 22.29 and 33.09% in the normal sowing date. Similarly, in the early sowing date, an increment of yield between 13.67 and 25.44% was projected by the GFDL-ESM2M climate model. However, in the late sowing date, yield was reduced in the midterm (-6.87%) and end term (-5.88%) under RCP8.5. The reason why the yield deviation obtained on late sowing was very low could be due to the inadequate amount of precipitation to meet the crop water demand as late sowing exposes the crop to an extended dry spells. Extended dry spells occur during the mid-season stage of a late sown crop due to cessation of rainfall in early to mid of September. Generally, use of late sowing might experience more impacts of climate change as rainfall ceases during the critical growth stages of the crop. In mid and end term periods and all sowing dates (normal, early and late) higher yield was projected under RCP4.5 compared to RCP8.5. However, in the near term period, the yield was higher under RCP8.5 in all sowing dates.
In the normal sowing date, yield has increased between the range of 8.5% and 26% using the Had-GEM2-ES model, however, a reduction of yield was observed in all sowing dates under RCP8.5. Similarly, the yield was projected to increase between 2.11% and 19.58% in the early sowing date under both RCPs. In the late sowing date, yield was only increased in the midterm RCP8.5 (4.16%) and end term RCP4.5 (3.78%). However, the highest yield reduction was projected in the end term RCP8.5 (-23.31%) followed by near term RCP8.5 (-16.63%).
Using the ACCESS1-0 climate model, the yield of sesame was projected to increase between the range of 16% and 32.9% in the normal sowing date in all periods and both RCPs. Even in the early sowing date, the yield was increased between 14.31% and 25.12%. However, in the late sowing date, yield was simulated to decrease between the range of -8.8% and -21.97% in all periods and RCPs.
Sesame yield probabilities by RCP and planting date during the near term period (2010–2039)
The temporal impact of climate change was evaluated based on the yield difference relative to the baseline (1980–2009). Graphically probability of exceedence was drawn to show the difference of simulated yields based on the three sowing dates and three GCMs and two RCPs in comparison with the baseline scenario.
In the early sowing date, the probability of getting 1t/ha was indicated to be 60% by the three climate models under RCP4.5, while below 40% for 1.5 t/ha of yield. In the normal sowing date, the probability of getting 1t/ha was about 65% by the ACCESS1-0 GCM, while the remaining two demonstrated about 75% of probability under RCP4.5. Here, all models agreed with the probability of getting 1.5 t/ha was 40%. In the late sowing date, the highest probability of obtaining yield was observed by ACCESS1-0 followed by GFDL-ESM2M. However, Had GEM2-ES model has been similar with the baseline yield (Figure 3). In the near term RCP8.5, the probability of getting 1t/ha were about 50% by HadGEM2-ES, 60% (ACCESS1-0) and 65% (GFDL-ES M2M) in the early sowing date. Similar to the RCP4.5 of this sowing date, the probability of getting 1.5t/ha was below 40% by all models. In the normal sowing date, almost all models indicated that the probability of getting 1t/ha was about 70% under RCP8.5. Similarly, all models demonstrated below 40% probability of getting 1.5 t/ha of yield. In the late sowing of RCP8.5 the GFDL-ESM2M revealed better yield, while the remaining two models coincides with the base year yield. Generally, in the near term, the intermodal variability was low in the early and normal sowing dates under both RCPs. However, the variability between models was observed to be higher in the late sowing date of both RCPs. Unlike the two models, ACCESS1-0 GCM demonstrated an increasing probability of yield. In RCP8.5 for this plantation date, both HadGEM2-ES and ACCESS1-0 indicated almost the same yield comparing the base year yield which clearly indicated that the yield has greatly reduced here. In the contrary, GFDL-ES M2M has confirmed a higher yield than the other models in RCP8.5 of late sowing. In summary, in the near term using the normal planting date was found better as models consistently simulate higher yield than early and late sowings.
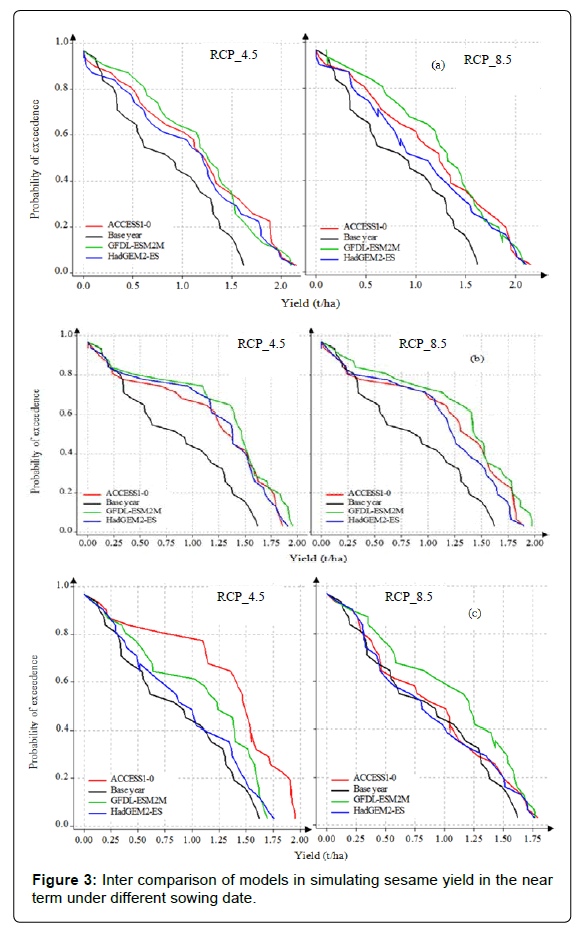
Figure 3: Inter comparison of models in simulating sesame yield in the near term under different sowing date.
Sesame yield probabilities by RCP and planting date during the midterm period (2040–2069)
Similar to the near term, in the early sowing all models simulate better yield than the base year. Not only this but also, the simulated yield between RCP4.5 and RCP8.5 of this sowing date were almost the same. This was even similar to the near term early sowing date of both RCPs. In the normal sowing date (Figure 4).
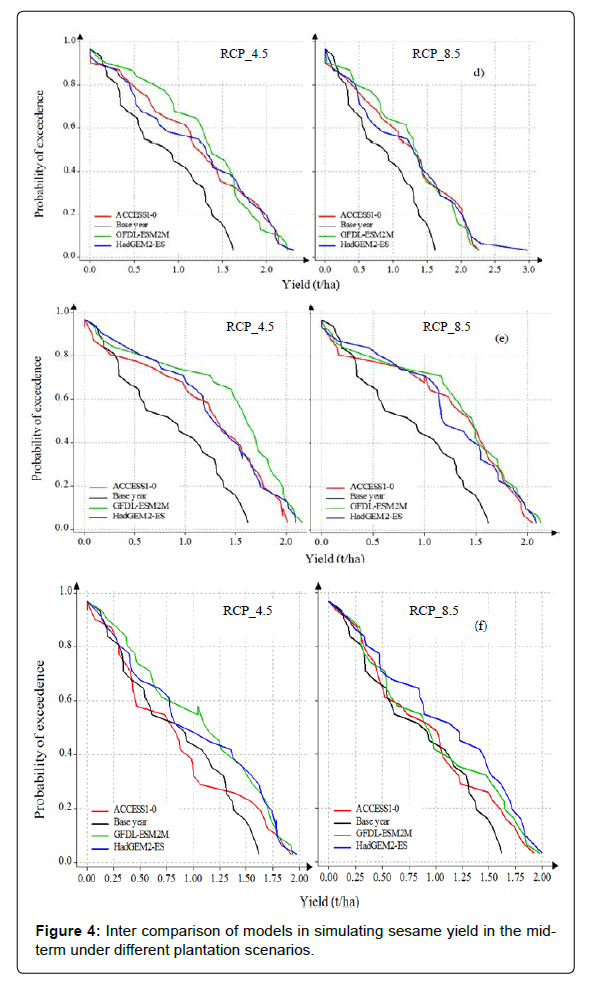
Figure 4: Inter comparison of models in simulating sesame yield in the mid-term under different plantation scenarios.
Almost all models simulate similar probability of getting 1t/ ha of yield. However, to get 1.5 t/ha GFDL-ESM2M indicated 60% probability in the RCP4.5 while the remaining models indicate 40% probability in both RCPs. In the late sowing date, GCM ACCESS1-0 revealed 30% while the others about 50% probability of getting 1 t/ha of yield in RCP4.5. Similarly, ACCESS1-0 has shown a reduced yield (25%) and the remaining 35% probability to get 1.5 t/ha in both RCPs. In RCP8.5 the same probability (40%) was indicated by ACCESS1-0 and GFDL-ESM2M models with the base year to get 1t/ha of yield, while 50% by HadGEM2-ES. Generally, even in this period normal sowing date reveals a better yield than early and late sowing dates.
Sesame yield probabilities by RCP and planting date during the end term period (2070–2099)
In the end term RCP4.5 of early sowing date, all climate models simulate similar yield probabilities like in the near and midterm periods. Nevertheless, in RCP8.5 HadGEM2-ES and ACCESS1-0 has shown 50% of probability to obtain 1t/ha, while GFDL-ESM2M predicted 60% of probabilities? The possibilities of getting 1.5t/ha was about 35% in both RCPs (Figure 5).
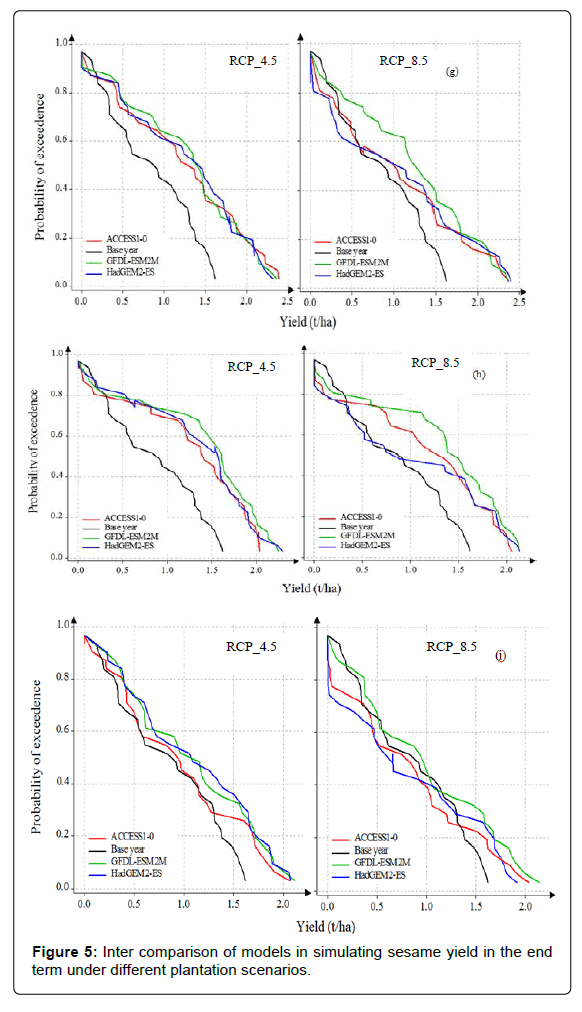
Figure 5: Inter comparison of models in simulating sesame yield in the end term under different plantation scenarios.
In the normal sowing date RCP4.5, the probability of getting 1t/ ha was 70% by all models, while below 50% of probability to achieve 1.5 t/ha of yield. However, in the RCP8.5, there is a model variability to attain 1 t/ha. HadGEM2-ES simulated 45% while ACCESS1-0 and GFDL-ESM2M 60% and 70% of probability, respectively. To obtain 1.5 t/ha of yield, all models agreed with the probability of 40%. In the end term or late sowing, almost all models suggested a very similar yield in comparison to the base year. In the RCP4.5, the probability of getting 1t/ha and 1.5 t/ha was about 50% and 35, respectively. However, in RCP8.5, the probability of getting 1 t/ha has reduced to 40% while it remains the same in achieving 1.5 t/ha. In conclusion, yield has decreased in the end term in all plantation scenarios and similarly temperature was projected to increase and precipitation to decrease in this period. However, in all periods (near, mid and end term) normal plantation date was better than early and late sowing dates and there was less variability of yield between models in both RCPs and sowing scenarios, This can be evidenced by the occurrence of almost insignificant changes of the rainfall over the historic records.
Ethiopia’s economy is highly dependent on climate sensitive sector, rain fed agriculture and hence variability or change of climate might have major impacts on future livelihood of the people. the climate models revealed that the increase in temperature will be slightly higher in the minimum than maximum temperature. In both maximum and minimum temperatures, all models indicated that temperature will be dropped under RCP4.5 compared to the RCP8.5 in the near term. However, in already hotter areas even a slight change in temperature could have a detrimental effect on crop production. Hence, the impact of climate change could be more severe during the end term period as temperature and preciptation are projected to increase and decreases, respectively. The increase in temperature in these periods could induce a significant impact on crop production.
Modeling of sesame production using Aqua Crop has sufficiently reproduced the observed data and hence, was found convincing in using this model for predicting the impact of climate change. This was approved by measuring the performance of the model based on root mean square error (RMSE=0.16) and index of agreement (d index=0.98). In the study area early sowing date was the most common sowing date of sesame used by most farmers. This study indicated thatseasame perform well when normal planting was used compared to early or late sowing. Generally, the climate of the study area has significantly been changed putting its consequences on agricultural crops, which is evidenced by the change in annual rainfall totals, rainy days, length of growing period and onset date of the historical years. As a recommendation Climate change will have a negative impact on the selected local sesame cultivar (Hirhir) in all sowings, hence, July 7 sowing date was recommended based on the gate high yield. The response of sesame cultivars to the future climate changes should be studied under different management options. The impact of climate change should also be studied by different crop and climate models so as to capture the possible variability of sesame yield. Sensitivity to carbon dioxide, temperature, rainfall and other different management activities should be undertaken.
