Case Report - (2022) Volume 10, Issue 12
The rapid pace of urbanization in many cities of the world has led to the transformation of natural landscapes into artificial surfaces with considerable effects on the environment. It has occasioned inadvertent alterations in surface thermal characteristics, local and regional climate and the geophysical conditions of the urban environment. Increasing rates of urbanization with continuous alterations on the natural surface features are expected to continue with its attendant problems in the near and far future. Thus, this study adopted geospatial techniques using Landsat observed TM, ETM+ and TIRS/OLI data for the years 1984, 2000 and 2018 to investigate the spatial and temporal variation in Land Surface Temperature (LST) associated with urbanization processes in the city of Ibadan, Nigeria. An attempt was made to project future surface thermal changes by simulating LSTs for 2028, 2038 and 2048, using the Cellular Automata Markov (CA-Markov) Model and a stepwise multiple regression analyses model. A quantitative analysis of the past and future LST impacts of urban land cover change was carried out. The simulations showed that the temperature values ranged between 24.65°C–39.40°C in 2028, 25.31°C-42.52°C in 2038 and 25.89°C–44.21°C in 2048. Notable increases in the simulated LST in the urban areas, particularly the city centres were observed to be relatively higher when compared with past years. The rural and suburban areas are experiencing rapid urbanization, which led to transitions from low and medium temperatures to relatively higher projected temperatures in the future years.
CA Markov • Ibadan • Land Surface Temperature • Urbanization
The urban air temperature is gradually rising in most regions of the world. One of the possible causes is the drastic reduction of greenery in the cities [1]. Urban transition in developed countries is observed to have been mostly accomplished in the 21st century, making the current growth of cities to be mostly associated with developing countries [2]. Rapid ruralurban migration and population growth in the cities over the past decades have led to an unprecedented rate of urbanization globally, and it is likely to continue in the subsequent decades [1]. Land surface temperature is a very significant environmental parameter its intensities and magnitude are determined by land use and landscape configurations. Globally, land use and land cover changes have been identified as key environmental issues of concern [3-5].
It has been shown in Figure 1 several studies that high temperatures within urban areas are largely associated with impervious surfaces, considering their high rate of heat absorption, slow pace of latent heat transfer as well as peculiar low thermal emissivity [6-9]. During the process of urbanization, a direct environmental consequence is the modification of land surfaces which results in the alteration of its physical properties including soil moisture, material heat capacity, and surface reflectivity and emissivity [10]. These alterations in the physical properties play a significant role in the net surface temperature, 2011 reported for Akure, another southwestern city in Nigeria that urbanization-induced land use land cover changes will have serious implication on the local climate of the city and also contributes to greenhouse gases as the carbon sinks would have been depleted in the future years. Several cities in the southwest province of Nigeria are experiencing rapid urbanization, which has produced a remarkable effect on the surface thermal response. This effect significantly influences urban internal microclimatology on a regional scale [10], Land surface and atmospheric temperatures rise by various anthropogenic activities like increased land surface coverage by artificial materials, removal and alteration of natural surfaces and transformation of such surfaces into artificial, impervious surfaces which have a high heat capacity and conductivity. Some worries rising temperatures in developed areas could have an adverse impact and increase human bioclimatological discomfort within city areas [7].

Figure 1:Map of Ibadan Metropolis
In previous studies, attempts have only been made to simulate previous and future urban expansion using diverse analytical tools [11]. These tools make use of several methods such as Markov Chain, Cellular Automata, Logistic Regression, and Artificial Neural Networks (ANN). However, lesser attempts to simulate future LST associated with urbanization processes using these tools and methods have been made. Land surface temperature is an important environmental parameter that has a unique influence on the land use land cover configuration. With recent advancements in LST retrieval algorithms and progress in studies bothering on the relationship between LST and land use land cover, limited studies have considered making projections for future LSTs. In this study, we project LST patterns in the city of Ibadan to future years in two epochs based on projected land use spatial patterns. A hybrid approach that comprises remote sensing techniques of Cellular Automata/Markov chain / Multi (CA Markov) Criteria/Multi-Objective Land Allocation (MOLA) and statistical analysis of a step-wise regression model was devised to perform simulation of future changes in LSTs that are associated with land use and cover dynamics.
The ancient city of Ibadan in Nigeria has experienced unprecedented and untamed economic growth, as well as uncontrolled rural-urban migration. This has resulted in the rapid development of mini-cities, commercial hubs, towns and settlements which constitutes the Ibadan metropolis as seen today. Increasing rates of industrialization and urbanization, removal and conversion of natural vegetated surfaces and land covers into artificial and man-made surface coverings, are all the characteristics of the study area. From 1986 to date, the alterations in urban land use and the surface cover has been on the increase due to massive commercial, construction and other forms of socio-economic activities in the designated areas of the Metropolis [12]. Quite many studies have been conducted on Ibadan City to monitor land use land cover changes and land surface temperatures, as well as to analyze the relationship between the LULC patterns and LSTs, [13-16], using remote sensing techniques. However, none has provided any information on future projections.
This research aims to predict future changes in LST as a result of land use and land cover changes using a hybrid approach for making informed and data-driven decisions for sustainable urban growth and planning in the city. To achieve this goal, understanding the nexus between land use and land cover changes and future climate projections is essential. An ancient city like Ibadan with the current rapid rate of urban expansion calls for urgent necessary precautions. Thus, an attempt to monitor these changes and predict the implication of LULC changes on LST for future years, is a proactive step that will assist in decision-making, policy formulation and implementation, as well as achieving localized adaptation and mitigation strategies in the study area.
Study area
Ibadan is an ancient city and the capital of Oyo State, Nigeria. It is located approximately on longitude 3°50’0” to 3°58’30” East of the Greenwich Meridian and latitude 7°19’30” to 7°27’30” North of the Equator at a distance some 145 km Northeast of Lagos. Ibadan is the administrative capital of Oyo state, the most populous city in the state and the third most populous city in Nigeria (after Lagos and Kano). It is located in southwestern Nigeria; its population is well over 3 million people and is expected to hit well over 4 million in coming years.
It is the country’s largest city by geographical area. At the time of Nigeria’s Independence in 1960, Ibadan is the largest city in West Africa and the second-largest city in Africa after Cairo. Ibadan had been the centre of administration of the Old Western Region since the days of the British Colonial rule and parts of the city’s ancient protective walls still standbe cited in order. till the present day. The principal inhabitants of the city are the Yorubas as well as various other tribes ranging from Igbos, Hausas and a lot more.
The Climate system of Ibadan is the Tropical Wet and Dry climate (Koppen Climate Classification Aw), characterized by a somewhat lengthy wet season and a relatively constant temperature throughout the year. Its wet season runs from March to October with a little break in precipitation (August Break). This break nearly divides the wet season into two different seasons. November to February forms the city’s dry season during which Ibadan experiences the West African Dust Haze/Harmattan. The mean annual rainfall for Ibadan is approximately 1420.06 mm with about 109 rainy days. The city also experiences two rainfall peaks’ one in June and the other in September. The mean maximum temperature is about 36.46°C, the mean minimum temperature is about 21.42°C and the mean annual relative humidity is averagely around 75% [6].
Population growth, rapid urban sprawl and changes in the physical properties of the Earth's surface has been largely experienced in the city. Ibadan, due to its numerous potentials, has become a key centre for industrial, commercial, and residential. Uncontrolled urban development and the lack of proper planning has a major impact on the thermal environment of the city. The changes in land use/land cover patterns cause thermal environmental variation, resulting in the occurrence of UHI effects
This study utilized the reflective bands (Green, red, Near-Infrared (NIR)), shortwave infrared (SWIR) and thermal bands of Landsat thematic mapper (TM), enhanced thematic mapper plus (ETM+), and Operational Land Imager/Thermal Infrared Sensor (OLI/TIRS). Three cloud-free images of Landsat 5 TM, 7 ETM+ and 8 OLI/TIRS were obtained from the archives of the United States Geological Survey (USGS), for the years 1984, 2000 and 2018 respectively as described in Table 1.
Table 1. Table showing list of data and sources
| Data Type | Production Date | Spatial Resolution | Source |
|---|---|---|---|
| Landsat 1984 TM | 18-12-1984 | 30m | USGS |
| Landsat 2000 ETM+ | 6-2-2000 | 30m | USGS |
| Landsat 2018 OLI/TIRS | 16-12-2018 | 30m | USGS |
Landsat 5 (TM) sensor has seven spectral bands with the reflective bands having 30 m spatial resolution and 30m for the thermal infrared band. ETM+ onboard Landsat 7 has eight bands with a resolution of 30 m and 60 m in the reflective and thermal bands respectively. The OLI/TIRS onboard Landsat 8 has nine spectral bands with a spatial resolution of 30 m in the reflective bands and 100 m in the thermal bands. The ETM+ and OLI sensors have panchromatic bands included (not used in this study). The retrieved Landsat images were atmospherically corrected using an empirical method, Dark Object Subtraction (DOS) to reduce the observed dust haze weather conditions.
Retrieval of land cover indices
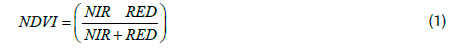
Spectral Indices in the form of Normalized Difference Vegetation Index (NDVI) and Normalized Difference Built-Up Index (NDBI) were used in this study to describe the land cover types. They were also used to quantify the urban temperature feedback; the land cover types and the relationships that exist between them.
Normalized difference vegetation index
The Normalized Difference Vegetation Index (NDVI) measures the greenness of the environment and the amount of vegetation or biomass. A higher NDVI indicates a higher degree of greenness and healthy vegetation. NDVI is probably the most common of these spectral indices for vegetation Figure 2.

Figure 2: Research methodology flowchart.
It is calculated on a per-pixel basis as the normalized difference between the Red and Near-infrared (NIR) bands from an image (see equation. 1). The output of NDVI is a new image layer with values of NDVI ranges from -1.0 to +1.0
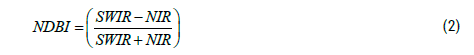
Normalized difference built-up index
Normalized Difference Built-up Index (NDBI) is an index used to assess the extent of built-up areas over time in a particular location. It estimates the difference between the shortwave IR and the Near IR bands (Equation. 2).
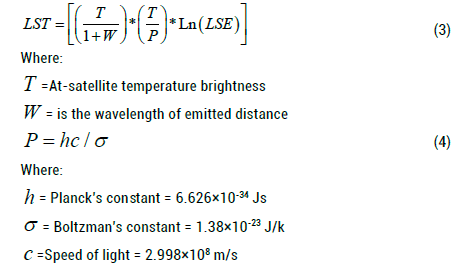
Lad surface temperature
The surface temperature was estimated using the detailed guides rom the Landsat 7 and 8 Science Data User’s Handbook procedure. The estimation of surface temperature is divided into phases as follows:
STEP 1: Converting the Digital Number of the Satellite Image Thermal Band To the Top of Atmosphere (TOA) Radiance
STEP 2: Conversion to At-Satellite Temperature Brightness
STEP 3: Deriving Land Surface Emissivity (LSE)
STEP 4: Calculating the Land Surface Temperature
Projection of future LST from land use and land cover changes
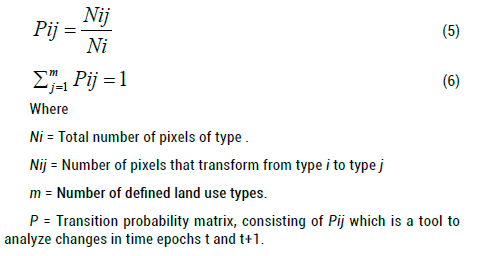
The Cellular Markov Chain analysis is a stochastic model procedure that utilizes a transition probability matrix to simulate land use and landcover changes amongst several land use classes [17]. The transition probability (Pij) is defined by the number of pixels that transform from one land use class, (i) to another land use class, (j) over a given time frame, (t) and (t+1). These complex transition procedures are defined by equations 5 and 6 below:
Several techniques and models have been developed to detect and predict urbanization-induced land use land cover alterations [18-20]. but the choice of the methods, procedures and model used in this study was dependent on appropriate factors, including the scope and objectives of the research, availability of datasets, accuracy and precision of the simulation by the model itself [17,21]. The cellular automata – Markov models have gained attention and been adopted in related studies, largely because of their affinity to geographic information systems and remote sensing which are suitable for comprehensive resolution modelling and simulating dynamic spatial processes. A detailed explanation of the CA Markov Modelling Techniques that was employed in this study was adopted from and as a result, it hasn’t been fully explained in this research [3].
The results of the simulation of the projected land use and land cover were integrated into this hybrid process to assess the impacts of LST on the land use dynamics in the study area, and make future projections.
To estimate the land surface temperatures for the years 2028, 2038 and 2048, statistical analyses in form of correlation analyses were estimated from each of the spectra. After this, a stepwise multiple regression analysis was carried out using the averages of the obtained LST of the years 1984, 2000 and 2018 as the dependent variable while the spectral indices (NDVI and NDBI) were used as the independent variables. Furthermore, a correlation analysis between the aforementioned spectral indices showed that both indices were significantly correlated with each other. The implication of this is that the stepwise regression analyses were conducted based on the NDVI alone. This is done to eliminate the collinearity effect that will arise due to the spectral indices having a significant correlation. The developed regression model was used to estimate per pixel LSTs based on NDVI for 2018 which was then compared to the Landsat retrieved LSTs for 2018. This is done to validate the performance of the regression model by correcting the bias errors for future LST projections. The NDVI was reclassified using CA_Markov techniques in a bid to create a transition matrix, transition area matrix and set of conditional probability images which were then used to model the NDVI for 2028, 2038 and 2048. Conclusively, the modelled NDVI images were used to produce LST pixels of 2028,2038 and 2048 respectively using the validated regression model.
Analyses of land surface temperature
The maps shown in Figure 3 demonstrate the spatial distribution of the land surface temperature over the study area from 1984 to 2018. It was observed in 1984 that the surface temperatures of the core areas of Ibadan (Challenge, Dugbe, Mokola, Oluyole, etc.) were the highest with temperature values ranging approximately between 23.0°-28.22°C. Suburban areas and bare surfaces such as (Alakia, Akobo, Moniya, Olodo, Lalupon, U.I area etc.) in the study area depicts temperature values ranging between 20°C-24°C whereas the larger part of the areas that belong to these classes of land had surface temperatures ranging between 19.2°C-21.56°C approximately. In the year 2000, it is visible that the core areas have expanded considerably when compared to the previous year and the previous image. This was a result of increased anthropogenic activities, constructions, rural-urban migration, etc, which has contributed to the increase in the land surface temperature of the area as resulting feedback. The temperatures in the core areas have seriously increased over the years, with values ranging from 29.3°C–31.18°C. The built-up areas and bare lands like Akobo, Lalupon, Olodo, etc. which previously have temperature values ranging between 20°C-24°C have now increased to within 27.5°C and 31.0°C respectively. The land surface temperature increased seriously in the last decade, the maximum and minimum land surface temperatures observed in 2018 are 38.11°C and 24.01°C respectively. The results from the LULC maps and land surface temperature maps showed that the lowest temperatures conform with areas with high vegetation density and areas with very close proximity to the water bodies. It can also be observed that areas with the highest temperatures are representative of the areas that are densely populated (Table 2).

Figure 3: Land Surface Temperature Map for 3a) 1984, 3b) 2000 and 3c) 2018
Table 2. Table showing the distribution of LST for 1984, 2000, and 2018
| Years | 1984 | 2000 | 2018 |
|---|---|---|---|
| Fig C | °C | °C | °C |
| Minimum LST | 19.8825 | 20.098 | 24.018 |
| Maximum LST | 28.2192 | 31.1812 | 38.1138 |
These results conform with the outcomes of previous research such as [15,19, 22-24], which have collectively shown that densely vegetated surfaces are characterized by lower surface temperatures. This is due to the interception of incoming shortwave solar radiation by the vegetation cover, reflecting a very small fraction of this radiation while absorbing the larger portion of it. The larger portion of the radiation absorbed is transformed into chemical energy. This chemical energy in conjunction with the green pigment named chlorophyll aids food manufacturing procedures in plants called photosynthesis. Open grounds and bare surfaces, on the other hand, do not intercept the incoming solar radiation, rather absorb the larger portion of the radiation and emit it back to the surroundings and into space in the form of long- wave terrestrial radiation which in turn increases the effective temperature of the surrounding air immediately above its surface.
Analyses of Normalized Difference Built-Up Index (NDBI)
Normalized Difference Built-up Index (NDBI) is used to extract built-up features and has indices ranging from -1 to 1. The Normalized Difference Built-Up Index (NDBI) is used to assess the spatial coverage extent of buildings, structures, residential areas etc. in a particular location Figure 4.

Figure 4: Normalized difference built up index map of Ibadan for 4a) 1984, 4b) 2000 and 4c) 2018
The results from this study show that areas like Dugbe, Apata, Challenge, Oluyole, Alaska, Akobo, U.I area, and Eleyele represent the city centres (Urban Areas) and the bulk of the built-up areas; while areas around Lalupon, Moniya, Olodo, Agugu represents the suburban and less built-up areas( Table 3).
Table 3. Distribution of NDBI from Landsat image for 1984, 2000, and 2018
| 1984 | 2000 | 2018 | |
|---|---|---|---|
| Maximum NDBI | 0.61165 | 0.645161 | 0.710491 |
| Minimum NDBI | -0.969697 | -0.0866142 | -0.282676 |
Relationship between LST and NDBI
Figure 5 shows a very strong positive correlation between the LST and NDBI. In other words, LST and NDBI have a direct relationship. This implies that the increase in the removal of vegetation cover and all forms of natural surfaces and transforming them into impervious and artificial surfaces in any geographical location such as it is being observed over the years in Ibadan can effectively increase the Land Surface Temperature. This measure can be employed as an essential and predictive tool in future temperature studies such as thermal comfort and heat stress when planning for megacities, estates and newly constructed roads and buildings.

Figure 5:Relationship between LST and NDBI
The correlation coefficients between the LST and the NDBI for the years of study in this research are outlined in Table 4 above.
Table 4. Correlation Coefficient values for the years under consideration (NDBI).
| Years | Coefficient of determinant (R2) | Coefficient of correlation (R) |
|---|---|---|
| 1984 | 0.7549 | 0.8688 |
| 2000 | 0.5951 | 0.7714 |
| 2018 | 0.6985 | 0.8357 |
Analyses of Normalized Difference Vegetation Index (NDVI)
The Normalized Difference Vegetative Index (NDVI,) is a calculation, based on the principle that actively growing green plants strongly absorb radiation in the visible region of the spectrum (the PAR or Photosynthetically Active Radiation) while strongly reflecting radiation in the near- infrared region. In Figure 6 below, it is shown in Table 5 that low values of NDVI (brown areas) correspond to, bare lands, commercial, industrial, urbanized and residential areas concentrated majorly around the centre of the city. High values of NDVI (green areas) that were observed in the images correspond to parks, green spaces, vegetated areas, crops, farmlands and forests (Figure 6).

Figure 6:Normalized Difference Vegetation Index Map of Ibadan for 6a) 1984, 6b) 2000 and 6c) 2018.
Table 5. Distribution of NDVI from Landsat image for 1984, 2000, and 2018.
| 1984 | 2000 | 2018 | |
|---|---|---|---|
| Maximum NDBI | 0.61165 | 0.645161 | 0.710491 |
| Minimum NDBI | -0.969697 | -0.0866142 | -0.282676 |
Relationship between LST and NDVI
Figure 7 shows that a very strong negative correlation exists between LST and NDVI. In other words, LST and NDVI are inversely proportional to each other. This implies that the increase in the vegetation cover of a particular geographical location such as this study area can effectively reduce the Land Surface Temperature [25]. This measure can be employed in several growing cities and urbanized settlements to mitigate effects such as high temperatures, urban heat islands, etc.

Figure 7:Relationship between LST and NDVI
The correlation coefficients between the LST and the NDVI for the years of study in this research are outlined in Table 6 below.
Table 6. Correlation Coefficient values for the years under consideration (NDVI)
| Years | Coefficient of determinant (R2) | Coefficient of correlation (R) |
|---|---|---|
| 1984 | -0.7495 | -0.8657 |
| 2000 | -0.5034 | -0.7095 |
| 2018 | -0.822 | -0.9066 |
Projections of future Land Surface Temperature (LST)
The validated results of the stepwise regression modelled per pixel LST are presented in Table 7 below. The estimated LST has a strong correlation with the per-pixel retrieved LST with a high parameter of estimation, (r2 =0.82). It was also seen that the overall error between both LST media in the Ibadan metropolis was low with a standard deviation of 3.95°C, a bias of 3.28°C and a root mean square error of 3.31°C, as shown in Table 8 below [26,27].
Table 7. Table showing a comparison of the regression model and retrieved mean LST pixel values.
| Error Metrics | Values |
|---|---|
| Coefficient of determinant (R2) | 0.822 |
| Standard Deviation | 3.95 |
| Bias | 3.28 |
| Root Mean Square Error (RMSE) | 3.31 |
It is to be noted that the validations of results in this research work conform to that of previous research and studies such as Ishola et al.,2017 which reported similar results in another southwestern and tropical city of Nigeria [27]. Furthermore, the accuracy and the precision of the results depict the ability of the developed stepwise regression model in predicting future thermal responses that are a result of land use and land cover changes over time with a very high level of accuracy and confidence.
The projected LST maps for 2028, 2038 and 2048 shown in Figure 8. The simulations showed that the temperature values will range between 24.65°C–39.40°C in 2028, 25.31°C-42.52°C in 2038 and 25.89°C– 44.21°C in 2048 as shown in Table 5 below. The results from the hybrid projections of the LST in the core of the city depict that there were little pronounced changes in the temperatures of these core areas whereas the changes were much more pronounced in the rural and suburban parts of the city which comprises the northern and south- western parts of the city. These parts of the city have been earlier projected to experience rapid urbanization/ urban sprawl.

Figure 8: Projected Map of Land Surface Temperature of Ibadan for 8a) 2028, 8b) 2038 and 8c) 2048 [36].
Moreso from the analyses and the maps for the projected LST, it can be seen that the LST values increased considerably from low (32.03°C) to medium (33.92°C) and high temperature (35.05°C) in 2028, 2038 and 2048 respectively. These increases are attributed to the continuous alterations and modifications in the natural features of the study area, and also to the continued urban sprawl as depicted by the simulated LULC analyses for 2028, 2038 and 2048 [28-31].
The projections showed that the urbanized areas and city centres all retain their high-temperature values with these high-temperature scenarios also observed in areas surrounding the city centres such as the surrounding suburban areas as seen in the simulation for 2048. It can also be seen that there is an unabated increase in the areas exhibiting high temperatures.
Furthermore, in Figure 8 it can be seen from the simulated maps that the areas with vegetation retained their thermal properties (low temperatures) in future years. It was also observed that there were transitions from medium to high temperatures over the suburban areas in the metropolis [32-35]. As a result of this, these areas may experience worrying impacts associated with increases in temperature in 2048 if several palliative measures, urban redesign and planning measures are not put in place to alleviate such effects (Table 8).
Table 8. Table showing the distribution of LST for Ibadan Metropolis for the years 2028, 2038, and 2048.
| Years | 2028 | 2038 | 2048 |
|---|---|---|---|
| Minimum LST | 24.65°C | 25.31°C | 25.89°C |
| Maximum LST | 39.4°C | 42.52°C | 44.21°C |
This study has carefully studied previous and future changes in Land Surface Temperature, (LST) concerning changes in land use and cover in the Ibadan metropolis, Oyo state, Nigeria, using hybridized techniques and stepwise approaches.
The observed changes in LST related to observed changes in Land use and land cover were investigated using Landsat thermal IR and reflective data over the Ibadan metropolis. The results obtained show that the observed changes and alteration of natural surfaces have notable longterm effects on the temperature responses of the metropolis which can be used as a meteorological focal point for future references and research when considering changes in land use on a national and continental basis for climate dynamics.
The unabated and uncontrolled increases in built-up areas and the continued and renewed removal of vegetation and green surfaces in the metropolis are seriously alarming and call for concern from the relevant authorities in the area. This is because the future effects of these actions on the LST will have devastating effects on the local climate of the area in conjunction with renewed increases in greenhouse gas concentration due to the removal of green surfaces that acts as carbon sinks. This means that urban designers and planners in the metropolis will have to improve upon their designs and landscaping in future urban developments, encouraging more urban greening, green structures, green parks and houses with green roofs to compensate for the already altered vegetation cover thereby reducing the effects of heat islands and global warming that may want to arise in the area.
The hybridized techniques and stepwise approaches utilized in this study have shown that the simulated LST in the present-day urban areas and city centres may not experience notable changes or increases in their temperatures in the future years. Noticeable and marked changes will however be observed in the rural and suburban areas where urban expansion is inevitable. The LST values for the rural and suburban areas will increase from low to medium and to high values in the future years in consideration due to unabated changes in land cover, artificial removal and alteration of natural surfaces all associated with uncontrolled urban expansion. Research has also shown that the changes observed in LST as shown by this study, are in line and consistent with previous studies, indicating that the simulated changes are valid because they have clearly defined remote sensing techniques in the pieces of literature. Furthermore, the results from the model and this study can serve as useful tools for urban planners and policymakers. Urbanization has been known to be a major driver in changes associated with land use and land cover as well as land surface temperature. In light of these developments, laws, and policies that will stand the test of time, palliative measures to reduce urban sprawl and mitigate the urban heat island effects in the metropolis should be put in place.
The authors thank the United States Geological Survey (USGS) for free access to the Landsat datasets used in this research, as well as the developers of the CA_Markov algorithms that were used in computations. The comments and observations of the anonymous reviewers to improve the quality of this paper are appreciated.
Compliance with ethical standards
On behalf of all authors, the corresponding author states that there is no conflict of interest.
[CrossRef]
Citation: Olayiwola, H.O., et al. Monitoring Future Land Surface Temperatures using CA-Markov A Case Study of Ibadan, Nigeria, J Climatol Weather Forecast, 2022, 10(12), 001-07.
Received: 05-Dec-2022, Manuscript No. JCWF-22-19711 (PQ); Editor assigned: 15-Dec-2022, Pre QC No. JCWF-22-19711 (PQ); Reviewed: 19-Dec-2022, QC No. JCWF-22-19711 (Q); Revised: 22-Dec-2022, Manuscript No. JCWF-22-19711 (R); Published: 28-Dec-2022, DOI: 10.35248/2332-2594.22.10(12).378
Copyright: © Olayiwola, H.O, et al. This is an open-access article distributed under the terms of the Creative Commons Attribution License, which permits unrestricted use, distribution, and reproduction in any medium, provided the original author and source are credited.
