Research Article - (2025) Volume 13, Issue 1
This research assesses the accuracy of gridded precipitation datasets in Plateau, Jos, Nigeria, and examines their relationship with in situ ground data. Four datasets-PERSIANN-CD, SM2Rain ASCAT, TAMSAT and MERRA 2-are compared with ground data from Nigeria Meteorological Station (NIMET) and the Geography Department, University of Jos. The study area, characterized by a single-maxima rainfall pattern, experiences a pronounced dry season from November to January and a rainy season from March to November.
The research findings reveal that all datasets have the capability to detect precipitation events. However, the TAMSAT dataset demonstrates the closest relationship with in situ data and exhibits the lowest bias and root mean square error. Nonetheless, weak correlations between gridded and ground data suggest that factors such as measurement methods, spatial and temporal resolutions and elevation differences may influence results. Notably, SM2Rain ASCAT shows the highest probability of detection and critical success index.
Furthermore, the research identifies a negative relationship between the resolutions of gridded datasets, the critical success index and probability of detection. This implies that coarser gridded datasets tend to increase the probability of detection and critical success index.
In conclusion, the research highlights the importance of considering various factors when selecting precipitation datasets for specific applications and regions.
Remote sensing • Gridded precipitation datasets • Rainfall detection accuracy
Rainfall stands as a pivotal climatic element, playing a crucial role in agricultural irrigation, sustaining fauna and flora and contributing to environmental cleansing [1]. In Nigeria, a significant number of farmers heavily rely on rainwater for their crops, while others turn to surface waters influenced by rainfall. The dependence on rain becomes particularly pronounced during the worst drought seasons [2]. As climate change exerts its influence, with both anthropogenic and natural forces at play, it becomes imperative to monitor and gauge rainfall. Unfortunately, in Nigeria, the availability of in situ climatic data is limited, primarily situated in airports and specific organizations, often failing to cover the entire land area adequately. Moreover, hilly regions receive little attention in terms of in situ climatic gardens. Harnessing the advancements in Geographic Information System (GIS) technology, this research seeks to compare various climatic datasets from different sources, focusing specifically on hilly areas in Nigeria.
A range of studies have compared gridded precipitation datasets with in situ data, highlighting both similarities and differences. Contractor found that while all datasets had similar climatologies, there were distinct structural uncertainties between those gridding in situ observations and those deriving estimates from satellite measurements [3]. Mimeau further emphasized the impact of precipitation uncertainty on glaciohydrological modeling, with large differences in annual amounts and seasonal cycles between datasets [4]. Hobeichi proposed a methodology for evaluating precipitation datasets using surface water and energy budget closure, identifying GPCC, GPCP and REGEN as the best performers in different regions [5]. Hamm also noted differences in precipitation variability and amount between gridded products, suggesting careful selection based on research application and specific question [6].
Aim and objectives
The aim of the research is to evaluate multiscale gridded datasets in Jos, Plateau State, Nigeria. The following are the
Objectives:
• Assess gridded precipitation datasets in Plateau, Jos between 1998 and 2021.
• Evaluate the relationships of Gridded dataset PERSIANN-CD, SM2Rain ASCAT, TAMSAT, and MERRA 2, UNIJOS with in situ Nigeria Metrological station (NIMET) datasets in Plateau, Jos.
• Compare the probability of detection and critical successes of gridded datasets with spatial resolutions.
Study area
Plateau Jos is lies latitude 9.8965° N, and longitude 8.8583° E of Nigeria. It is in the North Central Nigeria. The state is bordered in the North West by Kaduna state, in the North East by Bauchi state, in the South West by Nasarawa state and in the South East by Taraba state. There are sixteen local governments in Plateau state, Nigeria; which are Bassa, Jos North, Jos East, Jos South, Riyom, Barkin Ladi, Bokkos, Mangu, Kanke, Kanam, Panshin, Qua’ Anpa, Shendam, Langtang North, Langtang South, Mikang and Wase. The state has a landmass of 30,913 square kilometers.
The elevation of Plateau, Jos is 1,220 m. Although, it is found in the savanna vegetation belt and tropical continental climate zone, Jos Plateau exhibits unique climatic conditions because of its elevation above the sea level compared to the surrounding states. Jos enjoys average annual rainfall of about 1400 mm, mean daily maximum and minimum temperature of 27.9°C and 15.8°C.
The study area exhibits diverse climatic and ecological zones. The southern part thrives in a tropical rainforest, experiencing abundant rainfall exceeding 2000 mm annually. In contrast, the northern region features a tropical continental climate, characterized by limited rainfall below 1000 m and an extended dry season. The climatic and the soil (pedology) characteristics pave the ability of the location to thrive for cultivation of yams, sorghum, corn (maize), potatoes, cowpeas, rice, fruits and vegetables are the staple crops. About 70% of people living in Jos are engaged in agriculture and they produce enough food and cash crops for domestic consumption and as inputs for agro-allied industries (Figure 1) [7].

Figure 1. Plateau state, Nigeria.
Data for this study exclusively comprise secondary sources, focusing on evaluating gridded precipitation datasets in Plateau, Jos Nigeria. The research data were collected and precipitation datasets were compared from PERSIANN-CD, SM2Rain ASCAT, TAMSAT and MERRA 2 with ground (in situ) precipitation data from Nigeria metrological station at Plateau and in situ data from department of geography, University of Jos Metrological Station (Tables 1 and 2).
| Name | Meaning | Source | Link |
| MERRA 2 | NASA prediction of worldwide energy resource (Power) | NASA | https://power.larc.nasa.gov/data-access-viewer/ |
| SM2RAIN-ASCA | Soil moisture to rain advanced scatterometer | Zenodo | https://zenodo.org/records/6459152 |
| PERSIANN-CDR | Precipitation estimation from remotely sensed information using artificial neutral networks | Center for hydrometeorology and remote sensing | https://chrsdata.eng.uci.edu |
| TAMSAT | Tropical applications of meteorology using satellite data and ground-based | Tamsat group | https://www.tamsat.org.uk/data-subset/data |
Table 1. Downloaded gridded precipitation datasets.
| Indices | Specifics | Description | Value |
|
|
|
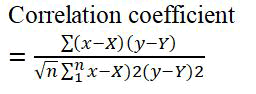
A measure of the strength and direction of the linear relationship between two variables | ± 1 |
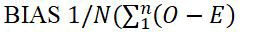 |
E=Estimates of GPDS | Measure of overestimation or under estimation | 0 |
| O=Weather estimations | |||
| n=Total number of GPDS | |||
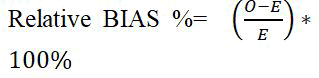 |
rBIAS=Relative bias | The rBIAS provides a measure of the magnitude and direction of the bias | ± 100 |
| O=Estimations of GPDS | |||
| E=In situ weather data | |||
| n=Total number of GPDS | |||
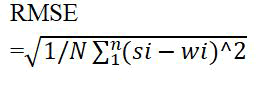 |
RMSE=Root Mean Square Error | The RMSE provides a measure of the magnitude of the error | 0 |
| si=Estimations of GPDS | |||
| wi=In situ weather data | |||
| n=Total number of GPDS | |||
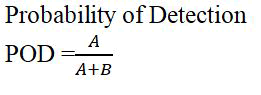 |
POD=Probability of Detection | The POD provides a measure of the ability of the precipitation datasets to detect precipitation events | 1 |
| A=Amount of precipitation that was recorded by the GPDS | |||
| B=Amount of precipitation that was recorded by the reference gauging stations but not by GPDS | |||
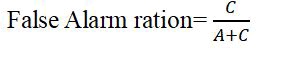 |
FAR=False Alarm Ratio | The FAR provides a measure of the ability of the precipitation datasets to avoid issuing false alarms | 0 |
| C=Amount of precipitation that was underreported by the GPDS | |||
| A=Amount of precipitation that was recorded by the GPDS | |||
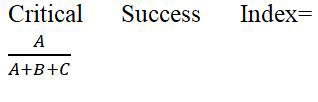 |
CSI=Critical Success Index | The CSI provides a measure of the accuracy and reliability of the precipitation datasets | 1 |
| A=Amount of precipitation that was recorded by the GPDS | |||
| B=Amount of precipitation that was recorded by the reference gauging stations but not by GPDS | |||
| C=Amount of precipitation that were underreported by the GPDS |
Table 2. Principal characteristics of all evaluation and categorical indices.
Assessment of gridded precipitation datasets and in situ ground data at Jos, Plateau state Nigeria
The average rainfall for annual rainfall in Jos, Plateau gridded precipitation datasets for PERSIAN CDR, MERRA 2, TAMSAT and SM2rain ASCAT are 1141.7 mm, 1198.5 mm, 1294.6 mm and 1532.9 mm respectively, the average in situ ground data for UNIJOS and NIMET are 1299.24 mm and 1265.54 mm respectively.
All the datasets shows that there is little or no recorded precipitation in November to February, which marked a dry season but there is abundant precipitation recorded from March until it reaches its peak at August and then descends to low or little precipitation in November. This pattern shows single-maxima rainfall. The abundant precipitation from March starts the planting seasons for crops and the farmers performs rain-fed agricultural practices from March to November (Figure 2).

Figure 2. Average monthly temporal change of gridded precipitation datasets in Plateau state (1998-2021).
Relationship between gridded precipitation datasets and in situ ground data
The correlation coefficients show the relation between and within the datasets. There is a very weak negative relationship between the precipitation data obtained from NIMET and University of Jos. The is also a positive correlation between NIMET data and TAMSAT data, there is also a weak correlation between the NIMET and PERSIAN CDR as well as SM2RAIN ASCAT, also there is extremely low positive relationship between NIMET data and MERRA 2 datasets. In all the TAMSAT ranked the highest with 0.43 in terms term of its relationship with the ground in situ data while the SM2rain ASCAT ranked next to TAMSAT with 0.39 and PERSIAN CDR was ranked next to the SM2rain, with relationship coefficient of 0.33.
Although, the correlation coefficient does not imply causation but it could be used to measure relationships between the data sets. While the TAMSAT seems most related, there is observed weakness in the level of relationships within the gridded datasets and the in situ ground data. There may be factors responsible for the weak relationships within the in situ data and remotely sensed gridded datasets, which may include differences in measurement methods, used by in situ and remotely sensed data acquisition, accuracy, and calibration, over generalization of prediction algorithms, localized weather phenomena, difference in spatial and temporal resolutions, elevation and topology, etc (Table 3).
| NIMET | UNIJOS | TAMSAT | PERSIAN CDR | MERRA 2 | sm2rain | |
| NIMET | 1 | |||||
| UNIJOS | -0.13174 | 1 | ||||
| TAMSAT | 0.434881 | 0.157394 | 1 | |||
| PERSIAN CDR | 0.333723 | -0.0087 | 0.614759 | 1 | ||
| MERRA 2 | 0.115652 | -0.16987 | -0.02623 | 0.247615 | 1 | |
| sm2rain | 0.387587 | -0.02853 | 0.618601 | 0.723734 | 0.444845 | 1 |
Table 3. Correlation coefficient of the relationships between gridded datasets and in situ data.
The monthly performance diagram of all GPDS
Earlier research made use of this performance diagram to compare the efficacy of various precipitation products in a range of environmental settings. Probability of Detection (POD) estimates for the UNIJOS, TAMSAT, PERSIAN CDR, MERRA 2 and SM2Rain-ASCAT were 0.51, 0.53, 0.53, 0.39 and 0.55 respectively. All probability result indicates that the products have the potential to detect the occurrence of precipitation in the study area, except for MERRA 2 reanalysis datasets (Table 4).
| UNIJOS | TAMSAT | PERSIAN CDR | MERRA 2 | sm2rain | |
| Probability of Detection (POD) | 0.51 | 0.53 | 0.51 | 0.39 | 0.55 |
| Critical Success Index (CSI) | 0.52 | 0.51 | 0.57 | 0.34 | 0.62 |
Table 4. Table showing probability of detection and critical success index.
The SM2rain ASCAT has the highest critical success index while the MERRA reanalysis data has the lowest probability of prediction and the lowest critical success index (Figure 3).

Figure 3. Measurement bias of the datasets.
The accuracy of the gridded precipitations datasets was tested with bias indicator. The result shows that TAMSAT the lowest bias while there is more bias with SM2rain ASCAT and PERSIAN CDR datasets. However, MERRA 2 shows a strong negative bias in estimating the ground data.
The root means square error of TAMSAT, PERSIAN CDR, MERRA and SM2RAIN are 116.38, 219.78, 536.38 and 339.41 respectively. The TAMSAT has the lowest value of followed by PERSIAN and SM2RAIN, while the MERRA 2, has the highest value of room mean square error.
Relationship between Probability of Detection (POD), Critical Success Index (CSI), and spatial resolutions of gridded datasets
The correlation coefficient between Probability of Detection (POD) and Critical Success Index (CSI) is approximately 0.949. This indicates a strong positive correlation between these two variables, suggesting that as the Probability of Detection (POD) increases, the Critical Success Index (CSI) also tends to increase and vice versa (Table 5).
|
|
POD | Success index | Resolution |
| POD | 1 | ||
| Success index | 0.949212 | 1 | |
| Resolution | -0.82142 | -0.63073 | 1 |
Table 5. Correlation matrix between probability of detection, critical success index and gridded dataset’s resolutions.
The correlation between POD and resolution is approximately -0.821, indicating a strong negative correlation. This suggests that as the resolution of the dataset becomes coarser (grid size increases), the probability of detection tends to increase. In other words, using coarser resolution data (larger grid cells) might enhance the detection of events. This could be because coarser resolution data smooth out finer-scale variability, reducing noise and highlighting larger-scale patterns that are easier to detect.
The correlation between CSI and resolution is approximately -0.631, indicating a moderate negative correlation. This suggests that as the resolution of the dataset becomes coarser, the critical success index tends to decrease. Coarser resolution data may aggregate events over larger grid cells, potentially losing important details and reducing overall accuracy. Therefore, while coarser resolution data might improve the detection probability (POD), it might simultaneously lead to a lower success rate (CSI) due to the loss of spatial detail and precision.
In this work, I evaluated the accuracy and error characteristics of the remotely sensed gridded precipitation datasets. Two ground data were used to test the accuracy; a precipitation data from weather station at the geography department, University of Jos, and data from the Nigeria metrological station at Jos, Plateau. The datasets obtained were PERSIANN-CD, SM2Rain ASCAT, TAMSAT and MERRA 2.
The trend of precipitation is a single-maxima rainfall with a marked dry season between November and January and rainy season starting at March till November.
All the datasets possess the ability to detect precipitation, with marked degree of accuracy but the TAMSAT related the with the insitu data and has the lowest bias. It also has the lowest BIAS and lowest RMSE. However, all the precipitated datasets showed a weak relationship with the ground data. The reasons could be because of differences in measurement methods, used by in situ and remotely sensed data acquisition, accuracy and calibration, over generalization of prediction algorithms, localized weather phenomena, difference in spatial and temporal resolutions, elevation and topology, etc. Also, the SM2rain showed the highest probability of detection and highest critical success index rate.
This study found that the performance of the GPDS varied depending on the metric used and the elevation zone. For example, TAMSAT exhibited the best performance overall, with the highest average Correlation coefficient values and the lowest RMSE values and lowest BIAS. While the gridded datasets prove to be useful reference data for weather elements, with some degree of potentials and accuracy, it is necessary to always use the ground data to complement the gridded datasets in Nigeria. The gridded datasets are highly accessible and available for use at a low cost for just downloading; however, the ground data are not readily available at the comfort of researchers. It is therefore necessary for the Nigeria metrological stations in Nigeria to make the ground data available and accessible over the internet researchers and users like the other remotely sensed gridded datasets for freely release. This will encourage researches and help the end users in making decision.
Received: 07-Jul-2024, Manuscript No. JCWF-24-32701; Editor assigned: 10-Jul-2024, Pre QC No. JCWF-24-32701 (PQ); Reviewed: 24-Jul-2024, QC No. JCWF-24-32701; Revised: 19-Jan-2025, Manuscript No. JCWF-24-32701 (R); Published: 26-Jan-2025, DOI: 10.35248/2332-2594.25.13(1)001-005
Copyright: © 2025 David BO. This is an open-access article distributed under the terms of the Creative Commons Attribution License, which permits unrestricted use, distribution, and reproduction in any medium, provided the original author and source are credited.