Research Article - (2018) Volume 6, Issue 2
In this study, we investigated the ability of Weather Research and Forecasting model coupled with the Chemistry option (WRF-Chem) using the GOCART dust scheme in capturing the spatial and temporal distribution of a severe dust storm which occurred in March 2006 over West Africa. The period (5th - 14th March, 2006) also coincided with the African Monsoon Multidisciplinary Analysis (AMMA) Special Observing Period (SOP) and some observed datasets from other platforms were also used. The WRF-Chem simulation was performed on a two-way nested domain in order to resolve the dust episode on high horizontal resolution dataset. From the 5th March, a dust storm raised in northern Algeria, which propagated southward spreading to the west and east on the subsequent days. Over the Gulf of Guinea, an intense dust haze was transported southward thereby generating an aerosol optical thickness (AOT) greater than 4 over Nigeria. Qualitative and quantitative characterizations between observations and WRF-Chem simulations demonstrated that the WRF-Chem model is highly efficient and can be recommended to simulate the spatial and temporal distribution of harmattan dust over West Africa. We discovered that the WRFChem modelled Aerosol Optical Depth (AOD) underestimated the AOD from AERONET as a result of all other aerosols like black carbon integrated into the observed which is not yet captured by model. The quantitative and qualitative analysis of the model output ascertain the capability of WRF-Chem to reasonably reproduce West African harmattan dust haze from the time and location of being raised to its transportation and propagation and hence its final settling or disappearance over the continental area of West Africa. Model simulation was able to partition the dust particles into five different sizes. It was discovered that dust particles of sizes 1.4 μm, 2.4 μm and 4.5 μm are more prevalent among other sizes from the raised and transported dust over West Africa.
Keywords: WRF-Chem; Harmattan dust; Size bin; Simulation; Sensitivity; Comparison
Dust is the suspension of solid particles in a gas, or a deposit of such particles [1]. There are several types of atmospheric dust: cosmic dust, volcanic dust, dust from industrial emissions, and dust which originates from sediments and soils (mineral dust). Throughout this study, dust refers to the mineral dust type. Dust particle usually range in the size from 1 to 100 μm in diameter, and settles slowly under the influence of gravity. Air borne dust can become a major threat to human health [2], by creating conditions which support the spread of epidemics such as meningitis in the Sahel [3] when increases in dust concentrations exceeds regional air quality limits [4,5]. Dust aerosol also has an impact on the local climate and environment by influencing the atmospheric radiation balance and decreasing atmospheric visibility [6,7]. It is a major ingredient in the cloud formation process without which cloud formation would be very difficult [8,9]. It also affects the economy of the region as a result of the impact on air transportation due to reduction in horizontal visibility. According to Daily Trust 2015, about 130 domestic flights were cancelled and 185 others delayed within two days across Nigeria due to poor visibility over observed over the entire country [10].
North Africa is the world’s largest and most important dust source area [11,12]; providing an estimated 50% of the global annual total dust [13,14]. To broaden our knowledge of the effects of mineral dust on the climate system, an adequate description of the meteorological processes controlling dust emission and transport from source areas is a key requirement [15]. In North and West Africa, the annual cycle of dry and rainy seasons resulting from the north-south migration of the Intertropical Discontinuity (ITD) is the main seasonal climatic feature. Several wind systems transport aeolian dust over the Sahelian and Saharan Africa [13,16]. One of the most prominent wind systems is the Harmattan, a ground level stream of dry desert air which is part of the African continental trade wind system that sweeps far southward from a consistent North Easterly (NE) direction during the boreal winter [17]. The ITD lies at the interface between the low-level moist southwesterly monsoon flow and the dry northeasterly “Harmattan” flow [18,19].
Dayan established that African dust intrusions persist longer (with duration of 2-4 days) and transport takes place in deeper atmospheric layers (surface up to and above 3 km of altitude) than its eastern Mediterranean counterpart [20]. Despite the importance of the African continent as a worldwide major dust source, the quantification of dust emissions is still an open question and strongly resides to numerical modeling [21]. However, modelling dust uptake is a delicate issue, subject to a variety of uncertainties associated with the model’s capacity to realistically reproduce the near surface meteorological conditions, the applied dust emission parameterisation, the model’s vertical and horizontal resolutions, as well as the surface-related input datasets, such as erodible areas [22-24]. Accurate simulation of Saharan dust has to take all these into consideration. Therefore, for better understanding of the effects of mineral dust on the environment and climate, numerous dust models have been developed and evaluated to comprehend a series of dust‐related processes such as emission, transportation and deposition [6,25-29]. Models used in those studies were found to simulate dust phenomena over their respective study areas reasonably well. Meanwhile, due to different dust parameterisations used and the various numerical and meteorological conditions considered, the amounts of dust emission, as estimated by these models, are very different from observed [30]. Recent studies that compared models’ performance with observation have been able to show that there were visible differences between the observed and the simulated dust emissions from these models [30,31]. A correct forecast of dust uptake and transport requires among other things; input fields of initial and boundary data, adequate parameterisations, and tuning technique [32-34]. This study therefore, takes into consideration these four requirements to evaluate the performance of the Weather Research and Forecasting (WRF) model with its chemistry option (WRF-Chem) version 3.8.1 [35] to detect dust entrainment and its transport through the comparison of modelled and observed atmospheric data over West Africa in general and also Nigeria in particular. This study therefore aims to evaluate the sensitivity of WRF-Chem model in simulating the raising of dust, its concentration and transport from the source region to Nigeria.
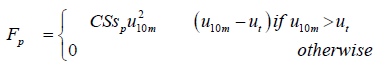
The Weather Research and Forecasting (WRF) model is a nextgeneration mesoscale weather model designed purposely for data assimilation and operational forecasting in order to advance both the understanding and prediction of weather. WRF is applied in a variety of research and operational contexts, from storm scale to regional climate scale [36]. WRF-Chem incorporates a chemistry module that simultaneously simulates the emission, turbulent mixing, transport and chemical transformation, of trace gases and aerosols [35]. In this study, WRF-Chem implements the Goddard Global Ozone Chemistry Aerosol Radiation and Transport (GOCART) dust scheme, this includes emission, advection, and deposition and is fully described in Ginoux [26]. The GOCART dust scheme simulates dust emission as a function of wind speed, erodibility and wetness of the surface. Emission flux Fp for aerosol particle size group p is expressed as:
 (1)
(1)
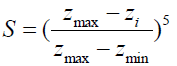
where C is a dimensional, scheme-specific constant of proportionality equal to 1 mgs2m−5; S is the erodibility source function, both values originally prescribed [26]; sp is the fraction of each size class within the soil, u10m is the wind speed at 10 m; and ut is the threshold velocity of wind erosion, determined by particle size and surface wetness. Due to the uncertainties in the available soil texture data, a simple particle size distribution following Tegen and Fung was implemented [25]. The fraction of clay is based on the assumption that erodible clay represents 1/10 of the total mass of emitted silt and that of each silt subclass is assumed to be the same. The sp values are thus 0.1 for the class 0.1-1 mm and 0.3 for the classes 1-1.8 mm, 1.8-3 mm, and 3-6 mm, respectively. The source function S is defined from an erodibility map representing the fractional grid cell area of alluvium available for wind erosion as follows:
 (2)
(2)
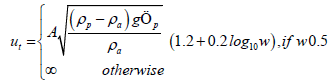
Where S is the probability of accumulated sediments in the ith grid cell of altitude zi while zmax and zmin are the maximum and minimum elevations in the surrounding 10 × 10 topography, respectively. Only land surface with bare soil is considered as possible dust sources. The threshold wind velocity ut is estimated as:
 (3)
(3)
where A = 6.5 is a dimensionless parameter; w is the surface wetness (0.001–1); Φp is the particle diameter; g is the acceleration due to gravity; and ρa and ρp are the air and particle densities respectively. More information about estimation of S and utcan be obtained from Ginoux [26]. One important difference exists in how erodible area was used in the parameterisations. The dust emission scheme used erodible area as scaling factor to reduce dust emissions, i.e. the calculated dust emission flux at a particular grid point is multiplied by the erodible area at the same grid point.
The Advanced Research core of the Weather and Research Forecasting (WRF) with Chemistry option (WRF-Chem) version 3.8.1 was used. To evaluate the sensitivity of WRF-Chem in simulating dust, simulations were performed over one-way nested domains. The domains have model grid sizes of 30km (EXP30), and 10km (EXP10). The simulation period is from 5th to 14th March 2006 and has 38 vertical levels. The two model domains as shown in Figure 1 encompass 1.32°S-38.58°N, 19.79°W-20.29°E and 5.83°N-31.92°N, 4.64°W-26.96°E for the 30 km and 10km grid resolutions respectively. The period (March 2006) considered in this study was among Special Observing Period (SOP) of the African Multidisciplinary Monsoon Analysis (AMMA) project devoted to the improvement in the current understanding of the desert dust particle atmospheric processes, especially in terms of their emission and transport from their source areas to their redistribution and sedimentation [37]. It was also regarded as a typical example of a winter monsoon seasonal mineral dust event [38,39]. The initial boundary conditions are generated from National Centre for Environmental Prediction (NCEP) Final Analysis (FNL) 1° × 1° resolution at every 6 hours. The FNL datasets used the Global Data Assimilation System (GDAS) for providing the initial data. The GDAS persistently collects the observation based datasets worldwide through the GTS7 and other resources [40]. The chemistry component of the WRF model was used in dust-only mode and Goddard Global Ozone Chemistry Aerosol Radiation and Transport (GOCART) as described by Ginoux was used as dust scheme and thus able to capture dust particle size ranges from 0.1 to 10.0 μm representing the five different dust size bins (0.5μm, 1.4μm, 2.4 μm, 4.5 μm, and 8.0 μm particle radii) [26]. It is noteworthy, that this model set up only took into consideration dust uptakes from the soil as the only source of particulate matter and transports it as a passive tracer within the simulation domain, treating explicitly gravitational settling, and vertical mixing.

Figure 1: The study area with model domain for 30km horizontal grid (EXP30) and for 10km horizontal grid (EXP10 in small white square).
The micro physics scheme was represented by the WRF single moment 5 microphysics scheme [41] for EXP30 and Lin [42] scheme for EXP10, and the cumulus scheme was parameterized according to the Kain-Fritsch convective scheme [43]. The short- and longwave radiative processes in the atmosphere were represented by the Rapid Radiative Transfer Model (RRTM) [44]. For surface processes, the model setup used the Unified Noah Land Surface model. The vertical subgrid-scale fluxes due to eddy transport in the planetary boundary layer (PBL) and the free troposphere were parameterized according to the Yonsei University (YSU) boundary layer scheme [45].
A comprehensive set of satellite datasets providing information on atmospheric dust aerosols was used. This consists of: (i) European Meteorological Satellite (EUMETSAT) dust product color-composite from the Spinning Enhanced Visible and Infrared Imager (MSGSEVIRI) sensor which as a qualitative dataset has been proven useful to identify active dust sources. The MSG‐SEVIRI is located geostationary at 0°W over the equator and provides images of Africa on a 15 min temporal resolution [37]; (ii) Aerosol Optical Thickness (AOT) from MODIS-Aqua collection 6 Level 2 (10 km spatial resolution, daily at local noon) using the latest version of the Deep Blue algorithm [46], providing AOT even over highly reflective desert surfaces; (iii) Aerosol Index (AI) of Total Ozone Mapping Spectrometer (TOMS) satellite data provides a global view of dust distribution. The TOMS is considered as the pioneer for qualitative detection of aerosols from space, due to its capacity for detecting the ultraviolet (UV) at 340, 360 and 380 μm [47]. Retrievals from TOMS in the form of AI have been used to track global transport of smoke and dust in extended areas [11,48]. The Ozone Mapping Instrument (OMI), launched in 2004, continues the TOMS record for total ozone and other atmospheric parameters related to ozone chemistry and atmospheric aerosols [49]. AI values indicate the intensity of dust content, not total dust flux; and (iv) a source for dust measurement is the Aerosol Robotic Network (AERONET), an optical ground-based aerosol-monitoring network and data archive. The organization of this network consists of identical automatic sunsky scanning spectral photometers owned by national agencies and universities. This allows frequent measurements of atmospheric aerosol optical properties and perceptible water at remote sites, providing globally distributed near-real time data [50,51]. So far the AERONET network constitutes the most complete ground based global data for dust analysis. Retrievals from optical parameters are suitably integrated with satellite data for validation purposes. The number of stations is limited in West Africa (Djougou, Ilorin, Agoufou, and Banizoumbou), particularly in locations known to be key dust sources in the Sahara and Sahel. Nevertheless, important long-term data have been obtained in recent years and have been quite helpful for comparative, validation and climatic purposes. The visibility data over two climatic stations were also sourced from the archive of Nigerian Meteorological Agency (NIMET).
Description of synoptic situation of March 2006 West Africa dust storm
Slingo studied a dust event and reported that the dust storm was initiated on the 5th of March 2006 by a cold front in the leeward side of the Atlas Mountain [52]. The system propagated southwards as a density current which appeared to be close to the surface, following the lowest terrain and moving around the highest topography such as Tibesti Mountain or being channelled through mountain passes (in Hogar and Air massifs). The dust reached Niamey on the 7th and got to Nigeria, Dakar, and Senegal on the 8th of March. The dust then poured off West Africa and over the Atlantic for the next 5 days. Thomas and Gautier and Tulet et al. reported extensively that the 7-13 March 2006 West African dust storm event was characterized by an intense Harmattan wind at the surface which was generated by a strong pressure gradient over West Africa, especially from 7 to 9 March [53,54]. The 850 hPa geopotential field from 8 March at 1200 UTC from the ECMWF operational analysis shows a maximum of 1600 m over Mauritania whereas a deep low was located over Libya which had a minimum height of 1400 m [54]. This strong geopotential gradient led to an intense surface Harmattan flux over northern Niger (14 m/s), northern Mali (11 m/s) and Mauritania (12 m/s). The Inter tropical Discontinuity (ITD), which delineates the dynamic boundary between the Harmattan flux and the monsoon was observed at the surface along a line extending from the northern Ivory Coast to central Nigeria Over the Sahel, during 7-13 March period, the high surface winds led to a strong dust storm which was readily observed from MSG-SEVIRI satellite images [54,55]. Figure 2 shows that at 1200 UTC, 8th of March, a dust plume was observed spreading from the desert regions of Mali, Niger and Chad to the southwestern part of the domain.

Figure 2: MSG-SEVIRI satellite images over West Africa for 8 March 2006 at 1200. The images are from the Environmental System Science Centre. Reference colors are computed as a difference of wavelengths using EUMETSAT algorithm: pink denotes dust, while red denotes thick high-level cloud, and brown and green denote mid-level clouds. Light blue indicates warm desert surfaces, while light purple indicates other warm land surfaces (Tulet et al. 2008).
Ground based observation of the dust episode
In order to ascertain that the Harmattan dust was indeed observed in Northern Nigeria, there is need to show the visibility trend during the dust episode for some Northern Nigerian meteorological stations such as Kano and Maiduguri. Figure 3(A) and (B) show the horizontal visibility (m) at 0900z over Kano and Maiduguri respectively from 4th- 16th of March, 2006. Over Kano (Figure 3A), visibility dropped from 10,000m on the 4th to 2000m on the 5th of March and later cleared up to 8000m, on the 7th while on the 8th of March, 2006, visibility dropped to as low as 500m and continued to be less than 800m up till the 10th of March, 2006 with a value of 300m. The decrease in visibility on the 8th-10th of March 2006, was believed to be due to the incursion of the Harmattan dust from the source region to Northern Nigeria, as it was recorded in the daily register of the station that there was an incursion of dust storm. Similarly, Figure 3(B) over Maiduguri, depicts horizontal visibility dropping from 10,000 m to as low as 500m on the 8th and persisted until the 11th with value of 800m before it increased to 10,000 m on the 12th. The Harmattan dust lasted longer over Maiduguri from 8th to 11th compared to its period over Kano which is from 8th to 10th, this could be due to the fact that Maiduguri is closer to the dust source region in Chad than Kano. This clearly confirmed that a dust episode was observed and recorded in the meteorological stations over the Northern Nigeria. The daily register and synoptic charts of NIMET were also checked to actually get the reason for visibility reduction and the cause was ascertained to be due to dust and dust storm with code values ranging from 30-35 or 05 (not shown here) on the charts for most stations in the Northern Nigeria.

Figure 3: Time series of horizontal Visibility at 0900z for the period of 4th to 16th March, 2006 over (a) Kano and (b) Maiduguri.
Qualitative characterization of the model output
According to Bou Karam et al., validating a model output can be characterized in two ways which are qualitative and quantitative characterization [15]. These two approaches were employed in this study to characterize the WRF-Chem sensitivity in capturing the dust storm of March 2006. Qualitative characterization seeks to validate the models temporal and spatial distributions. This was achieved firstly by verifying the time in which dust was raised and the rate of transporting dust from the source region to the Northern Nigeria as captured by the satellite and the model output and secondly by comparing the area extent of the Harmattan dust covered by both the satellite and the model. For the qualitative characterization the MSG-SEVIRI and OMIAI were used to compare the WRF-Chem modelled dust concentration (μg/kg-dry-air) [54,56] of the five different size bins.
The dust concentrations of different size bin were compared with the MSG-SEVIRI image from 5th to 8th March, 2006 in Figures 4-7 respectively. The figures show the spatial distributions of WRF-Chem model output at 1400UTC of dust concentrations (μg/kg-dry air) for sizes (a) 0.5μm; (b) 1.4μm; (c) 2.4μm; (d) 4.5μm; and (e) 8.0μm, while (f) is the MSG-SEVIRI satellite image. In Figures 4-7(A)-(E), the shaded contours are drawn from 100 to 4100 at intervals of 200 (all in μg/kg-dry air). The Figures 4(F)-7(F) show progressive transport of dust from the source region to the continent of West Africa in the satellite imageries. Figures 4-7(A-E) for the dust concentrations for all sizes also shows the progressive transport of dust particles from source region to the continent of West Africa. In addition, the model’s output for all sizes was able to capture the time the dust particle got to Northern Nigeria in Figure 7(A-E) which is on the 8th as shown in the MSG-SEVIRI image in Figure 7(F). The model output also shows that the sizes 1.4 μm, 2.4 μm, and 4.5 μm in Figures 7 (B), (C), and (D) respectively are more raised and therefore transported. This suggests that over the source region, dust particle of sizes 1.4μm to 4.5μm are more prevalent. Figure 8(A-D) show the sum of all five (5) different sizes of the dust concentration from the model output while the MSG_SEVIRI satellite images are presented in Figure 8(E-H) both for 5th, 6th, 7th, and 8th of March, 2006. The model output and the MSG-SEVIRI are quite in agreement with the drastic reduction (poor) visibility observed synoptically in the Northern Nigeria as earlier presented over Kano and Maiduguri and hence, the model was able to reproduce the spatial and temporal distribution of the dust event as captured by MSG-SEVIRI and also as observed by the poor visibility over Kano and Maiduguri on the 8th of March 2006 as earlier shown in Figure 3.

Figure 4: WRF-Chem simulated output for dust concentrations (μg/kg-dry air) valid at 1400UTC of 5 March, 2006 for sizes (a) 0.5 μm, (b) 1.4 μm, (c) 2.4 μm, (d) 4.5 μm, and (e) 8.0 μm while (f) is for MSG-SEVIRI satellite image.

Figure 5: Same as Figure 4, except for 1400UTC of 6th March, 2006.

Figure 6: Same as Figure 4, except for 1400UTC of 7th March, 2006.

Figure 7: WRF-Chem simulated output for dust concentrations (μg/kg-dry air) valid at 1400UTC of 8 March, 2006 for sizes (a) 0.5 μm, (b) 1.4 μm, (c) 2.4 μm, (d) 4.5 μm, and (e) 8.0 μm while (f) is for MSG-SEVIRI satellite image.

Figure 8: Composite spatial distribution of dust over West Africa from WRF-Chem and MSG-SEVIRI for 5th (a and e); 6th (b and f); 7th (c and g); and 8th (d and h) respectively.
As already pointed out in Figure 8, the modelled result shows some areas with high dust concentration. This can be further verified by comparing the simulated dust pattern with the Earth Probe TOMS Aerosol. Figures 9-12 respectively for 8th, 10th, 12th, and 14th of March, 2006 show the WRF-Chem model output for dust concentration (μg/ kg-dry air) for sizes (a) 0.5 μm; (b) 1.4 μm; (c) 2.4 μm; (d) 4.5 μm; and (e) 8.0 μm overlaid with modelled wind speed and direction, while (f) is the satellite-derived OMI-AI overlaid with ERA-interim wind speed and direction. Overlaying the wind speed and direction was done in order to further verify the daily prevalent wind observed and as captured by the model. In the Figures 9-12 (A)-(E), the shaded contours are drawn from 100 to 3100 at intervals of 200 μg/kg-dry air, while in (f) the shaded contours are from 0.4 to 5.2 at intervals of 0.4. These Figures 9(F)-12(F) show the most intense days of the dust episode and how southerly the dust was transported with the large area covered by the dust particle for the 8th, 10th, 12th and 14th day of March 2006. The maximum dust concentration located in the middle part of Chad as observed in Figures 9-12(F) were all replicated in each of the five dust bin sizes simulated by the model. The Aerosol Index peak for 8th of March is located at the same area as the modelled dust concentration which is in Chad with values (5.2) and (3100 μg/kg-dry air) respectively. The observed surface wind of 10.7 ms-1 overlaid on the OMI AI and corresponding WRF Chem modelled surface wind of 12.9 ms-1 to observe the transport path for 8-14 March, 2006. From this, it is seen that the WRF-Chem wind speed simulated the observed wind speed and direction well over West Africa but with an overestimation of about 2.2 m/s for the maximum wind speed observed. Figures 9(A-E)-11(A-E) successfully reproduced the spatial and temporal distributions of the dust episode in different size bins when compared with TOMS (OMI) Aerosol Index. The dust concentration pattern observed in TOMS AI is also reproduced in each of the five dust bins. It is noteworthy that the dust size bins 1.4 μm and 2.4 in Figures B and C (of 9-12) with peaks at 3100 and 2300 μg/kg-dry air respectively show higher dust concentration than others suggesting that these two size bins are more raised and even more transported than other sizes. The next dust size bin with high concentration of dust with peak at 1500 μg/kg-dry air is 4.5 μm. This further confirms the findings as presented in Figure 7. The prevalent wind (both speed and direction) for dust sizes are the same and also in good agreement with the observed apart from the fact that there is little under-estimation in the model output compared to the ERA-Interim dataset but the directions are in very good agreement. Figure 13 (A-D) shows the sum of all five (5) different sizes of the dust concentration (μg/kg-dry air) with the OMI-AI (Figure 13(E-H)) all for 8th, 10th, 12th, and 14th of March, 2006. In Figure 13 it is observed that the model captured the peaks but not in exact area extent especially on the 12th as depicted in Figure 13(C) and (G), and 14th as depicted in Figure 13(D) and (H), this could be as a result of the accumulation of TOMS-AI. Hence, the comparison of peaks in SEVIRI and OMI images, show a good agreement between the modelled peaks of dust storm activity which includes the spatial and temporal distributions.

Figure 9: Spatial distributions of WRF-Chem simulated dust concentration (μg/kg-dry air) valid for 8 March 2006, overlaid with wind speed (m/s) for different size bin; (a) 0.5 μm; (b) 1.4 μm; (c) 2.4 μm; (d) 4.5 μm; (e) 8.0 μm; and (f) satellite-derived aerosol index.

Figure 10: Same as Figure 9, except for 10 March 2006.

Figure 11: Same as Figure 9, except for 12 March 2006.

Figure 12: Same as Figure 9, except for 14th March 2006.

Figure 13: The composite spatial distributions of dust over West Africa from WRF-Chem and TOMS (OMI) AI for 8th (a) and (e); 10th (b) and (f), 12th (c) and (g), and 14th (d) and (h) of March 2006.
Quantitative characterization of the model output
This type of characterization validates the quantity of the dust particles. Aerosol Optical Depth (AOD) or Aerosol Optical Thickness (AOT) is defined as the integrated extinction co-efficient over a vertical column of unit cross-section. This can be verified by comparing the AOD fields obtained from the Moderate Resolution Imaging Spectroradiometer (MODIS) AQUA Deep Blue Collection 5.1 over desert surface (MYD08_D3 product) and the AOT (at 440nm) of the Aerosol Robotic Network (AERONET), with the modelled integrated AOT (integrated extinction co-efficient over a vertical column of unit cross section).
The evolution of Sahelian dust as measured by MODIS and simulated by WRF-Chem were qualitatively characterised by comparing their composite plots in Figure 14 (A-C) and (D-F) respectively for the 8th (a and d); 10th (b and e); and 12th (c and f) of March 2006. On the 8th of March, a strong belt of high AOT that developed at the mid-eastern part of Chad to the southern Niger and the northern Nigeria with a maximum value of 3.2 spread across the narrow belt in West Africa towards Cote D’Ivore and Guinea. The simulated plot captured the center over mid-eastern Chad but the intensity along the narrow belt decreased compared to what was observed. Nevertheless, the pattern is almost similar. On 10th March, 2006 as shown in Figure 15(B), the dust plume (region of high AOT) spread towards the south of Nigeria. In particular, three intense AOT maxima (with values exceeding 3.2) were simulated around Nigeria (from Benin to southern Chad and Cameroon). On 12 March the intense dust plume was still present to the southern part of Nigeria. The peaks compared with the MODIS are located at the same area but the area extent covered by the model output is less compared to that of the observation data. The model overestimated AOT on the 8th with values 4.4 and 3.6 for the WRF-Chem modeled output and MODIS respectively. The evolution of the AOT can be seen in the observational data from AQUA-MODIS satellite in Figures 14(A-C) as well as in Figures 14(D-F) for the WRF-Chem modeled output. The areas where data are missing for the AQUA-MODIS in Figures 14 (A-C) correspond to either cloudy regions or locations over the desert were the soil albedo is too large. It is interesting to note that there was fairly good agreement between the WRF-Chem simulation and the remotely-sensed observations during the event. Also, that the AOT simulated by WRF-Chem corresponds to dust aerosols only, otherwise all aerosols types have been integrated by MODIS in the computation of AOT at 550 nm.

Figure 14: The composite distributions of daily mean AOT from MODIS/AQUA satellite images and WRF-Chem simulated on 8th (a) and (d); 10th (b) and (e); and 12th (c) and (f) of March 2006.

Figure 15: Vertically integrated modelled AOT and AERONET ground based AOT at different levels over (a) Agoufou; (b) Banizoumbou; (c) Djougou; and (d) Ilorin from 6th – 14th of March, 2006
During the African Monsoon Multidisciplinary Analysis (AMMA) campaign, AERONET photometers were located at Agoufou (Burkina Faso), Ilorin (Nigeria), Djougou (Benin) and Banizoumbou (Niger). Figures 15(A)-(D) show the observed AOT compared to the WRFChem modeled output. The horizontal axis represents the days of the simulation while the vertical axis gives the values of the AOT. As shown in Figure 15, the four stations observed high levels of AOT from 7th to 13th March, 2006 and these were well reproduced by the model. At Agoufou in Figure 15(A), the simulated AOT on the 9th March 2006 was underestimated with ± 1.9 while the rest of the days agreed with a very little difference of ± 0.3 and the trend was well captured. The Banizoumbou station shown in Figure 15(B) is located in the Sahelian area of Niger where the observed strong winds generated a significant dust emission. AOT values exceeding 3 have been observed on 8th March for level 2.0, and they reached values up to 3.7 on 8th March. At Banizoumbou, which is the AERONET station closest to the dust source zone, the simulated AOT compared well with that observed in terms of the trend but underestimates the value with about ± 2.2. This bias is attributable to carbonaceous aerosols (black and organic carbon fractions) as also identified by Tulet [54] which are not included in the simulation. In particular, the peaks observed on 8th and 9th March was well reproduced for the AOT, which decreased after 10th March. The emission was particularly intense in this area because of the soil composition of mainly sand [54].
The AOT over Djougou in Figure 15(C) is under (or over) estimated by the model with about ± 1.4 which could also be as a result of the above mentioned reason. The AOT over the Ilorin station in southern Nigeria as shown in Figure 15(D) is significantly underestimated; the maximum simulated AOT reached 1.1, whereas the photometers registered AOTs above 4 which is a difference of about 2.9. At this stage, there is no sufficient evidence to determine whether the origin of this underestimation is attributable to an underestimation of the simulated dust emission over Niger (surface winds) or to the more local carbonaceous aerosols. This low value implies a high contribution of large particles in the atmospheric column. These particles could be of various origins and are presumably from anthropogenic sources and biomass burning as mentioned above. Therefore, not only active fire aerosols emissions but also background combustion aerosols concentrations could explain the underestimation of the simulated AOT, as these highly optically interactive carbonaceous aerosols were not taken into account in our WRF-Chem simulations.
Relationship between dust loading, emission and concentration
Dust load is the dust particle in the atmosphere while emitted dust is the dust particle emitted from the source regions. Figure 16 shows the dust particle size of 0.5 μm for the modelled (i) dust load (μg/m2) with range of the shaded contour from 2000 to 36000 at intervals of 2000; (ii) emitted dust (μg/m2/s) with shaded contour range from 200 to 3200 at intervals of 200; and (iii) surfaced dust concentration (μg/kg-dry air) with shaded contour range from 40 to 500 at intervals of 20 for 7th, 8th, 10th, 12th, and 14th March, 2006. Subsequently, Figures 17-20 present the same for the size particles of 1.4 μm, 2.4 μm, 4.5 μm and 8.0 μm. In Figures 16-20 (A),(D),(G),(J) and (M) show the area extent of dust load which corresponds to the area extent of surface (1000hpa) dust concentration in Figures 16-20 (C),(F),(I),(J), and (O). The area extent of the dust load is the same with that of the dust concentration but dust concentration increases in areas where dust is emitted for instance in Figure 17 (D-F) for dust size 1.4μm, the dust increased from 200 μg/kgdry air on the 7th to 500 μg/kg-dry air on the 8th due to the dust emitted in Chad on the 8th of March 2006 as shown in Figure 17 (E). The dust concentration reduced when no dust was emitted into the atmosphere as observed in Figure 17 (l) on the 12th of March with peak of 140μg/ kg-dry air, also since no dust was emitted in Chad on the same day as shown in Figure 17 (K) except for the area of Libya. Hence dust load and dust emitted both contributed to either increase or decrease of dust concentration. Figures 17 and 18 also show that the particle sizes of 1.4μm and 2.4μm are more raised and hence transported, which is in agreement with the earlier observation.

Figure 16: WRF-Chem modelled daily dust load (μg/m2), emitted dust (μg/m2/s) and surface dust concentration (μg/kg-dryair) for size bin 1 of 0.5μm for 7, 8, 10, 12 and 14 of March, 2006 as (a-c), (d-f), (g-i), (j-l) and (m-o) respectively.

Figure 17: Same as Figure 16 but for size bin 2 of 1.4 μm.

Figure 18: Same as Figure 16 but for size bin 3 of 2.4 μm.

Figure 19: Same as Figure 16 but for size bin 4 of 4.5 μm.

Figure 20: Same as Figure 16 but for size bin 5 of 8.0 μm.
The impact of wind speed and direction on dust transport
The dust mass flux during the most intense four days of the study period of 8th to 14th March was as depicted in Figures. 16-20, it was characterized by a strong surface wind. Figure 21 (A-I) shows the modeled surface daily wind speed and direction at 1000hpa for 5th to 12th and 14th March 2006 respectively. The actual speed is also presented in Table 1. The maximum wind speed increased from 5th to 7th and decreased from 8th to 14th of March 2006, thereby, inhibited the transportation and dispersion of the raised dust particles and hence maintained high concentration of dust particles over the area. On 7th March, Figure 21 (C) particularly shows these strong winds over the south-western Mediterranean, pressing into northern Algeria, while a related wind system was pushing down towards the West African coast, cutting inland over Western Sahara. Figure 22 (A-I) is the corresponding surface wind speed and direction vector overlaid with the surface position of Inter-Tropical Discontinuity (ITD). On the 8th of March, as shown in Figure 22 (D), the ITD was pushed southward towards the southern part of Nigeria by the strong North easterly wind and it continued shifting southward until the 11th when the south westerly wind became stronger and then pushed the ITD northward towards Northern Nigeria. Similarly, extensive dust activity also occurred at this time over Western Sahara and Northern Mauritania. This analysis shows how the soil composition can rapidly evolve in such semiarid African regions during intense wind episodes. Wind erosion is a selective process that implies the removal of the finest soil particles that contain the greatest amount of nutrients and leaves the coarsest soil particles (like sand) at the surface near the source areas.
| Days | 5th | 6th | 7th | 8th | 9th | 10th | 11th | 12th | 14th |
|---|---|---|---|---|---|---|---|---|---|
| Max. wind speed | 10.1 | 12.7 | 13.7 | 12.9 | 10.8 | 10.5 | 9.79 | 9.47 | 7.65 |
Table 1: Daily Maximum wind speed from 5th to 12th, and 14th.

Figure 21: WRF-Chem modelled surface wind (1000hpa) for 5 to 12 and 14 of March 2006 as a, b, c, d, e, f, g, h, and i respectively.

Figure 22: WRF-Chem modelled surface wind (1000hpa) for 5 to 12 and 14 of March 2006 as a, b, c, d, e, f, g, h, and i respectively
The performance of the Weather Research and Forecasting model with chemistry option (WRF-Chem) Version 3.7.1 [35] in detecting dust entrainment and its transport through the comparison of modelled and several platforms of observed atmospheric data over West Africa has been successfully evaluated. The dust storm episode of March 2006 was an interesting and very popular one due its extreme thickness and drastic reduction in the horizontal visibility and availability of different sources of dust measurements. The visibility data over two northern stations, Kano and Maiduguri were first analyzed in order to ascertain the intensity of the dust storm over West Africa. The visibility data analysis showed that a very drastic reduction of horizontal visibility was observed and gradually moved southward over West Africa signaling the incursion of Harmattan dust from the Saharan desert. The model simulation was performed on a two-way nested domains and the model output was qualitatively and quantitatively compared with several dust characteristics measurements at different stages from being raised through transportation and settling down. The model validity has been tested, primarily by comparing its output with AERONET observations. In particular, the model accurately reproduced the time of the propagation of the dust from Niger and Chad to Nigeria and the Gulf of Guinea. The simulated AOT and that retrieved from the MODIS images on the AQUA platform were of the same order of magnitude and the maxima were located in almost exact locations. This shows that the recent joint evolution of models and satellites could give some useful information on the spatial representation of atmospheric aerosols. This is particularly significant for a large part of the West African region where local observations are relatively sparse. Furthermore, the simulation was used to determine the source regions where the model generated the saltation of dust particles, and it gave reasonable estimates of the order of magnitude of the total mass emitted into the atmosphere. There were few cases of slight over-estimations in the quantity of dust particles modeled compared to observed, this is due to the fact that measurement takes into consideration of carbonaceous aerosols (black and organic carbon fractions) during the four windiest days of the studied period. This shows the importance of soil erosion and its significance during this event.
Note that there are still uncertainties in the capability of the model in reproducing emissions efficiency due to non-inclusion of soil properties which are still not known. Further work could also be carried out on the radiative effects of the dust, which would indicate the impact of dust on the heat budget of the atmosphere. For example, during the March 2006 dust event, surface temperatures at Niamey dropped by 10°C [7]. By calculating the radiative effects, the contribution of Saharan dust to the atmosphere could be established and its effect on climate change.
The WRF-Chem model has been used to make a diagnostic analysis of dust emission, and transport centered on the March 2006 test period. These estimates of dust transport indicate the importance of dust storms, particularly in the regional context. The WRF-Chem model was a very useful tool in order to improve the understanding of such dust storm events and has therefore been ascertained to be reliably used for studying the following:
1. the behaviour of dust storms, including calculating dust entrainment and dust aerosol size distributions;
2. the size(s) of the dust bin most prevalent during a dust event; and
3. quantifying dust emission and transport during the 8th of March 2006 dust event.
The second author appreciated the financial support of the Nigerian Meteorological Agency (NIMET) for sponsoring her through the course of her Master’s program in the Federal University of Technology, Akure. The authors also appreciated the Institute for Advanced Sustainability Studies, Postdam, Germany and the organizers of WRF-CHEM-DE 2017 meeting in Potsdam for giving part sponsors to the second author where the work was first presented and useful comments were made to improve the quality of this work. We also appreciate the anonymous reviewers for their suggestions towards the improvement of this manuscript. All thanks to God for His infinite mercy.
