Commentary - (2014) Volume 2, Issue 2
Keywords: Infrastructure systems; Nuclear generating station; Government accountability office (GAO)
With the onset of climate change, communities have begun to realize the predicted increases in storm intensity, flooding, inundation, heat waves and wildfires; to realize the risk they pose to infrastructure and neighbourhoods; and the disruption they cause to the energy supply and its dependent infrastructure. Direct effects have included damage to power plants, roads, bridges, and communication towers; and resultant interruption of electrical energy, transportation, and communications sectors in cities.
Several literature surveys attempted to describe the effects of climate change on infrastructures [1-6]. However, very few address interdependent infrastructures and only a couple superficially addresses cascading vulnerabilities across infrastructures. Wilby described a hydrological assessment of four main areas: urban ventilation and cooling, urban drainage and flood risk, water resources, and outdoor spaces [5]. Wilby does not couple the different main infrastructure systems of the built environment to each other [1]. Krishen et al. did analyze interdependencies from climate change and adaptation strategies upon infrastructure systems but did not model the interdependencies but instead qualitatively describes how the infrastructures impact each other [1,7].
Suarez et al. assesses the impact of sea level rise on urban infrastructure [8]. The main interdependency studied is how land-use conversion and climate change trends negatively affect the vulnerability of the metropolitan Boston transportation system to flooding.
Some publications have adopted an integrated approach. These papers, however, do not focus on adaptation but on assessment of climate effects [9-11].
The electrical grid is the most representative example of vulnerable infrastructure sectors since these systems are often the first affected by extreme weather phenomena, and since so much of the remaining infrastructure depends upon their proper functioning. That is, a failure at a critical point in the electricity network can quickly translate to failures within other sections of the same interconnection. These multiple failures can then cause cascading effects to additional infrastructure sectors such as water and wastewater treatment, transportation and public parks and recreation areas. As a result, power failures can create a variety of threats to health including contamination of beaches, waterways and drinking water due to loss of electrically supported water pressure and/or flooding causing the release of sewage from water treatment plants. This sewage stream, then, can either flow into rivers, streams or lakes or back up into homes and businesses [12].
The US Canada Task Force, established to mitigate the effects of the 2003 North-eastern blackout, defines a cascading failure as “a dynamic phenomenon that cannot be stopped by human intervention once started. It occurs when there is a sequential tripping of numerous transmission lines and generators in a widening geographic area [13]. Such cascades, a feature of each of the major outages previously described, are the development of a variety of factors: conductor contact with trees; overestimation of dynamic reactive output of system generators; inability of system operators or coordinators to visualize events on the entire system; failure to ensure that system operation was within safe limits; lack of coordination on system protection; ineffective communication; lack of “safety nets;” and inadequate training of operating personnel [13].
An illustration of the complications that can occur as a result of power failure is seen in the example of the San Diego Outage of September, 2011. On September 8, 2011, at 3:38 pm, San Diego County suffered a massive power outage, which affected a large area stretching from Orange County to Baja California and east into parts of Arizona. The two major power sources for the region became inoperable when a 500-kilovolt high-voltage transmission line from Arizona to California failed triggering a cascade of events that then knocked the San Onofre nuclear power plant offline [14]. The outage was initiated by lack of vigilance during a routine repair at a station in Yuma, Arizona, which caused one of three turbines generating electricity at a plant east of Mexicali to create an imbalance in the line running south from the San Onofre Nuclear Generating Station.
The cascade was compounded by an inability to monitor activities in neighboring balancing authorities, which prevented staff from limiting the blackout. The outage, thus, stopped power from coming into the county, halted the San Onofre nuclear power plant and shut down the entire system. The uncontained surge from the outage cut all power from a high-voltage transmission line connecting Arizona and California, and initiated a chain of events that also cut off the San Onofre plant [15].
Impacts to the affected communities were manifold. Electricity for millions of homes and businesses was unavailable for 12 h. During the outage, non-operational generators in the area caused water pressure in the distribution system to reduce significantly, resulting in backflow and contamination to the clean supply to and from homes and businesses. San Diego residents were ordered to boil water prior to consumption [16]. Once power was restored, two incidents of sewage spills occurred. One pump station caused approximately 2.6 million gallons of sewage to be spilled from three manholes onto Sorrento Valley Road and Sorrento Valley Boulevard into the storm drain system and ultimately into the Los Penasquitos Creek. The other spilled approximately 870,000 gallons of sewage into Sweetwater River and ultimately into San Diego Bay [16].
Heat waves enhanced by climate change will likely increase the potential for infrastructure cascades. An additional complication in the San Diego blackout was that the outage occurred on the last day of a heat wave during which temperatures had consistently reached 12 degrees (Fahrenheit) above average [14]. Combined with heating of the power lines due to the increased load of more customers using more power for indoor cooling, outdoor conditions also contributed to line fatigue and collapse. Similarly, in August 2003, when a high-voltage power line in northern Ohio made contact with overgrown trees and disconnected from the system as a result of line slackening due to excess heat from the high current flowing through the line along with elevated ambient temperatures, a power failure started. Although the incident should have activated an alarm in the control room of FirstEnergy Corporation, an Ohio-based utility company, it didn’t, because the alarm system failed. As efforts were made to understand the events taking place, three other lines likewise sank into trees and switched off, forcing the remaining lines in service to operate at higher capacity. Because of the added load, these lines, too, shut down, generating a cascade of failures throughout south-eastern Canada and eight northeastern states [17].
While a wide range of extreme weather events is expected in most regions even with an unchanging climate, and several factors are usually in combination to produce one extreme event; it is nevertheless statistically reasonable to infer that substantial changes in the frequency of extreme events can result from a relatively small shift of the distribution of a weather or climate variable such as global temperature. As climate conditions continue to change, local communities and the infrastructure on which they depend will necessarily respond and adapt.
According to the recently released report by the Government Accountability Office (GAO), the resulting damage from climate change to infrastructure will change US populations, energy supplies, communications networks, and transportation systems [18]. Because our built infrastructure is an interconnected network with many coupled interdependencies, understanding the effect of climate change on the vulnerability of infrastructures to extreme events requires new integrated approaches [19]. Traditionally, studies to date have been limited to direct impacts on un-built infrastructures and do not estimate cascading impacts to our built systems such as power grids and transportation and communication networks. However, extreme events caused by climate change affect local communities and stress vital infrastructures in unpredictable and potentially catastrophic ways. Built infrastructures and their interdependencies change in reaction to climate drivers as the networks expand into newly populated areas. This relationship is as depicted in Figure 1.
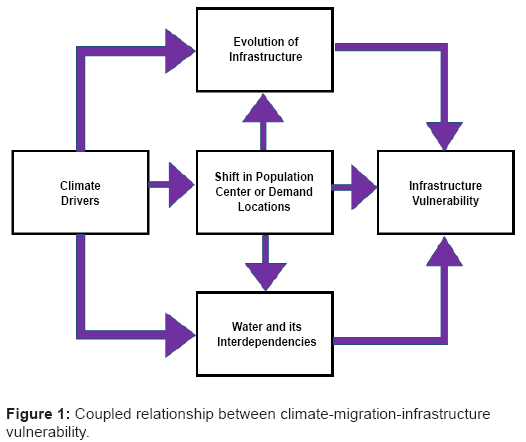
Figure 1: Coupled relationship between climate-migration-infrastructure vulnerability.
This shift will force demand locations for power to change. As a result, networked infrastructures will be required to accommodate new load centers and to minimize vulnerability to natural disaster using different topologies. Power for these networks will depend upon access to economically viable and transportable fuel sources. To provide understanding about the complex interactions among climatic conditions, population shifts, and energy supply and use, new research is needed to assess the impacts of climate drivers on urban areas.
The 2013 GAO report further stated that there are greater needs for better models that could support local infrastructure adaptation decisions. This requirement calls for modeling infrastructure at neighborhood scale and infrastructure design and performance are at the neighbourhood scale. Hence, the response of these elements to climate change will influence the aggregate response of larger-scale infrastructure units.
Over the last decade of research, climate models have become more granular, critical infrastructure models wider, data supporting detailed scenarios, interdependencies better understood, and questions of energy deployment and availability becoming tractable.
As climate models achieve higher resolution capability and more accurate regional predictions, the use of the information provided by the models is shifting towards policy-relevant impacts on human societies. Yet cities are complex systems that tend to grow from the bottom up, their size and shape following scaling laws pertaining to competition for space based on demographic and economic decisionmaking activities over days, weeks and years and at spatial scales of 1km and less [20]. Climate processes, on the other hand, are physical and chemical in nature, have only been reasonably resolved spatially to 4km and are studied commonly in terms of decadal trends. These climatic physical and chemical processes are computed, however, in very small time steps, while infrastructure operations such as power flow is computed in seconds, and human dimensions at yearly time steps. Because climate models work at different spatial and temporal scales from infrastructure and social models, to interface agent models to climate models with coupling and feedback mechanisms presents many new issues requiring new science and constructs for a global approach.
To provide a tested for the interaction and interdependencies of these forces, Oak Ridge National Laboratory (ORNL) developed a suite of tools including Visualizing Energy Resources Dynamically on Earth (VERDE), Energy Awareness and Resiliency Standardized Services (EARSS), Homeland security Extreme weather Awareness Tool (HEAT) and Connected Infrastructure Dynamics Models (CIDM).
This suite provides a common spatial scale for climate infrastructure-population migration modelling by coupling high resolution climate models with the neighbourhood-scale infrastructure modules. Integration of the models provides a framework for placing existing high-resolution climate modeling output, ORNL infrastructure model data and population movements in a common reference grid so these domains can operate on the same spatial and temporal scales. The CIDM suite provides a developing framework which is loosely coupling models to anticipate emerging infrastructure vulnerabilities. By allowing temperatures to rise, correlate temperature rise with increasing power demand, and move people according to possible theories on economic and social attractors, maps of future demand such as Figure 2 (for one set of assumptions ) can be generated. This evolving geographic distribution of demand will likely be satisfied by newly built transmission capacity from new sources of supply or generation to the new points of consumption.
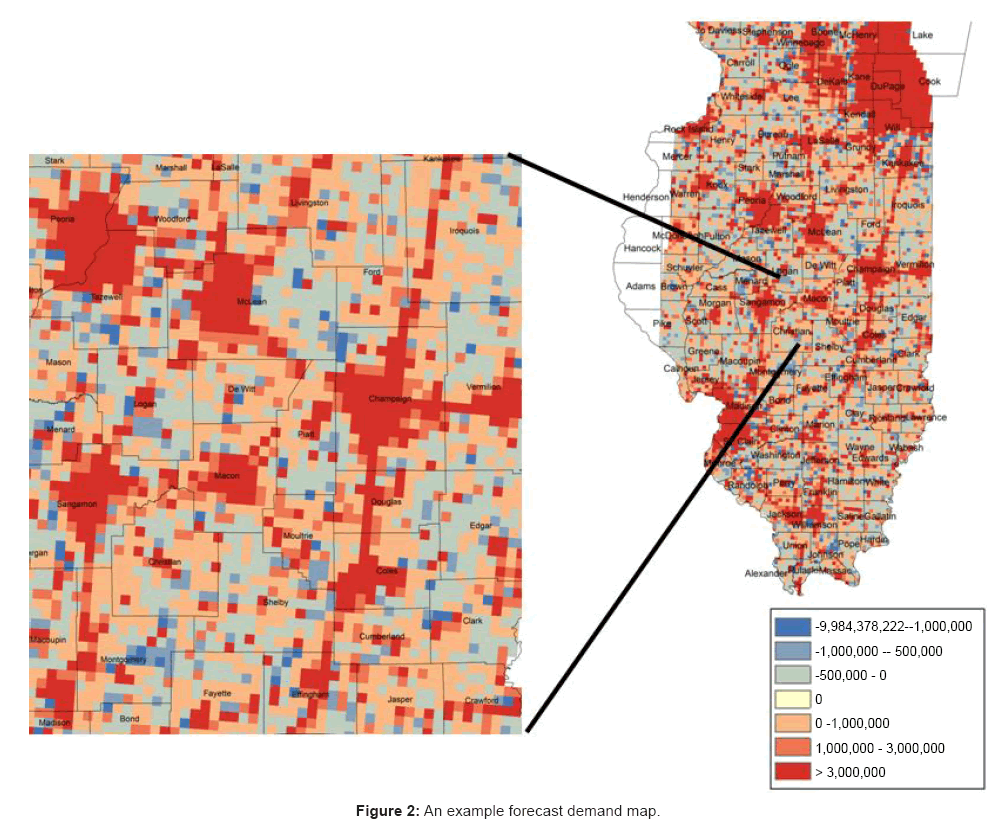
Figure 2: An example forecast demand map.
To demonstrate how this system might work we developed nationwide demand maps for electric power at 1 km resolution using the projected 2057 configuration under temperature and precipitation changes within scenario RCP 8.5 at 12 km resolution through WRF dynamical downscaling of CMIP5 CESM simulations. This map resulted when simulations let power customers migrate and their power usage change from temperature and precipitation drivers. We selected an area of study surrounding Champaign IL as a sensitive area to show the possible insights drawn from coupling these estimates to technology and water forecasts. An example of this forecast demand map is shown in Figure 2.
As climate conditions change, populations shift, the location of energy supply and uses changes, and networked infrastructures simultaneously evolve to accommodate new load centers and minimize vulnerability to natural disasters. If as projected, the frequency of storms increases in the coming decades, populations will continue to shift in response to these extreme weather events. These shifts in turn will place new demands on the electrical infrastructure and must be taken into account as we plan for the robustness and resilience of infrastructure grids over time. Infrastructures and their interdependencies will change in reaction to climate drivers as the networks expand into new population areas and portions of the networks are abandoned when populations move from economically degraded locations. These changes are a strong driver for regional convergence in which vulnerable nodes become concentrated in constrained geographic locations. Thus, models that take into account these changes are more likely to be predictive of future population migration and electrical use patterns than those that rely on past trends alone.
Future work should include the incorporation of the models found by regressions here as utility functions for an agent-based model, which can record movement and new locations of agents as they migrate in response to environmental stressors. It should also include an examination of the response of populations in counties that have experienced hurricanes in close succession, such as those in Louisiana that sustained damage and trauma of hurricanes in both 2005 (Katrina or Rita) and in 2008 (Gustav or Ike), which show a different and distinct signal. With the strengthening of infrastructure, exodus in response to hurricane activity in the future may not be as extensive as it was for Hurricane Katrina [21], but for cities that are most likely to receive and keep refugees as well as those that are most likely to lose residents, the ability to plan accommodation for potential impacts will help those cities return most quickly to equilibrium when disaster occurs and adapt to the most acute climate impacts.
