Research Article - (2017) Volume 5, Issue 1
This study investigated a drought prediction method on the basis of similarity of spatiotemporal patterns of past droughts in Korea. The method was implemented in the following steps: First, drought areas in Korea were divided into four drought subregions by means of hierarchical clustering analysis. Second, spatiotemporal drought statistics for each subregion for the period from 1926 to 2008 were established. Temporal statistics involve the drought onset, end dates, duration, and regional drought intensities, measured by the Effective Drought Index (EDI). These statistics were collected over the four subregions, and spatial patterns of drought were examined. Third, the analogous drought events that had spatiotemporal patterns similar to those of the current or subject drought were selected. Fourth, the progress of the subject drought and the selected drought were compared. Finally, the progress pattern of the subject drought was predicted on the basis of the hypothesis that it will progress in a way similar to the selected analogous case. We applied this predicted method to several previous drought cases and evaluated the prediction efficiency. The results showed that this method was efficient in predicting droughts for about 1 year.
Keywords: Drought; Korea; Hierarchical clustering analysis; Effective drought index
Droughts have occurred since many centuries, and the damage caused by or influence of droughts has increased in recent years. However, because droughts progress slowly unlike other natural disasters and the damage caused by them is gradual, they give us enough time to determine ways in which they can be prevented. Thus, the damages can be reduced if a prediction and warning system is established. However, thus far, no theories have been fully recognized as useful for predicting droughts. Previous studies on droughts were limited to recognizing the signs of droughts before their occurrence; this was achieved by determining their causes through case analysis. As such studies were limited in their scopes; it was not easy to determine the causes of droughts. Hence, in some cases, antithetical theories as well as different causes or results have been suggested for the same droughts. For example, three case studies on droughts in Korea in 1994 [1-3] presented different conclusions on the causes of these droughts. Furthermore, a number of case studies on the drought that occurred in the USA in 1988 [4-7] pointed out different causes.
With such limited resources, researchers tried to predict droughts because of the urgency of doing so. However, because of insufficient studies having been conducted on the causes of droughts, statistical approaches were mainly applied for prediction. In such efforts, statistical approaches such as the probability distribution [8], Markov chain model [9,10], neural network [11,12], low-order discrete autoregressive moving average models [13], seasonal autoregressive integrated moving average model [14], and rotated empirical orthogonal function analysis [15] were used. Nevertheless, such approaches were merely restricted to reporting the results rather than being actually applied to predict droughts.
This study also attempted to predict droughts using an analog method, in which a statistical approach was employed. The analog method is based on the assumption that the progress of a drought will be similar to that of the previous one if the climatic conditions at present are similar to those at the time at which the previous drought occurred. The analog method has been adopted mainly when it is required to predict droughts in spite of poor understanding of their causes. The analog method has been particularly applied to predict the path of typhoons and atmospheric circulation, precipitation, and temperature in the long term [16-19]. Furthermore, previous studies pointed out that the analog method was more useful for long-term predictions than for short-term predictions [20,21]. Hence, the analog method is expected to be a breakthrough to predict droughts in terms of the features of droughts that progress gradually in the long term.
Thus far, no studies were conducted using the analog approach to predict droughts, since it is very difficult to objectively quantify the previous data because of the obscure definition of the period or spatiality of droughts. This study partially attempts to resolve this difficulty by using the Effective Drought Index (EDI) [22]. Thus, this study substantially depends on the fact that the EDI is more precise and accurate than other drought indices [23,24]. The EDI is the useful for worldwide application, because it is independent of climatic characteristics of the locations [22]. The previous studies concluded that the EDI is reasonable enough to assess the intensity and duration of a drought based on the comparison between the existing drought index and the EDI. The EDI calculation and the corresponding strengths are further described in section 2.2.
The spatiality of drought was obtained by the clustering analysis. The clustering analysis is a method to divide subregions by similar characteristics. Most of the previous studies relied on precipitation to define climatological clusters [25,26]. However, these are not suitable for climatological drought clustering, because the precipitation data comes from a short period or a single season. Therefore, this study performed a clustering analysis relying on drought intensity using the EDI collected over the past 35 years. The spatiality of drought was used as fundamental data for the analog method.
However, as it is difficult to predict if cases identical to previous cases would occur again, the prediction of droughts using the analog method cannot be expected to be highly reliable in scientific aspects. This is the common problem of all analog methods that have been studied thus far. Nevertheless, the practical value of the analog method is considered to be significant, which is why it has been applied thus far.
We used the precipitation data from 1925 to 2008. The operation of each observation station started in different years. There were only 6 observation stations in 1925 and the number of observation stations added up ever since. In 1973, a total of 61 observation stations were in operation. As shown in Figure 1, the observation stations are distributed over nationwide.

Figure 1: The locations of precipitation stations used for the study. The number means the number of weather observation station.
Effective Drought Index (EDI)
The EDI is used to measure an intensity of drought. The calculation process of the EDI is as follows:
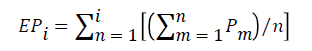 (1)
(1)
DEP = EP-MEP (2)
EDI = DEP / ST (DEP) (3)
Equation 1 expresses Effective Precipitation (EP) expresses currently available water resources generated by past precipitation and reflects the depletion by runoff and evaporation with time. Here, Pm denotes the precipitation in m days before a particular day and it denotes the number of the days whose precipitation is summed for calculation of drought severity. Equation 2 is used to calculate the deviation of EP (DEP) from the climatological mean of EP (MEP) for each calendar day. Finally, Equation 3 is used to calculate the standardized value of the DEP (EDI). Here, ST(DEP) denotes the standard deviation of the DEP of each day. For further details, refer to Byun and Wilhite [22].
The main advantages of the EDI are as follows: (1) It gives a reasonable measure of the current level of water resources by considering daily precipitation accumulation with a weighting function with passing time; (2) It is effective to define the starting day, ending day, and duration of the drought because the EDI is expressed in the unit of days; (3) The EDI has universal applicability because it is independent of the climatic characteristics of a particular region. The feasibility of the EDI has been proved in previous studies [24,27-30].
This study calculated the EDI using the daily precipitation at 61 stations in Korea from 1925 to 2008 (84 years). The EDI values are listed in Table 1.
| Effective Drought Index | Classification | Drought class (n) |
|---|---|---|
| EDI>2.5 | Extreme wet | 0 |
| 1.5 |
Severe wet | 0 |
| 0.7 |
Moderate wet | 0 |
| 0 |
Weak wet (Normal) | 0 |
| -0.7 |
Weak drought (Normal) | 1 |
| -1.5 |
Moderate drought | 2 |
| -2.5 |
Severe drought | 3 |
| EDI ≤ -2.5 | Extreme drought | 4 |
Table 1: The classification of the Effective Drought Index (EDI).
Drought Subregions
Drought subregions were fixed in order to investigate the spatial pattern of droughts. By using the Statistical Package for Social Science (SPSS), hierarchical clustering analysis was carried out; the between-group linkage method with the Pearson correlation measure was used in this clustering procedure. For the clustering, time series from each station were calculated on the basis of a 35 years (1974–2008) monthly minimum EDI. As shown in Figure 2a, we used a clustering procedure for groups 61 to 1 and calculated the between-group correlations for each linkage. If the point where the coefficient between merged clusters increases markedly can be discerned, the clustering process can be stopped at this point. Thus, this study selected five as the appropriate number of clusters. Figure 2b shows the spatial distribution of five clusters: central district (cluster 1; A), southern district (cluster 2; B), eastern district (cluster 3; C), Jeju, Island (cluster 4; D), and Ulreung Island (cluster 5; E).

Figure 2: Hierarchical clustering analysis from the EDI for period 1974–2008. (a) Variation of Pearson correlation coefficient between merged clusters. The number of clusters is from 1 to 59. (b) Spatial distribution of five drought clusters: 1-Central part, 2-Southern part, 3-Eastern part, 4-Jeju Island and 5-Ulung Island. Topography higher than 500 m is shaded.
Construction of drought code
The daily drought codes were generated for the intensity, duration, and spatial distribution of droughts acquired using the EDI. The temporal patterns of drought codes were obtained from the days of duration of the drought and the mean EDI at all stations. The spatial patterns were collected using the drought class on a cluster-by-cluster basis. The code type is ±Em Co AnBnCnDn, and the meaning of each type is described in Table 2. Cluster E was excluded from the analysis because the analysis of this cluster was difficult owing to presence of just one station in this cluster.
| Code | Meaning |
|---|---|
| ± Em | Mean EDI of total station |
| Co | Drought duration (± Em ≤ 0) |
| AnBnCnDn | Drought class of cluster A, B, C, D |
Table 2: The explanation of each part of the daily drought code.
For example, the drought code on December 31, 2008, was -1.60 131 A2B3C2D1, which indicates that the mean EDI was -1.60, the duration of the droughts was 131 days, clusters A and C experienced moderate drought, cluster B experienced severe drought, and cluster D experienced weak drought. As precipitation data on all stations in Korea exist from 1973, the drought indices for each cluster from January 1, 1986, to December 31, 2008, were acquired using the mean EDI of existing stations.
Selection of subject cases
Figure 3 shows the time series of the annual minimum EDI in four subregions (A, B, C, and D) and the deviation of annual precipitation averaged over 60 stations for the past 30 years (1979–2008). The years 1988, 1994, and 2001 were selected as the subject years because they showed an anomalously low EDI and precipitation at the same time. For 1988, cluster B showed the minimum EDI, -2.10, on December 30. In 1994, cluster C showed the minimum EDI, -2.35, on October 10; in 2001, cluster A, showed the minimum EDI, -2.14, on June 11. The days on which the minimum EDI below -1.0 just before the annual minimum value was observed were selected as the subjected days. The dates August 19, 1988, August 12, 1994, and May 10, 2001, were selected as the subject dates since they met the abovementioned criterion.

Figure 3: The time series of the annual minimum EDI (solid line) and deviation of annual precipitation (dotted line) from 1979 to 2008 over 60 stations in Korea.
Selection of Analogous Cases
We selected only one analogous case, one that is most similar to the subject case among several drought cases, by considering the daily drought codes using the following steps:
Step 1: Select cases similar to the subject case by considering the spatial distribution and seasonality of droughts.
Sort out the cases that have the same spatial drought code (AnBnCnDn).
Choose the cases that have similar seasonality (± 30 days from the subject case).
Step 2: If several similar cases are found in the same year, select only one case with the most similar intensity and duration.
2-1. Select the cases with the most similar mean EDI (Em).
2-2. Select the cases with the most similar duration of drought (Co).
Step 3: If similar cases are observed in several different years, select the year with the highest correlation coefficient by comparing the time series.
In accordance with the application of the analog method to the subject drought cases selected as described, August 19, 1988 (-0.93 023 A2B2C1D1) was similar to July 23, 1992 (-1.14 049 A2B2C1D1); August 12, 1994 (-0.96 076 A2B2C2D0) was similar to September 11, 1937 (-1.30 082 A2B2C2D0); and May 10, 2001 (-0.94 036 A2B1C2D1) was similar to June 7, 1996 (-0.95 034 A2B1C2D1).
The subject cases and their analogous cases were examined to determine the similarity in their progresses. Figure 4 shows the comparison between the times series of the subject cases (black line) and analogous cases (gray line) in the subregion where the minimum EDI value was obtained for the subject drought case.

Figure 4: Time series of daily EDI for subject drought cases (1988, 1994, and 2001; black line) and its analogous drought cases (gray line). Vertical dashed line denotes the start date of applying analog method.
For the case on August 19, 1988, both the subject case and the analogous case showed drought conditions for about 4 months (September–December 1988), although the intensity was stronger in the subject case. Two cases showed similar behavior for about 1 year (January 1989–January 1990). For the cases on August 12, 1994, and May 10, 2001, it was confirmed that the subject and analogous cases made similar progress for about 2 years (August 1994–May 1996) and 3 years (June 2001–June 2004), respectively.
After the periods in which the analogous cases showed similar behavior, no more significant similarity was detected in all three cases because they showed different progresses for more than 6 months.
The root mean square error (RMSE) was calculated to examine the change in prediction accuracy with time.
The RMSE is widely used to measure the difference between the actual case and the predicted case. It is calculated using the following formula:
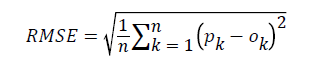 (4)
(4)
Where o denotes the actually observed value, p denotes the predicted value, and n denotes the period of prediction test. The larger the value of the RMSE, the larger is the difference between a subject case and an analogous case.
This study investigated the change in the RMSE on the basis of the monthly minimum EDI with increasing prediction period in annual units (Figure 5).

Figure 5: Root mean square error (RMSE) of 7 years analog forecast.
For the cases on August 19, 1988, and August 12, 1994, the prediction errors increased rapidly after 1 year and 2 years, respectively. In contrast, the case on May 10, 2001, showed low errors compared with other cases, and the errors increased as the prediction period increased.
We extended the application period to 76 years (1926–2008). A drought event was defined as the period of consecutive negative EDIs with the minimum EDI of below -1.
As a result, a total of 75 drought cases were selected, and the analog method was applied to them. In accordance with the mean RMSE of the 75 drought cases, it was found that the prediction errors increased rapidly when the prediction period increased to beyond 2 years (Figure 6).

Figure 6: Mean RMSE of 7 years analog forecast for 75 droughts from 1926 to 2008.
In other words, the prediction using the analog method cannot be extended to beyond 2 years.
This study investigated the prediction of droughts using the analog method. Although the analog method has some limitations as a statistical approach, it is useful to effectively predict droughts for about 1 year. We selected analogous cases on the basis of the similarity of variation in the EDI time series. However, the prediction results may be improved when the analog method is applied in consideration of several factors such synoptic-scale atmospheric circulation and climatic elements highly correlated with droughts. Further, the analog method could be successfully used to predict days on which the analogous and subject cases were not similar. The drought subregions and the daily drought codes presented in this study could probably be used as the fundamental data for drought pattern classification or case selection in future studies. This study is expected to prompt research on the general causes of droughts. If we classify drought cases in accordance with the spatiotemporal patterns of droughts based on daily drought codes and identify the general causes and features from all cases, we might obtain more valuable predictions of droughts.
The author confirms that this article has no conflict of interest.
This work was supported by the R&D Project of the Korea Meteorological Administration “Development and application of technology for weather forecast”.
