Research Article - (2018) Volume 6, Issue 1
The article aims at examining the latest trends in stratospheric processes, in particular, the differentiation of total ozone (TO) over the territory of the Republic of Belarus and their relationship with surface atmospheric circulation. As a result of the statistical analysis, the negative correlation link of TO and surface temperature, enabling to correct a medium-term weather forecast, is confirmed. Furthermore, the fact of violation of the correlation between TO and the surface temperature during the spring-summer ozone anomalies is revealed. The hypothesis of the influence of ozone mechanism on tropospheric circulation processes based on the specific case of the July hurricane of 2016 occurred over the territory of Belarus, is theoretically substantiated and practically illustrated. The hurricane has exemplified the partial effect of the stratosphere on the troposphere, demonstrating the influence of jet streams and large gradients in the field of TO on a height of the tropopause. Thus, one has been positive to conclude that summer sharp changes in TO can lead to strong tropopause variations along with the appearance of powerful jet streams in the gap zones resulted in deterioration of the weather conditions in the lower troposphere.
Keywords: Atmospheric circulation; Stratospheric ozone; Weather forecast; Tropopause height; Jet streams; Stratospheric-tropospheric processes; Ozone mechanism
A climate change (a long-term repeated weather regime, typical of a certain area) has become one of the main themes in specialized literature and media. The reason for this is both the global nature of the changes, and the continuing uncertainties of predictions in the medium and long-term ranges. Forecasting possible climate changes requires knowledge of the variations of external and anthropogenic climate-forming factors, understanding of the mechanisms that determine the response of the Earth's climate system to these impacts.
Until recently, a discussion of the problem of the climate change and their prediction was limited to the lower atmosphere the troposphere. Studies of recent decades have shown that the layers of the upper atmosphere (stratosphere, mesosphere) are essential links in the global circulation of the atmosphere, changes in the thermodynamic parameters of which affect the nature of the circulation of the troposphere (weather conditions). Numerous evidences have been found that perturbations in the upper atmosphere can propagate downwards, and the state of the middle and upper atmosphere affect Manuscript Click here to download Manuscript Manuscript.doc the troposphere [1]. The mechanisms of these connections are not completely revealed and sufficiently quantified, but interrelation between the middle and lower atmospheres is quite obvious.
One of the possible mechanisms for transferring changes in the upper atmosphere (stratosphere, mesosphere) to a surface layer of the atmosphere is an ozone mechanism [2]. Atmospheric ozone, whose concentration in the atmospheric air at various heights is measured in million and billion fractions, is one of the most important atmospheric gases due to its optical properties. In the atmosphere, ozone is located in a layer about 90 km thickness. Around 90% of ozone is concentrated in the stratosphere at altitudes of 10 to 50 km. (~300 mb-10 mb). Ozone is the main gas involved in radiation heating of the stratosphere and it determines its thermal structure (a temperature increase in an altitude range of ~9-50 km) and, consequently, a circulation regime. Ultraviolet radiation (UV radiation) and about 3% of all radiation incidents on the earth is absorbed by stratospheric ozone. This cyclic conversion of ozone generates a release of thermal energy resulted in a temperature rise of the stratosphere.
Total ozone in the upper stratosphere (TO) is determined by a combination of photochemical and chemical processes, below by dynamic processes appearing in the upper troposphere and stratosphere. Back in the early 1970s, Khrgian paid attention to the fact that "The ozone-induced heating is very significant and largely determines the temperature field of the stratosphere Perhaps, ozone is the main factor in the circulation of the atmosphere"[3].
Ozone amount in the atmosphere over some area is characterized by amount of ozone in a vertical column with a base of 1 cm2 (total ozone). Here one assumes a Dobson unit (unit D or DU) as a unit for measuring the total ozone (TO) in the atmosphere. One Dobson unit is equal to a 10-μm ozone layer at standard pressure and temperature. This corresponds to 2.69 × 10¹⁶ ozone molecules per square centimeter of the Earth's surface. Currently, the problem of the Earth's ozone layer is one of the most significant global problems referring to preservation of the natural environment. Significant changes in the ozone amount in the Antarctic atmosphere (Antarctic ozone hole), occurring in the spring for many years, have led to appreciable climate changes on the continent (for example, precipitation rate in Australia) also affecting ocean currents. The interaction of ozone and climate appears to be a complex mechanism due to various processes with feedbacks determining a heat exchange in the atmosphere and depending on external and internal geophysical factors. At present, TO is believed by WMO as one of the most important climatic factors [4].
Much of research has dealt with the relationship between total ozone and a height of a tropopause level [5]. The maximum of TO predicts location of the main anomaly of potential vortices (PVU) before the cyclone originates and during its development. TO data can be a useful indicator of the structure of the mesoscale (a horizontal scale in an approximate interval of 10-1000 km) tropopause, especially in regions poorly covered by tropospheric thermodynamic processes. Holton [6] determined the tropopause level as an isentropic surface or a potential vorticity surface (PVU). Hudson [7] presented clear evidences that total ozone field in the northern hemisphere could be divided into separate zones whose limits were confined by fronts of the subtropical and polar upper troposphere, and in winter by a position of a stratospheric polar vortex. The connection of TO with depressions and ridges of baric formations was evident from the first years of ozone research. In the A.I. Voyejkov Main Geophysical Observatory (MGO) one has made an analysis by comparing synoptic charts AT300, AT200 with data of TOA [8]. The largest TO values are typical for arctic air masses while the lowest ones - for tropical air masses. The intermediate TO values are observed in moderate air masses the boundaries of regions with high and low TO values always coincide with polar and subtropical high-altitude frontal zones that separate these air masses. Most of the studies on the relation of TO to the weather and climate have been conducted employing data averaged zonally over a long period of time. Existing numerical prognosis models take account of the stratosphere temperature but do not consider the effect of moving tropospheric air masses on the ozone layer, which determines temperature changes of the lower stratosphere. For a number of years, stratospheric tropospheric interactions have been investigated at the National Ozone Monitoring Research and Education Center of the Belarusian State University (NOMREC BSU) along with the A.I. Voyejkov Main Geophysical Observatory. Much attention has been paid to the analysis of one aspect of this interaction: influence of the distribution of stratospheric ozone on the characteristics of tropospheric circulation and the associated weather and climate conditions. Thus, special attention is given to stationary atmospheric fronts, jet streams, location of a tropopause level and an intratropical convergence zone. The analysis of long-term series of TO observations has showed that in the summer the changes in TO occur synchronously with the temperature change at the Earth's surface, and in the winter this tie is broken while again being restored in the spring. Based on the obtained regularities, in the BSU one has elaborated a procedure for a short-term (up to 3 days) forecast of levels and irradiation doses for biologically active UV radiation (UV index) relied on the forecast of TO and cloud cover during the vegetation period (end of March-mid September) [9].
The analysis of data from orbital observations on the drift of ozone anomalies along with numerical simulation data in the WRF (Weather Research Forecast) and IFS Integrated Forecast System) systems have showed that there is correlation between specific weather changes and ozone anomalies route [10]. The results obtained have enabled to formulate some assumptions about the cause effect relations between the dynamics of stratospheric ozone and tropospheric circulation as well as specific details of their mechanism [2]. The field of total ozone is formed by the competition of two mechanisms, one of which, that may be called "radioactive", is responsible for the formation of this substance in the upper stratosphere and lowers the height of the tropopause, while the other, the traditional one, presumably called "thermodynamic", acts in the troposphere creating conditions for dry and wet instability and, due to this, raises the height of the tropopause reducing total ozone amount. The mutual influence of these mechanisms depends on a region and a season. The concept of the interaction between TO and tropospheric circulation, based on a comparison of the state of the global circulation in the troposphere and the state of the TO fields in the stratosphere, includes the following key points of the "ozone" mechanism that directly affects the weather and climate in a given region combination of stratospheric processes determines the spatial distribution of TO in the stratosphere, which, in turn, forms the height of the tropopause over the cells of global circulation variation in a position of the tropopause changes a speed of the circulation processes in the troposphere thereby affecting a position of the stationary fronts stationary fronts, which are the boundaries between the global circulation cells, determine trajectory of the drift of baric formations in the troposphere. A relief of the tropopause directly reflects the general picture of the atmospheric circulation and the distribution of the fields of TO. Where there is more TO the tropopause is lower, where there is less - the tropopause is higher. As a result, the level of the tropopause is determined by the competition of both underlying and overlying atmospheric processes. Thus, the effect of ozone on the weather and climate in a given region is not due to some direct effect on atmospheric fluxes, but primarily by changing the position of the stationary fronts and, respectively, the characteristics of the global circulation cells themselves (for example, a shift in the tropopause level affects the entire circulation cell) (Figure 1).
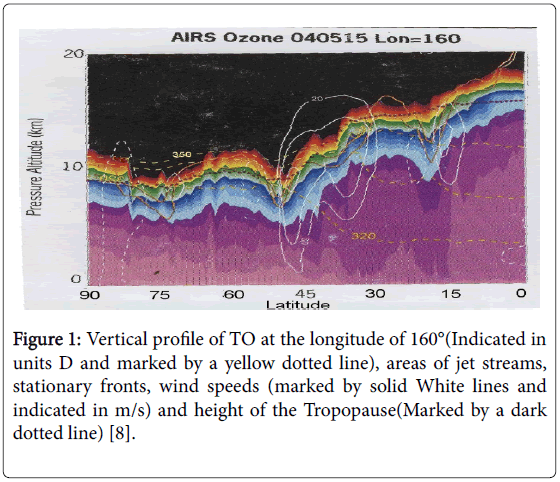
Figure 1: Vertical profile of TO at the longitude of 160°(Indicated in units D and marked by a yellow dotted line), areas of jet streams, stationary fronts, wind speeds (marked by solid White lines and indicated in m/s) and height of the Tropopause(Marked by a dark dotted line) [8].
The degree of influence of the tropospheric and stratospheric mechanisms depends on a region and a season. In the tropical region, thermodynamic processes (convection) prevail throughout the year in the unstable troposphere and in the polar latitudes so does the stratospheric ozone mechanism. In the middle latitude zone, where Belarus is located, the tropospheric processes play a significant role in the summer, and the ozone mechanism starts dominating during the transition to the winter season [2].
A statistical analysis of the relationships of the tropospheric parameters and tropospheric circulation processes with the distribution of the TO fields, analysis of long-term changes in the ozonosphere state at global and regional scales has been conducted using the following set of data OMI/OMPS satellite data for TO values, represented by average daily TO values in nodes of a gratitude of 1.10 × 2.50 for the periods of 1979-1992 and 1997-2016, and by maps of the TO fields. From these data, time series of TO values for several midlatitude ozone stations have been obtained. Those are Bielsk (Poland, 51.84 N, 20.79 E), Potsdam (Germany, 52.22 N, 13.05 E), and Minsk (Belarus, 53.83 N, 27.47 E). The satellite data have been utilized as the data of ground-based measurements, due to some specifics of a direct sun procedure, are discrete and, hence, poorly applicable in the statistical analysis. A comparative analysis of the ground-based and satellite data has showed that, despite some differences in the values of TO, their magnitudes, temporal variation (day-to-day changes and trends) are in good agreement. The long-term averages (daily and monthly ones) for the period of 1997-2016, obtained for the given regions, are considered as a climatic norm Maps of the distribution of the TO fields and the variation fields from multi-year averages are provided by the World Ozone Monitoring and Mapping Center (Canada) Meteorological data are presented by NCEP/NOAA Reanalysis (from 1979 to 1992) and observations of the Hydro meteorological Center of the Republic of Belarus (from 1997 to 2016). The climatic norm for the surface temperature of Minsk has been taken for the period of 1961-1990. When analyzing the link between TO and the circulation processes, one has used the classification of the circulation processes according to Dzerdzeevsky. The analysis of the relationship between the TO fields and the tropospheric temperatures has been performed employing the correlation analysis for time series of the annual interval (365 days) as well as for individual seasons. To derive some data, the numerical model GFS (Global Forecast System) has been used, for data visualization the ArcGIS program and the numerical mesoscale model WRF ver.3.9 have been utilized. For the visualization of experimental data and mapping of TO over Belarus and the border area by the interpolation of values at the indicated points, the ArcGIS program has been used. Data on TO (OMI) are taken for the following cities: Minsk, Mogilev, Vitebsk, Grodno, Brest, Gomel, Polotsk, Pinsk, Kiev, Lvov, Warsaw, Lublin, Daugavpils, Vilnius, Pskov, Roslavl, Smolensk and Bryansk. The initial data of a numerical mathematical calculation by model WRF ver.3.9 for the synoptic situation on July 13, 2016 over the territory of Belarus are as follows: computational grid with a step of 15 km and 3 km 35 levels in vertical, up to 50 hPa Lambert's cartographic projection parameterization of microphysics by WRF Single moment 6 class Scheme parameterization of cloudiness by Grell 3D Ensemble Scheme.
A statistical evaluation of stratospheric-tropospheric relations for the region of the Republic of Belarus
A joint analysis of the daily and monthly averages of TO and T1000 for the periods of 1979-1992 and 1997-2016 have shown that in the summer the changes in TO over the regions considered occur synchronously with the temperature change at the Earth's surface (temperatures on the isobaric surface of 1000mb) in winter this connection is broken while again being restored in the spring (Figure 2).
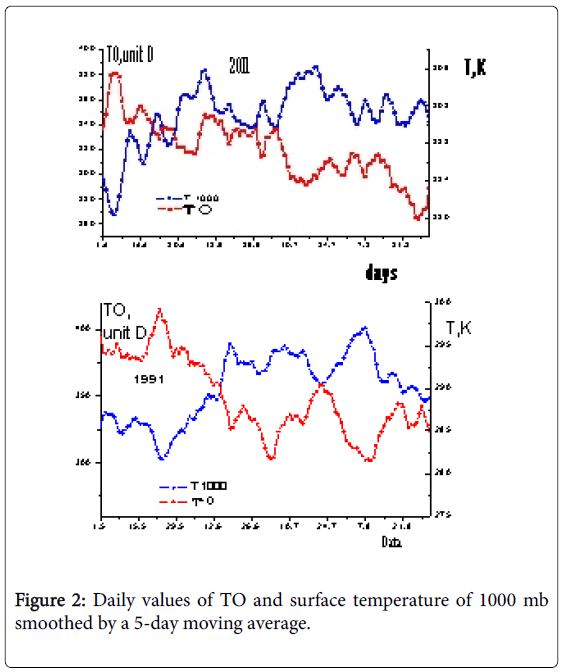
Figure 2: Daily values of TO and surface temperature of 1000 mb smoothed by a 5-day moving average.
For the entire examined period, statistically significant autocorrelation has been obtained between the daily temperatures of T1000 and TOA. The values of correlation coefficients undergo annual variability and amount to -0.6 to -0.8, Employing the revealed regularity and its numerical characteristics, NOMREC specialists have elaborated a procedure of a short-term (up to 3 days) prediction of levels and doses of irradiation with biologically active UV radiation (UV index), based on the forecast of TO and cloud cover in the vegetation period (end of March -mid September) [9].To define the correlation dependence between TO and the surface temperature, one has used the values of TO (OMI satellite) for Minsk and the observations of the surface temperature for the period of 1997-2016 made by the Hydro meteorological Center. The daily data obtained for TO and T1000 have been computed into monthly and annual averages. For the correlation relationship, the deviations of the mean monthly values of TO and T1000 from their climatic norm have been considered. The results are shown in Table 1. The average annual correlation coefficient is -0.32. In some years it reaches -0.7. The largest seasonal long-term coefficients are observed in autumn (-0.37) and in summer (-0.44). In individual seasons, the coefficient can reach -1.0 or on the contrary, positive values of +0.4-0.7.The study of the TO dynamics over the territory of the republic has revealed its connection with the global circulation processes in the troposphere. Thus, the annual maximum of the average monthly values of TO in the period of 1997-1992 was observed in April, and from the mid-90s to 2009 the annual maximum shifted to earlier periods and was observed in March (Table 1).
| Years | 1997 | 1998 | 1999 | 2000 | 2001 | 2002 | 2003 | 2004 | 2005 | 2006 | |
|---|---|---|---|---|---|---|---|---|---|---|---|
| Annual coefficient | 0.35 | -0,56 | -0.46 | -0.38 | -0.76 | -0.40 | -0.24 | -0.20 | -0.20 | -0.37 | |
| Spring (MAM) | 0.92 | -1,00 | -0.80 | -0.37 | -0.55 | -0.66 | -0.52 | -0.93 | -0.83 | 0.42 | |
| Summer (JJA) | -0.93 | -0.98 | -1,00 | -0.54 | -0.94 | -0.88 | -0.98 | -0.92 | -0.29 | -0.49 | |
| Winter (DJF) | 0.36 | -0.82 | -0.95 | 0.79 | -0.86 | 0.48 | -0.24 | 0.86 | 0.13 | 0.59 | |
| Autumn (SON) | 0.36 | -0.99 | -0.31 | -0.21 | -0.87 | -0.02 | -0.78 | 0.62 | -0.93 | -0.93 | |
| Years | 2007 | 2008 | 2009 | 2010 | 2011 | 2012 | 2013 | 2014 | 2015 | 2016 | средн |
| Annual coefficient | -0.20 | -0.36 | -0.49 | -0.59 | -0.31 | 0.07 | -0.66 | -0.62 | -0.18 | -0.55 | -0.32 |
| Spring (МАМ) | -0.76 | -0.28 | -0.78 | -0.77 | -0.71 | 0.28 | -1,00 | -0.98 | -0.97 | -0.81 | -0.36 |
| Summer (JJA) | -0.98 | -0.92 | 0.26 | 0.41 | 0.30 | -0.17 | -1,00 | -0.77 | -0.88 | -1,00 | -0.44 |
| Winter (DJF) | -0.28 | -0.01 | -0.24 | 0.62 | -0.01 | -0.55 | -0.78 | -0.72 | 0.74 | -0.82 | -0.31 |
| Autumn (SON) | -0.15 | -0.56 | -0.84 | -0.86 | 0.37 | 0.78 | -0.39 | 0.66 | -0.66 | 0.21 | -0.37 |
Table 1: Correlation coefficients for variations of TO and surface temperature for Minsk. Red color marks the highest coefficients of autocorrelations, yellow-medium ones, white-low ones and green positive coefficients.
For the analysis of fluctuations of troposphere circulation processes, the typification of macro scale circulation processes by Dzerdzeevsky was used along with the corresponding calendar reflecting the shift of circulatory situations over the European sector of the Northern hemisphere. The frequency of recurrence of the main groups of circulation processes was calculated for the spring months. It was found out that in April, in the period of 1979-1997, the number of days with a meridional northern circulation had a significant negative trend. In March, the number of days, in which the synoptic situation, referring to the meridional northern circulation, arises, is increasing (Figure 3). A comparison of the number of days with a certain type of the circulation with the average monthly values of TO for the same periods shows that the shift in the annual ozone maximum to earlier periods coincides with the fluctuations of the macro scale circulation processes in the Northern hemisphere. Analysis of the long-term trends of the ozonosphere over the territory of the country has showed that the negative trend of ozone amount over the Republic of Belarus has slowed down, which corresponds to the estimates of global trends in the ozonosphere of the Earth. The analysis of the average monthly values of TO for the period of the strong negative trend of TO (1979-2000) and the trend slowdown (2000-2014) have enabled to detect the following specifics. In the first period, the negative trend in one way or another was present in all the seasons, whereas, starting from 2000; the magnitude of the negative trend for all the months, except June and September, has significantly decreased, and in January and February there is a small positive trend in the average monthly values of TO (Figure 3).
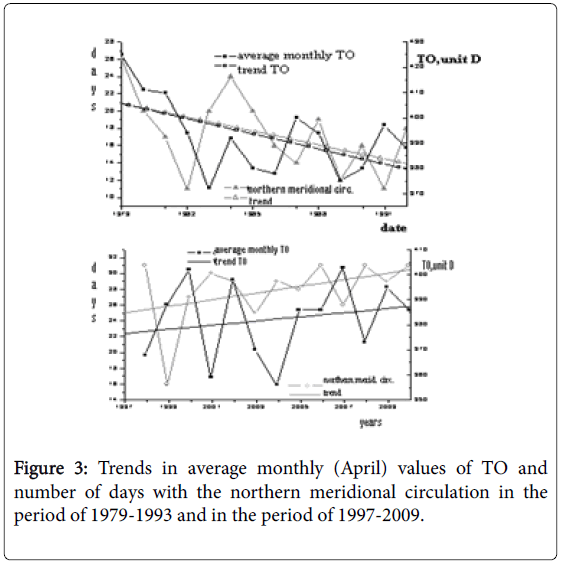
Figure 3: Trends in average monthly (April) values of TO and number of days with the northern meridional circulation in the period of 1979-1993 and in the period of 1997-2009.
Thus, the studies conducted have confirmed the existence of a connection between the dynamics of the fields of TO (or the dynamics of stratospheric ozone) and the tropospheric processes in Belarus region. The high correlation coefficient between TO and the surface temperatures indicates that in the warm season, the tropospheric height is greatly influenced by the tropospheric convective processes; in the cold season, the height of the tropopause is, obviously, formed by the stratospheric processes. The hypothesis of the effect of stratospheric ozone (ozone mechanism) on the tropospheric processes has been applied to a specific synoptic situation. The considered situation reflects a violation of the statistical relationship between TO and the surface temperature, which reveals (most often), as one has already mentioned.
Above in summer and spring. At the same time, in summer, TO undergo the thermodynamic deformation, but, still, there are situations when it affects the tropospheric circulation. Almost in all the cases this is due to the drift of ozone anomalies over the territory of Belarus.
Analysis of the upper atmosphere and numerical calculations of the troposphere for July 10-13, 2016
On July 10-13, 2016, a hurricane with a gust of wind up to 21 m/s passed over the territory of Belarus, damaging 510 settlements according to a report of the Ministry of Emergency. The hurricane is believed to be the strongest one in the country’s history.
The territory of Belarus was in the intermediate zone between the deep cyclone, whose center was located above the Kola Peninsula, and the anticyclone, which was located above the Black Sea. Also, in maps of 500 hPa can be seen that the maximum of the Ross by wave passed across Belarus. Thus, the synoptic situation of July 10-14, 2016 led to a collision of cold and warm masses followed with instability in the atmosphere and resulted in the formation of a mini-cyclone over the territory of the Carpathian Mountains. The computation maps of the WRF model were visualized for July 13, 2016 for the territory of Belarus with different resolution steps 3 km and 15 km and a time interval of 1 h for a more detailed and accurate analysis of the synoptic situation. Figure 4 demonstrates the mini-cyclone passing through the territory of Belarus, with a minimum pressure in the center of 1005 hPa. The main areas, where the greatest amount of precipitation fell, were the Grodno, Minsk and Vitebsk regions. On July 10, Belarus was in a zone of a low height of the tropopause (Figure 5), and on July 13 it was in a high tropopause zone (Figures 4 and 5).
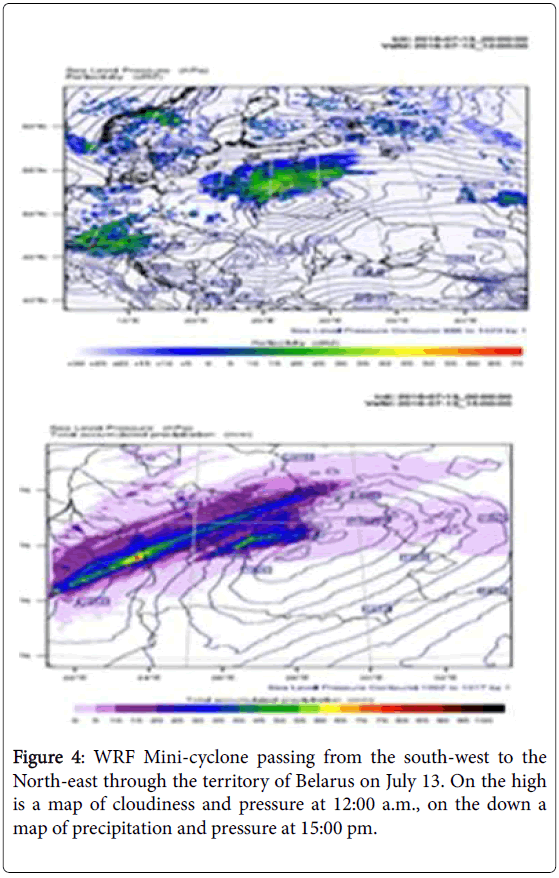
Figure 4: WRF Mini-cyclone passing from the south-west to the North-east through the territory of Belarus on July 13. On the high is a map of cloudiness and pressure at 12:00 a.m., on the down a map of precipitation and pressure at 15:00 pm.
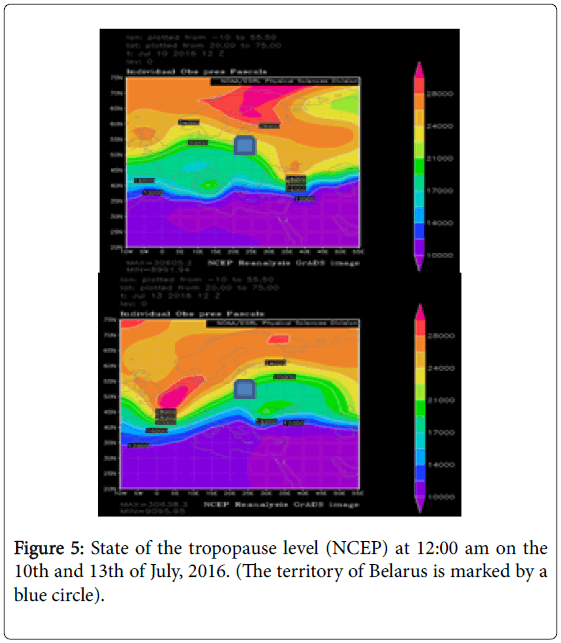
Figure 5: State of the tropopause level (NCEP) at 12:00 am on the 10th and 13th of July, 2016. (The territory of Belarus is marked by a blue circle).
The analysis of the jet streams have showed (Figure 6) that during this time period the territory of Belarus was under the prevalence of strong winds, and the flow itself passed directly through the territory of the country, which led to the formation of gusty winds with a speed of over 20 m/s (Figure 6).
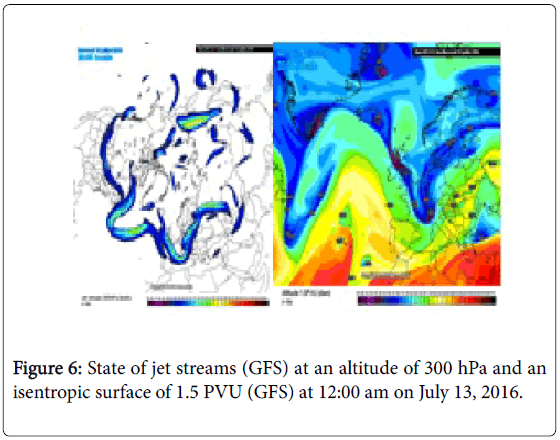
Figure 6: State of jet streams (GFS) at an altitude of 300 hPa and an isentropic surface of 1.5 PVU (GFS) at 12:00 am on July 13, 2016.
According to the 1.5 PVU maps for 10-13 July, one can make a conclusion that Belarus was in the intermediate zone of the isentropic surface (Figure 6), which was characterized by instability. The maps of the isentropic surface reflect surfaces of an equal potential temperature or entropy. Data on a zonal wind from NOAA/NCEP reanalysis for July 10-13, 2016 display a wind gain at an altitude of 300 hPa for the city of Minsk. The maximum values were observed on July 12 and 13 (Figure 7).
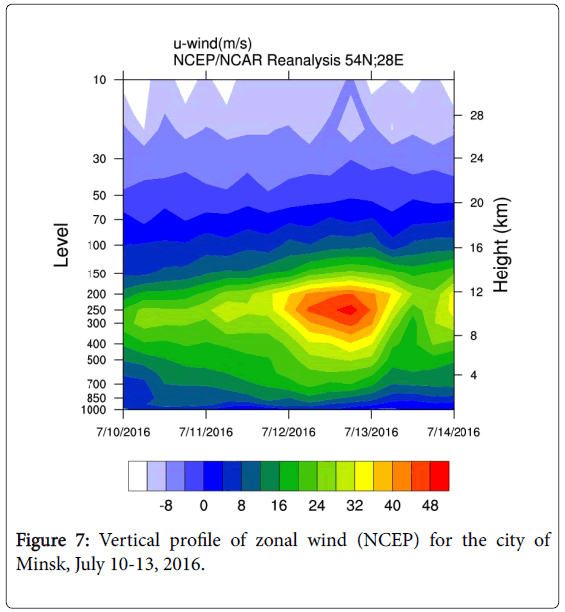
Figure 7: Vertical profile of zonal wind (NCEP) for the city of Minsk, July 10-13, 2016.
When examining the vertical distribution of relative humidity (Figure 8) during the mini-cyclone, it can be seen that on July 13, in the north of the country, moisture (relative humidity 75-90%) reached the highest levels of altitudes of 200-300 hPa penetrating into the stratosphere and thereby destroying TO. At the same time, on July 14, when the cyclone left the territory of Belarus, we observe a low relative humidity (10-30%) in the upper part of the entire profile. For a more detailed study of the situation, data were obtained on the coordinates of satellite measurements of TO at local points for the territory of Belarus and border cities (Table 2).
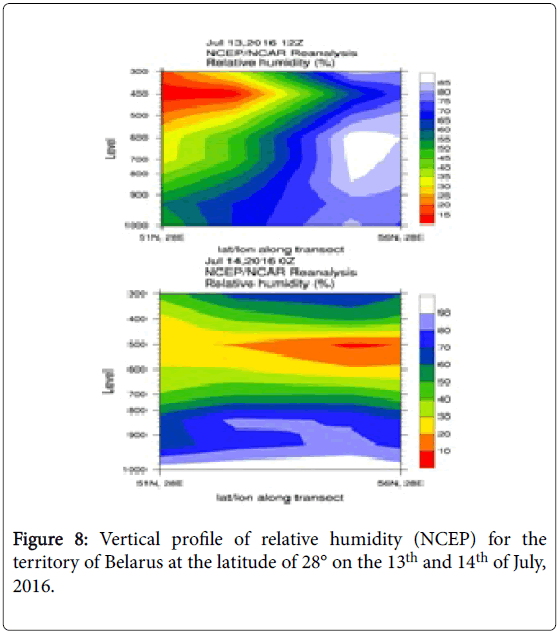
Figure 8: Vertical profile of relative humidity (NCEP) for the territory of Belarus at the latitude of 28° on the 13th and 14th of July, 2016.
| Date/City | Vitebsk | Gomel | Mogilev | Brest | Grodno | Minsk | Pinsk | Polotsk | Vilnus |
|---|---|---|---|---|---|---|---|---|---|
| 08.07.2016 | 356 | 357 | 358 | 369 | 343 | 365 | 340 | 345 | 354 |
| 09.07.2016 | 355 | 346 | 344 | 373 | 360 | 353 | 338 | 344 | 349 |
| 10.07.2016 | 346 | 337 | 345 | 335 | 338 | 345 | 358 | 343 | |
| 11.07.2016 | 326 | 329 | 331 | 315 | 316 | 317 | 370 | 371 | 372 |
| 12.07.2016 | 316 | 313 | 321 | 309 | 305 | 311 | 339 | 336 | 352 |
| 13.07.2016 | 297 | 308 | 325 | 307 | 303 | 306 | 314 | 330 | 322 |
| 14.07.2016 | 299 | 303 | 316 | 312 | 313 | 308 | 321 | 362 | 335 |
| 15.07.2016 | 302 | 299 | 308 | 318 | 323 | 311 | 336 | 350 | 347 |
| 16.07.2016 | 305 | 283 | 308 | 310 | 311 | 299 | 315 | 312 | 306 |
| Date/City | Kiev | Lvov | Lublin | Warshava | Smolensk | Pskov | Roslavl | Bryansk | Daugavpils |
| 08.07.2016 | 367 | 342 | 334 | 343 | 346 | 345 | |||
| 09.07.2016 | 357 | 349 | 345 | 339 | 350 | 338 | 338 | 345 | |
| 10.07.2016 | 374 | 344 | 356 | 343 | 358 | 362 | |||
| 11.07.2016 | 369 | 372 | 371 | 369 | 364 | 355 | 362 | 361 | |
| 12.07.2016 | 313 | 330 | 347 | 323 | 351 | 322 | 315 | 353 | |
| 13.07.2016 | 309 | 314 | 314 | 324 | 331 | 335 | |||
| 14.07.2016 | 298 | 304 | 362 | 354 | 364 | 364 | |||
| 15.07.2016 | 325 | 310 | 324 | 338 | 371 | 337 | 334 | 353 | |
| 16.07.2016 | 313 | 316 | 318 | 325 | 305 | 318 | 316 | 329 | 315 |
Table 2: Distribution of TO for cities of Belarus and border areas.
After interpolating the values with the same TO figures by means of the ArcGIS program, it was revealed that the field of TO was of a nonhomogeneous nature. A detailed analysis of the distribution of TO over the territory of Belarus (Figure 9) clearly indicates a decrease in TO before the hurricane in all Belarusian cities which is due to the arrival of the moisture in the stratosphere. On July 13, the ozone minimum was reached, and hereafter TO began to recover. Interestingly enough that on July 11-13, in all regional cities, TO was practically at the same level, except for Mogilev and Polotsk, where the values were higher by approximately 20-35 units. Thus, large gradients along the Brest-rash line turn out to be in the field of TO. In the north, south and southeast, the TO maxima were observed lowering the height of the tropopause, and that formed a certain narrow spatial corridor from the southwest to the northeast, along which the mini cyclone passed (Figure 4). It was on this conventional line of Brest-Orsha that one saw the maximum damage. The TO maxima generated a decrease in the height of the tropopause in the north and south of the territory of Belarus.
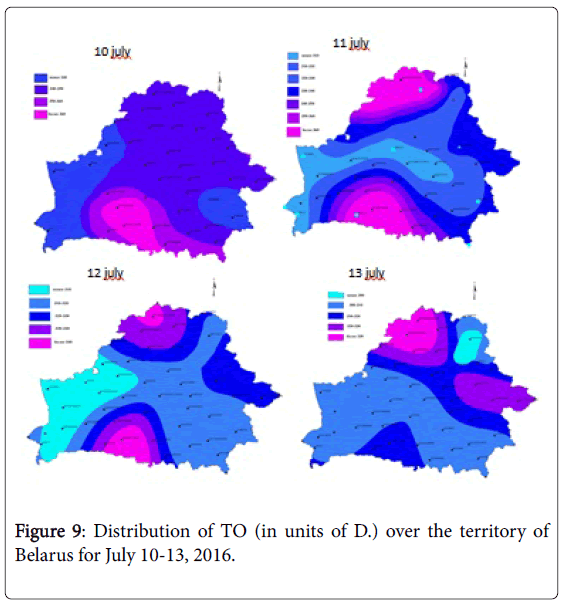
Figure 9: Distribution of TO (in units of D.) over the territory of Belarus for July 10-13, 2016.
As a result, the tropospheric air masses, namely the mini cyclone, which was formed literally during half a day in the Carpathian region, passed through Belarus from the southwest to the northeast. Moistsaturated air with strong winds, bounded on both sides (northern and southern parts of Belarus) by a low tropopause height and high TO, had to move along a narrow corridor with a high tropopause height and low TO. This situation resembles the well-known problem of solving the Bernoulli equation, when the flow velocity increases at the point of the narrowing of the channel. This example well illustrates the main provisions of the hypothesis of the ozone mechanism influence on the weather processes and regional climate and adds some novelty to our understanding of the development of atmospheric processes.
Namely, a change in the height of the tropopause over a specific air mass can alter the intensity and general character of the tropospheric circulation in a certain area. The analysis and numerical calculation have showed that even in summer, when the TO plays a secondary role in the circulation of the atmosphere, still, under ozone anomalies (positive or negative) the (winter) ozone mechanism affecting the tropospheric circulation is involved. Thus, summer sharp drops in TO can lead to strong changes in the level of the tropopause, appearance of powerful jet streams and, as a consequence, deterioration of weather conditions in the lower troposphere (Table 2).
As a result of statistical processing of multi-year monitoring data, the strong autocorrelation link between fluctuations in surface temperature deviations and TO deviations has been revealed for Minsk covering the period of 1979-1992. The average multi-year autocorrelation coefficient is -0.39 with the highest values in some years of -0.6 to -0.8. The average annual correlation coefficient amounts to -0.32 for the period of 1997-2016. The largest seasonal multi-year magnitudes of the autocorrelation coefficient are observed in the autumn and in the summer. Those are -0.37 and - 0.44, respectively. In some years, the autocorrelation coefficient reaches both -1.0 and +0.7. Employing the regularity found, one has elaborated the procedure of the short-term (up to 3 days) prediction of the levels and doses of irradiation with the biologically active UV radiation (UV index), based on the forecast of TO and cloud cover. The results of the study have confirmed the validity of the concept inferring the ozone mechanism in the development of atmospheric processes. The essence of the concept is that the field of total ozone is formed by the competition of two mechanisms, one of which, that may be called "radioactive", is responsible for the formation of this substance in the upper stratosphere and lowers the height of the tropopause, while the other, the traditional one, presumably called "thermodynamic", acts in the troposphere creating conditions for raising the height of the tropopause resulted in the reduction of total ozone amount. The mechanism itself does not act directly, but instead by changing the position of global circulation cells (with their characteristic elements stationary fronts, jet streams and the level of the height of thetropopause). In the process of the statistical analysis, the fact of violation of the correlation between TO and the surface temperature during the spring-summer ozone anomalies has been discovered. To clarify the reasons for these deviations, the specific case of the extreme weather phenomenon in the summer has been treated. The case of the hurricane, occurred on July 10-13, 2016 in Belarus, has illustrated the partial effect of the stratosphere on the troposphere by demonstrating the influence of the jet streams and large gradients in the field of TO over the height of the tropopause. This example improves understanding of the development of atmospheric processes. In particular, the change in the height of the tropopause (or TO) can alter the tropospheric circulation not only in winter, but also in summer, when ozone anomalies are observed. Thus, it has been defined statistically, experimentally and by the modeling procedure that even in summer TO can influence the troposphere and contribute to the emergence of dangerous meteorological phenomena such as strong wind gusts. The study is a part of the scientific project "Development of methods for analyzing satellite information to assess impact of the ozone mechanism on the quality of forecast of the atmospheric processes in the Republic of Belarus" within the framework of the state program for 2016-2020 "Information technologies, space and security".
