Opinion Article - (2015) Volume 3, Issue 3
Keywords: Climate change; Global warming; Ocean sciences
Data collection
Leading survey research firms fielded both surveys -Gallup in 1991 and Harris Interactive in 2007. The 1991 survey was commissioned by the Center for Science, Technology, & Media and was fielded October 14-25, 1991 [14]. The 2007 survey was commissioned by the Statistical Assessment Service at George Mason University and was fielded March 19-May 28, 2007 (stand-alone analysis of the 2007 data has been published elsewhere [15,16]. The two samples were of similar size, 400 in 1991 and 489 in 2007. No records are extant documenting the response rate for the 1991 data; the 2007 survey had a response rate of 56%. The 1991 survey was administered over the telephone, with up to five calls placed to reach the target. The 2007 data come from a mailadministered survey with a preliminary letter mailed to all respondents, followed by the questionnaire.
The sample universe for both surveys was working U.S.-based scientists doing research in areas related to climate change. As a proxy for this universe, the memberships of two organizations were used to create a sampling frame: the American Geophysical Union (AGU) (Atmospheric and Ocean Sciences sections only), the professional association of earth and space scientists; and the American Meteorological Society (AMS), the professional association of atmospheric and related oceanic and hydrologic sciences. In 1991, the sample frame consisted of the membership lists of these two organizations within the continental US Sampling was proportionate to membership, producing a geographically stratified random sample. In 2007, AGU and AMS membership lists were no longer publicly available. This required a modified sampling frame, drawn from the profiles of scientists in American Men and Women of Science, 23rd Edition (AMWS) [17], who listed affiliation with AGU (Atmospheric and Ocean Sciences sections only) and/or AMS. AMWS is the most widely-recognized biographical reference work on leading American scientists, containing approximately 120,000 listings. It has long been used in other research on scientific opinion [18,19] though by definition it includes only a selection of all working scientists in any field. The 2007 sample was a random sample drawn equally from AMS and AGU members on the AMWS frame.
Screening in both surveys excluded students and non-science professionals such as television weathercasters. In both surveys, postcollection processing weighted responses to account for increased chance of selection for those with dual memberships. Margins of sampling error for population proportions were 3%–5% in 1991 and 4.4% in 2007 at the 95% confidence level.
A good deal of the sampling method was shared between the two surveys, helping to make results directly comparable over time. As the forgoing discussion makes clear, however, several differences in sampling method should be noted. Most significantly, the 2007 sample was drawn from within the AMWS listings, representing only the most distinguished members of the AMS and AGU, while the 1991 sample was drawn from all qualified AMS and AGU members. There was also a mode difference between the surveys, with phone contact used in 1991 and mailings in 2007. Each interview method is known to introduce different biases in response category choice among survey takers, withfor example-those responding to written surveys more likely to choose the first response choice and those responding to phone surveys more likely to select the last response choice [20].
Measures
Item wordings were identical on both surveys for the questions examined in this study. A range of items tapped the scientists’ assessments of climate change science across a variety of domains. The full wording for all items analyzed in this study is included along with the survey results in Tables 1-3. The surveys also contained demographic items and questions about media coverage of climate change and evaluations of communication efforts by interested groups.
| Q5: INCREASE: “Do you think global average temperatures have increased during the past 100 years?” | ||||
| Yes | No | DK/Missing | ||
| 2007 | 97 | 01 | 03 | |
| 1991 | 60 | 15 | 25 | |
| Yule’s Q (yes v. no) .96, (Don’t Know vs. all other) .83 | ||||
| Q6: HUMAN (Asked of those answered yes to Q5): “In your opinion is the warming measured over the past 100 years within the range of natural, not human-induced, fluctuations?” | ||||
| Yes | No | DK/Missing | ||
| 2007 | 30 | 54 | 16 | |
| 1991 | 49 | 31 | 20 | |
| Yule’s Q (natural v. not natural) .50, (Don’t Know vs. all other) .14 | ||||
| Q7: WARMING: “In your opinion is human-induced greenhouse warming now occurring?” | ||||
| Yes | No | DK/Missing | ||
| 2007 | 84 | 5 | 12 | |
| 1991 | 66 | 10 | 24 | |
| Yule’s Q (yes v. no) .40, (Don’t Know vs. all other) .40 | ||||
| Q9: TEMP “What do you think is the percent probability of human-induced global warming raising global average temperatures by two degrees Celsius or more during the next 50 to 100 years?” | ||||
| 0-49% | 50-100% | DK/Missing | Mean | |
| 2007 | 19 | 56 | 26 | 63 |
| 1991 | 37 | 47 | 16 | 46 |
| Yule’s Q (Below 50 v. 50 or higher) .40, (Don’t Know vs. all other) .29 | ||||
Table 1: Scientists’ Assessments of Principle Conclusions in Climate Change Science.
| Q3: UNDERSTAND “In your opinion, how well does the scientific community understand global climate change?” Not well at all; Not too well; Fairly well; Very well. | |||||||||
| Very | Fairly | Not Too | Not at All | DK/Missing | |||||
| 2007 | 23 | 55 | 19 | 02 | 01 | ||||
| 1991 | 06 | 45 | 41 | 06 | 02 | ||||
| Yule’s Q (Very/Fairly v. Not Too/Not well) .55, (Don’t Know vs. all other) .34 | |||||||||
| Q4: STATUS “From a scientific standpoint, how would you describe the study of global climate change?” Emerging Science; Fairly Mature; Fully Mature. | |||||||||
| Fully | Fairly | Emerging | DK/Missing/Other | ||||||
| 2007 | 05 | 51 | 39 | 05 | |||||
| 1991 | <0.5 | 09 | 90 | 01 | |||||
| Yule’s Q (Fully/Fairly v. Emerging) .86, (Don’t Know vs. all other) .68 | |||||||||
| Q10: FUTURE EVIDENCE What do you think is the percent probability of obtaining clear or overwhelming evidence of the existence or absence of human-induced global warming during the next 10 to 20 years? | |||||||||
| 0-49% | 50-100% | DK/Missing | Mean | ||||||
| 2007 | 17 | 69 | 14 | 72 | |||||
| 1991 | 34 | 60 | 06 | 54 | |||||
| Yule’s Q (Below 50 v. 50 or higher) .37, (Don’t Know vs. all other) .44 | |||||||||
Table 2: Scientists’ Views of the State of the Field of Climate Change Science.
| Q11A. The role of the sun’s behavior? | ||||||||||||
| Great Deal | Some | Little* | DK/Missing | |||||||||
| 2007 | 46 | 38 | 13 | 03 | ||||||||
| 1991 | 26 | 46 | 24 | 04 | ||||||||
| Yule’s Q (Great Deal/Some v. Little) .38, (Don’t Know vs. all other) .15 | ||||||||||||
| Q11B. The size and extent of the planet’s biomass? | ||||||||||||
| Great Deal | Some | Little* | DK/Missing | |||||||||
| 2007 | 26 | 54 | 12 | 08 | ||||||||
| 1991 | 21 | 52 | 22 | 05 | ||||||||
| Yule’s Q (Great Deal/Some v. Little) .33, (Don’t Know vs. all other) .25 | ||||||||||||
| Q11C. Archeological climate evidence? | ||||||||||||
| Great Deal | Some | Little* | DK/Missing | |||||||||
| 2007 | 32 | 50 | 14 | 04 | ||||||||
| 1991 | 20 | 56 | 20 | 04 | ||||||||
| Yule’s Q (Great Deal/Some v. Little) .26, (Don’t Know vs. all other) .00 | ||||||||||||
| Q11D. Natural sources and sinks for greenhouse gases? | ||||||||||||
| Great Deal | Some | Little* | DK/Missing | |||||||||
| 2007 | 23 | 56 | 18 | 03 | ||||||||
| 1991 | 13 | 52 | 33 | 02 | ||||||||
| Yule’s Q (Great Deal/Some v. Little) .37, (Don’t Know vs. all other) .20 | ||||||||||||
| Q11E. The impact of volcanoes? | ||||||||||||
| Great Deal | Some | Little* | DK/Missing | |||||||||
| 2007 | 41 | 43 | 12 | 04 | ||||||||
| 1991 | 22 | 57 | 20 | 01 | ||||||||
| Yule’s Q (Great Deal/Some v. Little) .29, (Don’t Know vs. all other) .61 | ||||||||||||
| Q11F. The role of positive and negative feedback? (that is, methane breakdown, cloud formation or accelerated methane releases) | ||||||||||||
| Great Deal | Some | Little* | DK/Missing | |||||||||
| 2007 | 08 | 51 | 35 | 07 | ||||||||
| 1991 | 05 | 42 | 48 | 05 | ||||||||
| Yule’s Q (Great Deal/Some v. Little) .28, (Don’t Know vs. all other) .17 | ||||||||||||
| Q11G. The size and extent of anthropogenic sources of greenhouse gases? | ||||||||||||
| Great Deal | Some | Little* | DK/Missing | |||||||||
| 2007 | 29 | 49 | 17 | 04 | ||||||||
| 1991 | 22 | 54 | 22 | 02 | ||||||||
| Yule’s Q (Great Deal/Some v. Little) .12, (Don’t Know vs. all other) .35 | ||||||||||||
Table 3: Scientists’ Confidence in Understanding of Specific Factors in Climate Change Science. Q11. “How much confidence do you have in the scientific community’s understanding of each of the following factors that affect our understanding of global climate?” (Response options: great deal of confidence; some confidence; only a little certainty, don’t know).
The questions provided ordinal responses along a continuum of confidence and certainty. Some questions asked explicitly, “How much confidence do you have in…” (With answer choices: Great deal; some; little), while others tapped the confidence continuum with different wording, such as “In your opinion, how well does the scientific community understand global climate change?” (With answer choices: Very well; fairly well; Not too well: Not well at all).
Familiarity with the subject matter in a question was operationalized in this survey context by the number of “Don’t know” (or missing) responses. A decrease in the proportion of “Don’t Know” responses should indicate that scientists feel more familiar with the technical subject matter in a question and able to provide substantive answers indicating their assessments of the question.
Analytical strategy
The nature of the extant data from the 1991 survey presents one considerable limitation. Despite considerable effort expended by the authors to locate the full original dataset, Gallup had only retained a summary report document of the survey results. That report contains topline results for each question and cross tabulations for select questions. The lack of a full dataset or correlation matrix for the 1991 survey severely limited available statistical techniques for comparing results.
Therefore, this study employed a scaled odds ratio statistic, Yule’s Q [11], to assess changes in the distribution of responses to survey questions between 1991 and 2007. As implemented, Yule’s Q serves as an indicator of the strength of the differences between the 1991 and 2007 response distributions, with a larger value of Q representing greater dissimilarity. Yule’s Q is a scaled version of the odds ratio, such that it can take on values from zero to one. The odds of a given response or set or responses (vs. another response or set of responses) are calculated within each year’s data. The odds ratio is then the ratio of these two sets of odds. Yule’s Q scales the odds ratio (OR) according to the following formula: Q = |(OR-1)/(OR+1)|. Note that Q values in this study present the absolute value of Q and thus do not indicate the direction of change.
A value of 1 would represent a total shift in responses over time, from the entirety of the sample responding with one response in 1991 to the entire 2007 sample responding with another answer category. A Q value of zero would indicate perfect similarity. Between these extremes, a rough interpretive guideline would suggest that 0.7 would represent a very strong change, 0.5 a strong change, 0.3 moderate change, and 0.1 a weak change. Q is a nonparametric test and not sensitive to absolute changes in the percentage distributions between the response categories across the two surveys. Rather, Q indicates the degree of dissimilarity between the proportional distributions of responses across the two surveys. Thus the value of Q is not a linear index of the degree of similarity in the data. When the data are already highly dissimilar, even large further increases in dissimilarity will result in only modest changes in the value of Q. Conversely, Q does not account for observed variance or sampling error, and in cases when percentage values are small, Q can indicate a strong over-time shift when that shift is still within the margin of error. Caution is needed when interpreting Q in such cases.
Comparisons of results from the 1991 and 2007 surveys are presented in Tables 1-3 and Figure 1. They contain the distributions of responses to questions tapping assessments of the principal conclusions of climate change science (Table 1), the state of the field (Table 2), and confidence in specific factors that contribute to scientific understanding of climate change (Table 3). Figure 1 displays aggregate results for each of these three categories of questions.
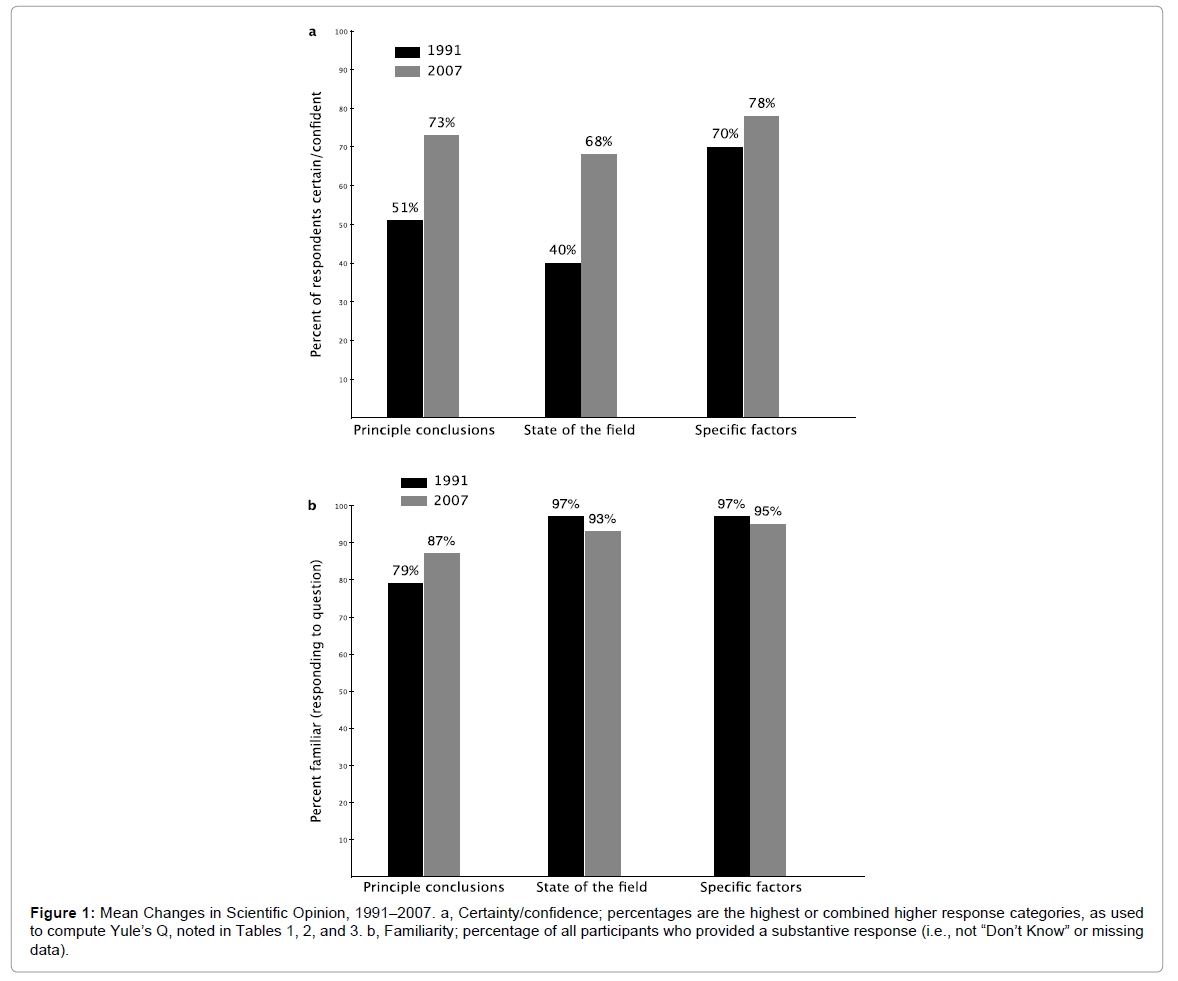
Figure 1: Mean Changes in Scientific Opinion, 1991–2007. a, Certainty/confidence; percentages are the highest or combined higher response categories, as used to compute Yule’s Q, noted in Tables 1, 2, and 3. b, Familiarity; percentage of all participants who provided a substantive response (i.e., not “Don’t Know” or missing data).
For each survey question, two comparisons between 1991 and 2007 were analyzed with Yule’s Q. The first comparison examined the pattern of substantive responses. Depending on the question, these responses assessed confidence in science’s understanding of climate change or certainty about climate change phenomena or predictions. For instance, the percentage of scientists responding that the overall state of the science was “Fully Mature” or “Fairly Mature” relative to those answering “Emerging” was compared between 1991 and 2007.
The second comparison for each question analyzed the strength of the change over time in the percentage of scientists who failed to answer (item nonresponse) or who responded “Don’t Know”. While often excluded from polling results, such survey behavior may reflect variables of considerable interest, such as respondents’ ambivalence or self-assessed lack of knowledge. Absent a means to evaluate the motivations behind this behavior in the data examined here, this study has chosen to label the percentage of substantive response (i.e., all answers excluding item non-response and “Don’t Know” answers) to a given question as the level of “familiarity” that scientists in the survey collectively expressed towards the scientific subject matter in the question.
To facilitate interpretation of trends across survey questions, aggregate results are presented in Figure 1. Responses to all questions in a subject area category (principal conclusions, state of the field, and specific factors) were averaged. Certainty/confidence percentages are of scientists answering with the response(s) options representing greater certainty in climate change phenomena or confidence in climate change science-the same splits used to calculate Yule’s Q in Tables 1-3. Familiarity percentages represent all substantive answers (versus “Don’t Know” or missing responses).
Results confirm across the board increases in certainty and confidence in the science of anthropogenic warming between 1991 and 2007. On every question, scientists’ certainty or confidence increased, from the principal conclusions that anthropogenic warming is occurring to the more technical issues involved in climate science.
There has been a 37 percentage point growth in those believing that temperatures have increased in the past 100 years (from 60% to 97%, with those believing that it has not dropping from 15% to only 1%) (Q=0.96). The proportion of scientists believing that anthropogenic warming is now occurring has increased 18 percentage points, from 66% to 84% (and a drop from 10% to 5% of those disagreeing) (Q=0.40). These results indicate that scientific opinion has moved from a strong majority view in favor of these conclusions in 1991 to virtual unanimity in 2007 on the existence of warming and an overwhelming majority on human causation.
Concomitant with the increase in agreement on those two key conclusions of climate change science was substantial growth in scientists’ familiarity with the topics, as measured by gains in the number of scientists who were willing to venture a response. These two questions presented a stark “Yes/No” choice to simplistic wording lacking in caveats and qualifications. It is understandable that many scientists may not have wished to select either option due to a desire to refrain from oversimplifying their views. Reflecting this, the number of scientists answering “Don’t Know” or leaving the question blank was relatively large in 1991, comprising a quarter of the sample (25% on the existence of past warming and 24% on human causation). Yet, these numbers had declined substantially by 2007 (3% for past warming [Q=0.83] and 12% for human causation [Q=0.40]). This is indicative of a crystallization of opinion. It also suggests that over this 16-year period, more than half of the growth in support for these two conclusions has come from those who previously were not willing to venture an answer.
Two additional items tapped scientists’ assessments of the principal conclusions of climate science with more nuance. These results also indicate substantial gains. The proportion of scientists agreeing that the past 100 years of warming exceeded the range of natural fluctuation increased 23 percentage points, from 31% to 54% while those seeing it within the natural range fell (49% to 30%) (Q=0.40). The mean of the scientists’ predictions for the likelihood of a 2°C increase in average temperature in the next 100 years rose from 46% to 63% (with Q=0.40 for the shift in the number of those responding with estimates of less than 50% vs. more than 50%). Despite this growth, a mean likelihood estimate of 63% in 2007 may be seen as lower than expected (and almost equal to that of a survey [3] of scientists conducted in 1990-though that study used a different sample and possibly different question wording). Note, however, that the question wording did not specify a “business as usual” scenario assumption, as is often stipulated when making such predictions. This omission may have led some respondents to assume the effect of mitigation efforts in offering their estimate, with the effect of depressing the likelihood that the 2°C threshold would be reached.
Familiarity with these two items displayed novel behavior, beginning fairly low in 1991 but failing to gain ground by 2007. Compared to the two key questions discussed first, the increase in familiarity when scientists were asked if warming was occurring within the natural range of fluctuation was small, with those not providing a substantive response falling from 20% to 16% (Q=0.14), a change within the margin of error for the surveys. Familiarity actually decreased over time for assessments of the probability of a 2°C rise in the next 100 years, with those not providing an answer rising from 16% to 26% (Q=0.29). These two items demanded more detailed assessments of climate science, including predictions about future trends. It is thus understandable that they would continue to generate a fair amount of hesitancy among scientists. Yet, the substantive decline in willingness to estimate the likelihood of future warming stands in contrast both to an increase in the likelihood estimates among those who did venture an opinion, as well as the general trend of increased certainty and familiarity exhibited across the other principal conclusion items. As noted above, this could be due to the failure to specify assumptions about future human activity (e.g., “business as usual”) in the question wording, coupled with scientists’ greater sensitization by 2007 to the importance of such assumptions in making warming predictions.
The modest consensus on the “natural range” question and its persistent low familiarity could also have to do with the question’s wording and failure to specify over what period of time the “natural range” of temperature fluctuations out to be considered. While, for instance, average temperature in the Northern Hemisphere between 1950 and 2000 was likely the highest it had been in the prior 1300 years [12], throughout its entire four billion year history the earth has seen higher absolute temperatures [13]. Thus, the proportion of respondents indicating that recent warming has not been within the natural range likely underestimates the numbers of scientists who see a human signal in recent warming data and continued low familiarity with the question may be indicative of its ambiguous wording rather than an enduring feature of scientific opinion. This question was also only asked of those who answered “Yes” to the prior question asking if there had been warming in the past 100 years, and changes in the composition of this group may have influenced responses.
Overall, certainty in anthropogenic warming increased substantially and across all four items related to the principal conclusions of climate change science. Taken together, scientists’ certainty about these principal conclusions raised an average of 22 percentage points, from 51% to 73%. Notably, however, expectations about future warming remained somewhat mixed in 2007. Even after experiencing sizable growth since 1991, scientists in 2007 on average believed there to be only a 63% chance that global temperature increases would exceed 2°C in the next 100 years. On the other hand, while over a third (37%) of scientists had given this possibility less than even odds in 1991, less than one in five (19%) did so by 2007. A strong majority of scientists thus believe it is more likely than not that significant warming will occur by the beginning of the next century.
Table 2 indicates that confidence in the state of the field in general also substantially increased. Assessment of how well the scientific community understood climate change shifted after 1991, when the sample was split roughly in half between those who answered “Not well at all” (6%) or “Not too well” (41%) and those who answered “Fairly well” (45%) or “Very well” (6%). By 2007, the balance had shifted (Q=.55) to a nearly four-to-one ratio with the vast majority of scientists either checking “Very well” (23%) or “Fairly well” (55%). When asked to rate the maturity of climate change science, fewer than 10% described climate change science as “Fully” or “Fairly mature” in 1991, but 56% did so in 2007, with those calling it “Emerging” dropping dramatically, from 90% to 39% (Q = 0.86). Respondents were also asked for their assessments of the likelihood of obtaining definitive evidence regarding anthropogenic warming in the next 20 years. The mean likelihood estimate stood at 54% in 1991 and rose to 72% 16 years later.
Familiarity with these “state of the field” questions was considerably higher than among questions dealing with the principal conclusions of climate science. Trivial numbers of respondents did not answer the items tapping views on the scientific community’s understanding and the field’s maturity, in both 1991 and 2007. A notable exception was a decrease in familiarity with predicting the arrival of conclusive evidence for anthropogenic warming. In 1991, 6% did not answer this item, rising to 14% in 2007 (Q=0.44).
Scientists’ confidence in the scientific community’s understanding of the specific factors that contribute to scientific knowledge of climate change increased more modestly over the 16 years than the other survey topics discussed above. Respondents rated that understanding across seven factors, from “the role of the sun’s behavior” to “the impact of volcanoes”. Across these factors, responses followed a common pattern of change from 1991 to 2007. The middle response category, “Some”, held relatively constant with approximately half of respondents, with modest declines in the proportion of those answering “Little” and growth in those answering a “Great Deal”. Confidence in the understanding of the sun’s behavior and the impact of volcanoes saw more decided shifts to “Great Deal.” Notably, confidence in understanding the role of feedback loops exhibited little shift into “Great Deal” responses, with that response category remaining essentially the same over time (5% to 8%). Shifts did occur from “Little” to “Some”, indicating that scientists have greater confidence in this area of study, but with a consensus that it still is not yet well understood.
Familiarity with the questions on specific factors remained largely unchanged, staying consistently high. The shifts in “Don’t Know” responses were almost all very small, and at or within the margins of error for the two surveys: 1991–2007 differences in “Don’t Know” or missing responses ranged from 0-4%. These results clearly indicate that overall, climate scientists experienced little or no change in their willingness to venture an opinion on the state of these specific climate science factors. Given the high levels of familiarity in 1991, this lack of change can be understood as the result of a ceiling effect.
These data indicate that scientific opinion has moved decisively towards a consensus on the existence of anthropogenic warming and greater certainty in the underlying science, along with greater familiarity with these topics. Belief in anthropogenic warming and confidence in climate science and its conclusions increased across the board. What were pluralities in 1991 became stronger majorities by 2007, with virtual unanimity reached on the question of prior warming-fully 97% of surveyed scientists in 2007 agreed that warming has occurred, up from 60% in 1991-and an overwhelming majority believing in anthropogenic warming. Familiarity with the principal conclusions of climate science (as measured by willingness to offer a substantive answer) also increased. Confidence that 2°C of warming would occur in the next 100 years also increased, but so did the number of scientists not providing an estimate, possibly indicating greater sophistication on the part of scientists and thus more hesitancy in making predictions without assumptions clearly specified.
The results presented in this paper indicate changes in scientific opinion in line with those observed in the IPCC scientific consensus reports over the 1991-2007 period and with over-time estimates that could be made from other surveys of scientists. The ability to compare data from questions with identical wording and similar sampling allows greater precision and detail in such overtime analysis. For example, it is possible not only to track the increasing consensus on questions such as belief in warming, but also to drill down into more nuanced topics, such as the growth in confidence among scientists that they know something about the role of feedback loops, but continued hesitation that they understand them “a great deal.”
Examining these longitudinal data provides clear evidence against speculation of any “agenda” or “group think” among the climate science community that might suggest that scientists rushed to conclusions on climate change several decades ago and have since been under the influence of confirmation bias or engaged in willful misrepresentation to maintain a consistent set of conclusions. On the contrary, it is plain that in 1991 considerable uncertainty and disagreement existed among scientists. With the passage of time and additional research, a clear consensus has emerged-precisely the path that scientific progress is expected to take.
