Research Article - (2023) Volume 11, Issue 3
Rainfall is the most significant element of weather and climate that directly affects agriculture, water resources, and more importantly, the socioeconomic situation of the society. Rainfall is a prime input for various engineering design such as hydraulic structures, bridges and culverts, canals, storm water sewer and road drainage system. The impacts of climate change and climate variability on human life have led the scientific community to monitor the behavior of weather and climate variables. Rainfall as one of the most important of these variables has a direct and indirect impact on the natural environment and human life. A large spatial and temporal variability of rainfall leads to an increased incidence of extreme events such as floods and droughts. The detailed statistical analysis of each region is essential to estimate the relevant input value for design and analysis of engineering structures and also for crop planning. This paper has examined the annual and seasonal rainfall variability and trends in the Metekele zone mandura, Bullen, Pawe, Wombera, Guba, Dangur and Dibate weredas, North Western Ethiopia.
The rainfall variability and trends over Metekele zone investigated using gauge as well as gridded rainfall data from 1989 to 2014. The variability of rainfall in both annual and seasonal was evaluated using Coefficient of Variation (CV), standardized rainfall anomaly. Monthly rainfall data were obtained from the Ethiopia Meteorological Institute (EMI) of Ethiopia. Following data quality checking and inspection, the monthly rainfall data of the selected stations were arranged in Microsoft excel spread sheet and analyzed using XLSTAT software. Mean, standard deviation, coefficient of variation, Sen’s Slope Estimator (SEE) and the Mann Kendall (MK) non-parametric statistical test was applied to study trends and variability of rainfall in Metekele zone. To assess the spatial extent of rainfall in the study area, trend time series values of each meteorological station have been interpolated by Inverse Distance Weighted (IDW) method using the spatial analyst tool of ArcGIS. The IDW method gives better representation for interpolation of rainfall distribution. The Inverse Weighting Distance (IDW) interpolation technique was employed to generate surface data and produce spatial rainfall maps.
Metekele zone • Mann-Kendall test • Rainfall variability • Sen’s slope estimator • Trend
Rainfall variability has historically been a major cause of food insecurity and famines in Ethiopia. Obtaining scientific evidence regarding the annual and seasonal rainfall variability through statistical rainfall analysis and farmers perceptions about rainfall variability in the region provides credible information to decision makers and end users. Rainfall is one of the most important climate elements for agricultural production throughout the world [1]. Rainfall is the meteorological phenomenon that has the greatest impact on human activities and the most important environmental factor limiting the development of the semiarid regions [2]. Understanding rainfall variability is essential to optimally manage the scarce water resources that are under continuous stress due to the increasing water demands, increase in population, and the economic development [3]. It is also the most important climate element for rain fed agriculture and the general socio-economic development of Ethiopia [4]. Rainfall variability affects water resources sustainability which includes the availability, management, and utilization of water resources. This, in turn, may affect ecosystems, land productivity, agriculture, food security, water quantity and human health [5].
When the uneven distribution of rainfall results in a mismatch between water availability and demand, irrigation structures are required to redistribute water concerning the requirements of a specific region [6]. Hence, for ecosystem resilience and sustainable agricultural activities, accurate estimation of the spatial and temporal distribution of rainfall is crucial, particularly for rain-fed agriculture [7]. Various trend analysis of rainfall at different spatial (e.g., regional and national) and temporal (e.g., annual, seasonal, and monthly) scales have been studied which indicated changes in the spatial and temporal variability and trends. For example, according to Gamachu rainfall in Ethiopia has shown large variations across time and space, due to the complex topography and varying latitude of the country [8,9]. Temporally, it varies from days to decades, with the magnitude and direction of historic rainfall trends varying from region to region and season to season [10,11].
Every minor change in the rainfall intensity or amount imposes a severe challenge on the rural people since their main livelihood depends on agriculture which mostly relies on a short rainy season. Various studies have indicated changes in the spatial and temporal variability and trends of rainfall pattern due to climate change and climate variability at different spatial (e.g., regional and national) and temporal (e.g., annual, seasonal, and monthly) scales in Ethiopia. For example, a study by Worku indicates that flooding is a familiar event in the upper Blue Nile basin and did cause a lot of destruction in the past years [12]. Bewket and Conway have discussed about the decline of annual rainfall in the North- Western parts of Ethiopia, while there was no clear trend of annual rainfall in other parts during their observation time [13]. Osman and Sauerborn also determined that summer rainfall, locally called Kiremt rainfall, in the central highlands of Ethiopia declined in the second half of the 20th century [14]. Therefore, monitoring and quantifying the background trends of rainfall in the country as a whole and its sections is of vital importance.
Climate variability and change cause a wide range of adverse impacts, particularly in developing countries. Eastern Africa faced serious challenges recently because of frequent drought and excessive rainfall events. Unpredictable rainfall amount and distribution behavior has become a bottleneck for agricultural and livestock production [15]. Detailed analysis and quantifying the spatial distribution of rainfall are required in water resource management, climate change studies and similar applications [16]. Rainfall varies significantly in Ethiopia at both temporal and spatial scales. Most of the areas (more than 70%) in the country receive rainfall during the Kiremt season which extends from mid- June to mid-September.
mid-June to mid-September. Hence, the current study is confined to a Metekel zone area in north western Ethiopia where rainfall is a determining factor impacting other systems including rain-fed farming and pastoralism. Therefore, it is intended to analyze the variability and long-term trends (1989-2014) of rainfall in the region. The study result could be useful to the policymakers to devise, implement better water management strategies and identifying possible present and future production strategies [17].
Description of the study area
The study was conducted in Metekel zone. It is the largest zone of Benishangul Gumuz regional State, North-Western of Ethiopia. It covers an area of 3,387,817 hectares consisting of seven districts: Bullen, Guba, Pawe, Mandura, Dibate, Wombera, and Dangur, Woredas. The grand Ethiopian renaissance dam is located in Guba woreda of Benishangul-Gumuz national regional state Metekel zone in Western Ethiopia, approximately 811 kilometers from Addis Ababa [18]. Based on the 2007 Census conducted by the Central Statistical Agency of Ethiopia (CSA), this zone has a total population of 276,367, of whom 139,119 are men and 137,248 women. 37,615 or 13.61% of population are urban inhabitants. A total of 58,515 households were counted in this zone, which results in an average of 4.72 persons to a household, and 56,734 housing units. The annual rainfall of the area is 612.4 mm-1637.8 mm and the topography of the zone has varying altitudes from 600 m.a.s.l-2800 m.a.s.l. About 80% of the study area is characterized by a sub-humid and humid tropical climate. The surrounding of Metekel Zone has a wide climatic range within hot to warm moist lowlands and hot to warm sub humid lowlands agro ecological zones. The administrative center of Metekel zone is Gilgil Beles. The highest point is Mount Belaya (3,131 meters), which is part of the Dangur range. The study area is bordered on the south and southwest by Kamashi, on the west by Sudan, and on the north and east by the Amhara region. The Abay River defines the zone's boundaries with Kamashi, while the Dinder river defines part of its boundary with the Amhara region (Figure 1) [19].

Figure 1: Location map of the Metekele zone (study area).
Data types and sources
The rainfall data were collected from the Ethiopia Meteorological Institute (EMI). Very good quality of gauge or station as well as gridded daily long rainfall data records was obtained for 7 stations, with a reasonably good geographic distribution to cover the study area. Therefore, these data were summarized into seasonal and annual means and then used to analyze the variability and trends of rainfall over the study area.
Trend and statistical analysis
Homogeneity test of the data: To detect homogeneity in the time series data, we employed the Pettit test in this study. This method was adopted to detect shifts in the average and calculate their significance in a test. The null Hypothesis (H0) in this case is the data that are homogenous; whereas the alternative Hypothesis (H1) is that there is a datum at which there is a change in the data. When the computed P-value is lower than the significance level α<0.05, the null hypothesis should be rejected. The P-value for all stations was computed using XLSTAT at a 5% level of significance (Table 1) [20].
| Stations | Latitude (North) | Longitude (East) | Years of observation |
|---|---|---|---|
| Mandura | 11.05° | 36.29° | 1989-2014 |
| Pawe | 11.23° | 36.35° | 1989-2014 |
| Dibate | 10.74° | 36.24° | 1989-2014 |
| Wombera | 10.68° | 35.49° | 1989-2014 |
| Bullen | 10.68° | 36.12° | 1989-2014 |
| Dangur | 11.42 | 35.98 | 1989-2014 |
| Guba | 11.51 | 35.28 | 1989-2014 |
Table 1. Location of the meteorological stations and length of rainfall series.
Data quality control assessment
In climate data analysis, the big problem is missing of the observed daily data. The primary target of quality control is to identify and remove spurious data observations from the entire time series. However, in many sites in the Sub Saharan Africa there are no consistent data records, data may exist for short periods, with long periods of missing data. The missing data were filled with gridded data. The gridded data are constructed data series based on records of gauge stations and satellite observations. This data is very useful because weather stations are limited in number and unevenly distributed and have sometimes a short period of observations. The data series was also examined for homogeneity and no heterogeneity was detected.
Methods of data analysis
In this study, I employed INSTAT, XLSTAT, and MS Excel spreadsheet tools to analyses my data set. Graphs were mapped using ArcGIS software. Both descriptive and Mann-Kendall trend test were computed in data analysis. Hence, using descriptive statistical techniques such as mean, standard deviation, variance and coefficient of variation were computed and the Coefficient of Variation (CV) was computed as the ratio of Standard Deviation (SD) to the mean in a given time series as used by Ademe, et al., to quantify the extent of variability, which is expressed as a percentage. The CV values are classified as follows: If CV<20% it is low variability, if 20%<CV<30%, it is moderately variability, if CV>30%, it is strong variability.
Where us using Mann-Kendall trend test such as Mann-Kendall Stat(S), Kendall’s tau and P-value were computed to detect the trends. In general, the non-parametric Mann-Kendall test was used to assess the presence of significant trends in precipitation data. The Mann-Kendall statistic S of the series x is given by test.
The Mann-Kendall Test is used to determine whether a time series has a monotonic upward or downward trend. It does not require that the data be normally distributed or linear. It does require that there is no autocorrelation. The null hypothesis for this test is that there is no trend, and the alternative hypothesis is that there is a trend in the two sided test or that there is an upward trend (or downward trend) in the one sided test. For the time series x1... xn, the MK test uses the following statistic:
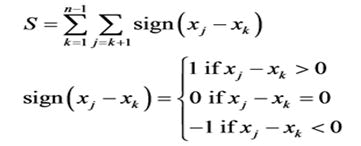
Where sign (Yj-Yi) is equal to +1, 0 or -1. When the magnitude of the S is large positive number, the later measured values tend to be larger than earlier one, and an upward trend is indicated. Whereas, when the S is large negative number, the later measured values tend to be smaller than the earlier ones and the trend will be a downward one. Note that if S>0 then later observations in the time series tend to be larger than those that appear earlier in the time series, while the reverse is true if S<0. A positive value of S indicates upward trend or increasing trends while a negative value of S indicates downward trend or decreasing trends.
The variance of S is given by
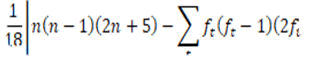
Where t varies over the set of tied ranks and ft is the number of times (i.e. frequency) that the rank t appears.
The MK test uses the following test statistic:
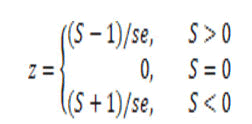
Where se=the square root of var. If there is no monotonic trend (the null hypothesis), then for time series with more than 10 elements, z∼N (0, 1), i.e. z has a standard normal distribution. The trend is said to be decreasing if Z is negative and the absolute value is greater than the level of significance, while it is increasing if Z is positive and greater than the level of significance. If the absolute value of Z is less than the level of significance, there is no trend.
Sen’s slope estimator test
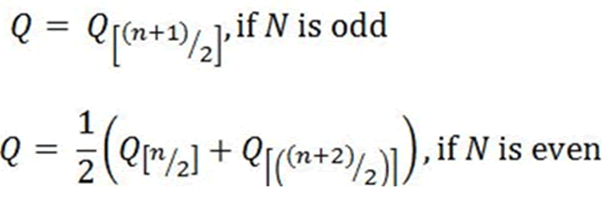
If a trend exists in a time series, then the true slope (change per unit time) can be estimated by using a simple non-parametric method developed by Sen. Sen’s slope is hence obtained using the following equation:
Ft=Qx+d
Where Q stands for the slope and d is a constant. It is necessary to calculate the slope for all data with the approach developed by Theil and Sen:
Q=(Xm-Xn)/m-n
Where Xm and Xn are considered as data values at time m and n (m.n), correspondingly.
Coefficient of variance test
I tried to capture rainfall variability on a temporal and spatial basis. Temporally, variability is seen at seasonal and annual scales. Descriptive statistics including mean, standard deviation and Coefficient of Variation (CV) were calculated in this study. The CV was calculated and the various degrees of variability were determined using a technique developed by Hare:

Where CV designates the coefficient of variation, while σ and μ represent the standard deviation and mean of the population, respectively.
Variability of rainfall was computed using Standardized Rainfall Anomaly (SRA) method. Standardized Rainfall Anomaly (SRA) was computed as the difference between the annual total of a particular year and the long term average rainfall records divided by the standard deviation of the long term data. This index is used to evaluate the inter annual fluctuations of rainfall in the study area over the period of observation, which is given as:
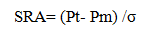
SRA is standardized rainfall anomaly; Pt is annual rainfall in year t; Pm is long term mean annual rainfall over a period of observation; σ is standard deviation of annual rainfall over the period of observation.
Inverse distance weighted technique
Inverse Distance Weighted (IDW) is a method of interpolation that estimates cell values by averaging the values of sample data points in the neighborhood of each processing cell.
he closer a point is to the center of the cell being estimated, the more influence, or weight; it has in the averaging process. The Inverse Distance Weighted (IDW) interpolation technique in ArcGIS was applied to generate surface data for rainfall from the stations at seasonal and annual scales. The IDW method assumes values of unknown points from the existing or observed ones based on the distance between them and assigning weights.
Unlike other interpolation methods, for instance, kriging, IDW is simpler and does not make explicit assumptions about the statistical properties of the input data. However, it is more suitable to be used with extensive input datasets. On the other hand, kriging interpolation uses the spatial correlation between sampled points to interpolate the values in the spatial field. Hence, its accuracy might be limited when the sampled observation is tiny and the data are limited in spatial scope. Therefore, the IDW interpolation method in the ArcGIS interface was used to generate and plot the spatial patterns of rainfall on a seasonal and annual basis. In addition to ArcGIS, R-package was employed for statistical and trend tests in this study.
Homogeneity test of the seasonal and annual rainfall
In this study, I performed Pettit’s test to detect homogeneity in the time series rainfall data on seasonal and annual basis for all the stations. The null hypothesis formulated was that the data are homogeneous while the alternative hypothesis was that there is a datum at which there is a change in the data. The empirical significance (P-value) was set at 5% level and the null hypothesis that signifies the presence of homogeneity in the time series rainfall data with an alpha value less than 0.05 should be rejected. Therefore, inhomogeneity was detected (Pvalue <0.05) at different stations as observed in Table 2.
| Timescale | Mandura | Bullen | Wombera | Dibate | Pawe | Dangur | Guba |
|---|---|---|---|---|---|---|---|
| Annual | 0.86 | 0.938 | 0.718 | 0.217 | 0.556 | 0.378 | 0.444 |
| Kiremt | 0.427 | 0.898 | 0.767 | 0.843 | 0.846 | 0.486 | 0.306 |
| Bega | 0.016 | 0.004 | 0 | 0.001 | 0.006 | 0.32 | 0.002 |
| Belg | 0 | 0.0001 | 0.016 | 0.009 | 0.005 | 0.021 | 0.0001 |
Note: P-values for significant change/non-homogeneity/are bold in the table.
Table 2. Pettit homogeneity test results.
Seasonal rainfall variability and trends
The study area is characterized by three distinct seasons with Belg (Frburary to May), Bega (October to January) and Kiremt (June to September) seasons. The seasonal rainfall pattern shows variability at various stations. The distribution of rainfall is highly variable at seasonal time scale where the CV value varies between 9.7% during Kiremt at the Wombera station and 75.4% during Bega at the Mandura station. According to the degree of variability of rainfall events is classified as less (CV<20%), moderate (20<C<V 30%) and high (CV>30%). For Kiremt, the mean CV was 11.3%; CV revealed high (CV=13%) and less (CV=9.9%) variability. The mean total rainfall amount for Belg and Bega were 127.3 millimeters and 102.8 millimeters; they varied from 96.4 mm-157.8 mm and 51.4-141.4 mm, respectively. Bega and Belg rainfall was extremely variable (CV>30%) for all stations. As compared to Kiremt season, the Belg and Bega rainfall was more variable. For example, CV for Belg was 43.5%; it ranged from 30.7%-51.9% and, CV of Kiremt and Annual rainfall is less than 20% for all stations which mean it have low varaiability. This agrees with the study by Woldeamlak and Conway. Based on Hare classification, North Shewa has been vulnerable to drought during Belg season (CV>30%). Generally, the seasonal variability was higher than the annual variability. Further the Standardized Rainfall Anomalies (SRA) were also calculated to assess the inter-annual rainfall fluctuations at the 7 stations. The SRA showed proportion of high negative anomalies ranged from 64% at Dibate and Dangur stations to the least 36% at Wombera and Guba stations of total number of observations during the period between 1984 and 2014 (Figure 6). The temporal analysis indicated that rainfall pattern in the study area exhibited a moderate inter annual variability over time. The standardize annual rainfall anomaly shows that at study area have moderate wet at Mandura, Wombera, Dibate, Dangur, Pawe and Guba and also the moderate dry at Mandura, Dibate, Dangur Bullen, Pawe. Severely wet at Mandura, Bullen, Pawe, Guba, Dangur. Extremely wet at Bullen and Dibate and no extremely dray is existing at study area from 1989 to 2014.
Trends of seasonal rainfall at the seven stations are presented in Table 3. The Mann-Kendall trend test was used to calculate the trends of mean annual rainfall totals and seasonal rainfall patterns in the study region. The Mann–Kendall test requires the time series data to be serially independent. The purpose of the Mann-Kendall (MK test is to statistically assess if there is a monotonic upward or downward trend of the variable of interest over time. A monotonic upward (downward) trend means that the variable consistently increases (decreases) through time, but the trend may or may not be linear. The MK test can be used in place of a parametric linear regression analysis, which can be used to test if the slope of the estimated linear regression line is different from zero. The regression analysis requires that the residuals from the fitted regression line be normally distributed; an assumption not required by the MK test, that is, the MK test is a non-parametric (distribution free) test (Table 3).
| Stations | ||||||||
| Seasons | Tests | Mandura | Bullen | Dibate | Wombera | Dangur | Guba | Pawe |
|---|---|---|---|---|---|---|---|---|
| Kiremt | MK stat | -52 | 33 | -61 | -7 | -35 | -35 | 7 |
| ZMK | -1.12 | 0.7 | -1.32 | -0.13 | -1.32 | 0.44 | 0.13 | |
| Kendall’s tau | -0.16 | 0.102 | -0.188 | -0.022 | 0.065 | -0.108 | 0.022 | |
| CV (%) | 12.8 | 10.6 | 13 | 9.7 | 12.7 | 10.6 | 9.9 | |
| P-value | 0.261 | 0.481 | 0.186 | 0.895 | 0.659 | 0.453 | 0.895 | |
| Slope | 0 | 0.097 | -0.136 | -0.009 | 0.034 | -0.051 | 0.022 | |
| Bega | MK stat | -166 | -169 | 171 | -201 | -143 | -149 | -157 |
| Z value | -3.64 | -3.7 | 3.74 | -4.4 | -3.13 | -3.26 | -3.43 | |
| Kendall’s tau | -0.515 | -0.52 | 0.526 | -0.618 | -0.44 | -0.46 | -0.483 | |
| CV (%) | 75.4 | 46 | 34.5 | 46 | 52.8 | 56.4 | 43.6 | |
| P-value | 0 | 0 | 0 | 0.0001 | 0.002 | 0.001 | 0.001 | |
| Slope | -0.103 | -0.208 | 0.174 | 0.182 | -0.072 | -0.1 | -0.158 | |
| Belg | MK stat | 178 | 195 | -150 | 170 | 177 | 196 | 187 |
| Z value | 3.9 | 4.3 | 4.09 | 3.72 | 3.78 | 4.29 | 4.09 | |
| Kendall’s tau | 0.55 | 0.6 | -0.462 | 0.524 | 0.545 | 0.604 | 0.575 | |
| CV (%) | 38.8 | 51.9 | 44.2 | 30.7 | 49.5 | 48.3 | 41.1 | |
| P-value | 0.0001 | 0.0001 | 0.001 | 0 | 0 | 0.0001 | 0.0001 | |
| Slope | 0.184 | 0.21 | -0.12 | 0.182 | 0.192 | 0.2 | 0.178 | |
Table 3. Seasonal rainfall test results and descriptive statistics (1989-2014).
If the p-value of the test is lower than some significance level (common choices are 0.10, 0.05, and 0.01), then there is statistically significant evidence that a trend is present in the time series data. The p-value (<0, 0001) shows that the null hypothesis is rejected thus we may suggest that there is a significant trend in our time series. A p-value greater than 0.05 means that deviation from the null hypothesis is not statistically significant, and the null hypothesis is not rejected. Then the study area have not statistical significant during Kiremt season at all stations and a trend is present in the time series data during Belg and Bega season at all stations and its statistical significant (Figure 2).

Figure 2: Mean seasonal amount of rainfall for each station from 1989 to 2014.
The highest amount of seasonal rainfall occurred during kiremt seasons at wombera with 1306.4 mm followed by Bullen (1257.8 mm) and Pawe (1071.7 mm). On the other hand, Guba (516.7 mm) is the least station with a mean of 612.4 mm during the same period. During Belg season 148.2 mm rainfall at Wombera and the least rainfall 20 mm at Giba station and During Bega 188.6 mm occurred at Pawe station and the least rainfall 75.7 mm at Guba stations stations from 1989 to 2014. The seasonal rainfall maps were produced through IDW interpolation techniques taking into account the rainfall averages from 1989 to 2014. Mean rainfall varies spatially during the different seasons across the study area. The all parts of Pawe station and centeral North West and South West of Wombera a station was received relatively the highest Belg rainfall. Belg rainfall decreases towards to the rest of Wombera, Dibate, Bullen, some parts of Mandura and east part of Dangur. On the other hand, Bega rainfall is not as strong as Belg in the study area but centeral, South of east and western parts of Wombera, Bullen and Dibate, southwest parts of pawe station is still relatively the wettest and the distribution decreases towards North east of Mandura, East of pawe, east of Dangur, North of Wombera, Bullen and Dibate stations. A western part of Guba station is relatively less wet at Bega. Moreover, little rainfall occurs during Bega season, not only in the study area but also across the entire country which is mainly attributed to a major factor, the seasonal migration of the Inter Tropical Convergence Zone (ITCZ) following the shifting of the overhead sun. ITCZ is a low pressure system where the northeast and southeast trade winds converge and develop along the equator due to the intense solar radiation absorbed in this particular region. This low pressure zone migrates north and south of the equator following the location of the overhead sun. Kiremt season, on the other hand, is one of the wettest periods in the study area. The central and western part of Wombera, east part of Bullen and its surrounding stations was received relatively the highest kiremt rainfall and its surroundings, Pawe station and its surroundings, received relatively fair distribution of kiremt rainfall and western part of Guba Stations was received relatively the smallest kiremt rainfall over the studied 1989-2014 years (Figure 3).

Figure 3: Spatial distribution of seasonal rainfall (1989-2014).
Annual rainfall variability and trends
To determine a common period to all rainfall stations, some missing data were calculated using linear interpolation method. Trend analysis of the research area has been done in this study with of rainfall data. Kendall’s tau and P-value has been used for determination of trend. Rainfall distribution also varies across the various stations in the Metekel zone. The highest amount of mean annual rainfall of 1637.8 mm is observed at the Wombera station followed by Bullen (1565.9 mm) and Pawe (1392.7 mm). On the other hand, Guba is the driest station with a mean of 612.4 mm during the same period from 1989 to 2014 (Figures 4 and 5). The central and western part of Wombera, east part of Bullen and its surrounding stations was received relatively the highest mean annual rainfall followed by rest of Wombera, Dibate Bullen and Pawe station and its surroundings, received relatively fair distribution of annual rainfall and western part of Guba Stations was received relatively the smallest annual rainfall over the studied 1989-2014 years.

Figure 4: Spatial distribution of mean annual rainfall (1989-2014).

Figure 5: Mean annual amount of rainfall for each station from 1989 to 2014.
The Mann–Kendall trend test showed that trends of annual rainfall over the study area decrease at Mandura, Dibate and Wombera stations, while increasing at Bullen, Dangur, Guba and Pawe stations. If the p-value of the test is lower than some significance level (common choices are 0.10, 0.05, and 0.01), then there is statistically significant evidence that a trend is present in the time series data. The p-value (<0.0001) shows that the null hypothesis is rejected thus we may suggest that there is a significant trend in our time series. A p-value greater than 0.05 means that deviation from the null hypothesis is not statistically significant, and the null hypothesis is not rejected. Then the study area mean annual rainfall is not statistically significant at all stations and a trend is present in the time series data during 1989 to 2014. According to the degree of variability of rainfall events is classified as less (CV<20%), moderate (20<C<V 30%) and high (CV>30%). The highest variation occurred at Dibate station with 13.5% and the lowest variation occurred at Wombera and Pawe with 11%. During annual rainfall the coefficient of variation is less than 20% at all stations, so the annual rainfall variation over the study area is less (CV<20%) over the study area during 1989 to 2014 (Table 4 and Figure 6).
| Stations | ||||||||
| Seasons | Tests | Mandura | Bullen | Dibate | Wombera | Dangur | Guba | Pawe |
|---|---|---|---|---|---|---|---|---|
| Annual | MK stat | -15 | 37 | -19 | -13 | 51 | 31 | 37 |
| ZMK | -0.308 | 0.79 | -0.39 | -0.13 | 1.1 | 0.66 | 0.79 | |
| Kendall’s tau | -0.046 | 0.114 | -0.058 | -0.04 | 0.157 | 0.096 | 0.114 | |
| CV (%) | 11.3 | 12.9 | 13.5 | 11 | 11.3 | 11.9 | 11 | |
| P-value | 0.758 | 0.427 | 0.692 | 0.791 | 0.27 | 0.508 | 0.427 | |
| Slope | -0.022 | 0.089 | -0.057 | -0.039 | 0.096 | 0.048 | 0.076 | |
Table 4. Mean annual rainfall descriptive statistics and test results (1989-2014).

Figure 6: Standardized annual rainfall anomalies Indices for all selected each seven station.
This paper has examined the trend analysis and rainfall variability at seasonal and annual Rainfall using data obtained from the Ethiopia Meteorological Institute (EMI) for 25 years is presented at Metekele Zone North Western of Ethiopia. The data used is a combination of gauge and gridded rainfall data which is believed to be more reliable than using lonely satellite rainfall data. Variation of rainfall in both time and space has a significant effect in the performance of agricultural productivity over agriculture heavily relies on seasonal rainfall. The Inverse Weighting Distance (IDW) interpolation technique was employed to generate surface data and produce spatial rainfall maps. Rainfall is highly variable on seasonal than annual timescale. The Mann-Kendall trend test showed that the trend increase at Bullen and Pawe during kiremt season. Bega only at Dibate stations have increasing trend. Except dibate the trend increase at all station is during Belg season. The trend decrease at Mandura, Dibate, Wombera, Dangur and Guba during kiremt season and during Bega season at all except Dibate and Belg decreasing only at Dibate station. During kiremt season the P-value is greater than the significant value which means it’s non-significant at all stations and also during Bega and Belg the Pvalue is less than the significant value which means its significant at all stations. The findings of this study can serve as a reference basis and provides useful information for policymakers to devise, implement better water management strategies and identifying possible present and future production strategies. However, the detected trends are non-significant.T he mean total rainfall amount for Belg and Bega were 127.3 millimeters and 102.8 millimeters; they varied from 96.4 mm-157.8 mm and 51.4 mm-141.4 mm, respectively. Bega and Belg rainfall was extremely variable (CV>30%) for all stations. As compared to Kiremt season, the Belg rainfall was more variable. Since, CV for Belg was 43.5%; it ranged from 30.7%-51.9% and, CV of Kiremt and annual rainfall is less than 20% for all stations which mean it have low varaiability. Generally, the seasonal variability was higher than the annual variability. Therefore, the concerned stakeholders should take into consideration the annual rainfall and Seasonal rainfall variability of the study area into their climate change adaptation strategy.
I would like to thanks Ethiopia meteorology institute Benishangul Gumuz branch office for providing all data for my study.
Citation: Leta T. "Seasonal and Annual Rainfall Variability and Trends in Metekele Zone North Western Ethiopia". J Climatol Weath Forecast, 2023, 11(3), 1-8.
Received: 20-Jan-2023, Manuscript No. JCWF-23-21492; Editor assigned: 23-Jan-2023, Pre QC No. JCWF-23-21492 (PQ); Reviewed: 06-Feb-2023, QC No. JCWF-23-21492; Revised: 18-Apr-2023, Manuscript No. JCWF-23-21492 (R); Published: 26-Apr-2023, DOI: 10.35248/2332-2594.23.11(3).1-8
Copyright: © 2023 Leta T. This is an open-access article distributed under the terms of the Creative Commons Attribution License, which permits unrestricted use, distribution, and reproduction in any medium, provided the original author and source are credited.
