Research Article - (2018) Volume 0, Issue 0
Objective: Nigerian agriculture is mainly rain-fed and highly dependent on weather especially rainfall. Therefore modeling of monthly rainfall in some selected stations in Nigeria was undertaken in this study.
Methodology: Data (rainfall) spanning a period of 30 years (1981-2010) for fourteen stations which were collected from the Nigerian Meteorological Agency (NIMET) were utilized. Autoregressive Integrated Moving Average (ARIMA) and Seasonal Autoregressive Integrated Moving Average (SARIMA) models were used. The accuracy and trend of time series was analyzed to give the monthly rainfall prediction for the succeeding year. The results showed that the model fitted into the data well and the stochastic seasonal fluctuation was successfully modeled. Rainfall was minimal in January, February, March and December over the selected stations in northern, Nigeria but increased progressively in strength and amount in the months of June, August and September over the stations in South west, and June and September over the stations in South -south, Nigeria. The highest rainfall of 230 mm was recorded in September over Warri and the lowest rainfall of 52 mm was recorded in August over Maiduguri. The rainfall recorded over the selected stations in South-south stations was visibly higher than what was recorded over the stations in the northern and the South-west stations. In northern Nigeria, the peak monthly mean rainfall amount of 91 mm was observed in August and rainfall amount was very low in January (0.0 mm), February (0.0 mm), March (0.0 mm) and December (0.0 mm). Over South-west, the Peak monthly mean rainfall amount of 215 mm was observed in June and September and rainfall amount was very low in January (0.0 mm) and December (0.0 mm). Over the stations in South-south, the Peak monthly mean rainfall amount of 325 mm was experienced on September and rainfall amount is very low in December (0.0 mm).
Conclusion: The study concluded that Seasonal Autoregressive Integrated Moving Average (SARIMA) model was a proper method for modeling and predicting the monthly rainfall. The results are useful for forecasting the pattern of rainfall in the study area and provide information that would be helpful for decision makers in formulating policies to mitigate the problems of water resources management, soil erosion, flooding and drought.
Keywords: Rainfall; ARIM; SARIMA; Selected stations
Several studies have been conducted in the analysis of pattern and distribution of rainfall in various regions of the world. Different time series methods with different objectives were employed to analyze rainfall data in various literatures. In terms of using a formal time series model to forecast, the patterns and intensity of rainfall overtime, Harvey et al. [1] investigated how patterns of rainfall correlate with general weather conditions and frequency of the cycles of rainfall in Brazil. They found that cyclical components are stochastic rather than deterministic, and the gains achieved from forecast by taking account of the cyclic component are small in the case. Mahsin et al. [2] used Box-Jenkins methodology [3] to build seasonal ARIMA model for monthly rainfall and temperature data taken for Bangladesh, for the period between1981-2010. In their work, ARIMA (0, 0, 1) (0, 1, 1)12 model was found adequate and the model is used for forecasting the monthly rainfall and temperature. Seyed et al. [4] use time series method to model weather parameter in Iran and recommended ARIMA(0,0,1)(1,1,1)12 as the best fit for monthly rainfall data and ARIMA(2,1,0)(2,1,0)12 for monthly average temperature for the region. Al-Ansari et al. [5] dealt with the statistical analysis of the rainfall measurements for three meteorological stations in Jordan: Amman Airport (central Jordan), Irbid (northern Jordan) and Mafraq (eastern Jordan). Normal statistical and power spectrum analyses as well as ARIMA model were performed on the long-term annual rainfall measurements at the three stations. The result shows that possible periodicities of the order of 2.3-3.45, 2.5-3.4 and 2.44-4.1 years for Amman, Irbid and Mafraq stations, respectively, were obtained. A time series model for each station was adjusted, processed, diagnostically checked and lastly an ARIMA model for each station is established with a 95% confidence interval and the model was used to forecast 5 years annual rainfall values for Amman, Irbid and Mafraq meteorological stations. Further result indicated that there is decreasing trend for forecasted rainfall results in all stations.
Winstanley [6] reported that monsoon rains from Africa to India decreased by more than 50% from 1957 to 1970 and predicted that the future monsoon seasonal rainfall, averaged over 5 to 10 years is likely to decrease to a minimum around 2030. Stringer reported that at least 35 quasi-periods with more than one year in length have been discovered in records of pressure, temperature, precipitation, and extreme weather conditions over many parts of the earth surface. A very common quasi-periodic oscillation is the quasi-biennial oscillation (QBO), in which the climatic events recur every 2 to 2.5 years. Laban [7] uses time series methods based on ARIMA and Spectral Analysis of areal annual rainfall of two homogenous region in East Africa and recommended ARMA (3,1) as the best fit for areal indices of relative wetness\dryness and dominant quasi-periodic fluctuation around 2.2-2.8 years, 3-3.7 years, 5-6 years and 10-13 years. Nicholson and Entekhabi [8] conducted a detailed power spectrum analysis of African annual rainfall series using Blackman-Tukey and Fourier methods. Their analysis revealed that quasi-periodicities were clustered in four bands at 2.2-2.4, 2.6-2.8, 3.3-3.8 and 5.0-6.3 years, common throughout equatorial and southern Africa but only weakly evident in northern Africa. Adejuwon [9] studied annual rainfall in Nigeria using power spectral analysis based on Benin, Sapele, Warri and Forcados Synoptic station in Edo and Delta States (formerly Mid- Western Nigeria) over 67 years and found that Benin synoptic station shows significant spectral peaks at 6.7, 4.6 and 3.7 years periodicities. The most pronounced peak at the station was found to be 3.7 years periodicity. In Sapele, the most pronounced periodicity of 5 years was observed. Although, the spectral peaks were significant at 4.6 and 3.7 years, respectively, at Warri, the most pronounced of these peaks was found to be 3.7 years. However, in the case of Forcados, a single significant spectral peak of 3.6 years cycle was prominent and it was then concluded that periodicities were evident with significant cycles of between 3 and 6 years. Borlando et al. [10] used ARIMA models to forecast hourly precipitation in the time of their fall and the amounts obtained were compared with the data to measure rain. They came to the conclusion that with increasing duration of rainfall, the predictions were more accurate, and shorter duration of rainfall, rain rate difference will be more than the actual corresponding value. Yusof and Kane [11] analyzed the precipitation forecast using SARIMA model in Golastan province and found the seasonality measure in SARIMA to be highly useful in measuring precipitation. Amha [12] studied the monthly rainfall and temperature in Northern region based on Bauchi station. He employed univariate Box-Jenkins method to analyze rainfall in the region and found that SARIMA model is suitable for forecasting future value of monthly rainfall and temperature data and used this model to forecast 12-month rainfall pattern in the study area. Further he concluded that there is no tendency of decreasing or increasing pattern of monthly rainfall and temperature over the forecast period from January 2010 to September 2011. Ogungbenro et al. [13] worked on Rainfall distribution and change detection across climatic zones in Nigeria. Statistical methods were utilized to justify any change in the average monthly and annual rainfall trend using probability density function and non-parametric tests such as the Pettitt test, Wilcoxon signed-rank test and paired sample test. Results show common change points and transitions from dry to wet (upward shift) in all climatic zones. Statistical tests performed on the data show that rainfall variation over each climatic zone is significant (p<0.05) between pairs of climate periods. Adeleke and Abiodun [14] worked on statistical analysis of rainfall trend in akure, ondo state, Nigeria. Descriptive statistics (mean and standard deviation) and inferential statistics (time series and correlation analysis) were in their analysis (Table 1). The results from time series analysis showed that rainfall fluctuated in an upward trend through the period of study. The predicted rainfall for 2016-2045 indicated a positive trend of (+0.274), meaning that rainfall will increase in intensity, number of raining-days and duration. The study equally revealed a significant increase in rainfall trend for Akure between 1966 and 2015. From the above, it is observed that, time series methods determine future trend based on past values and corresponding errors [15]. Since a time series method only require the historical data, it is widely used to develop predictive models. In Nigeria, it is clear that very few works have been done using more robust statistical methods; therefore this work seeks to model the pattern of rainfall for identifying the probability distribution. This will allow the assessments of extreme values for every time step during the observation period. Also, provides trend estimates taking into account the statistical characteristics of precipitation. The resulted rainfall amounts are intended to help farmers in making decision concerning their crops. It is possible to predict monthly rainfall amount with one month ahead with acceptably accuracy [16-21].
| S.No | Station | Latitude | Longitude | Altitude | Vegetation Types | Characteristics of Climatic Zone |
|---|---|---|---|---|---|---|
| 1 | Bauchi | 100 171N | 90 491E | 616m | Sudan Savannah and Sahel Savannah | Mean temperature - 300C Annual rainfall-500 mm with single peak in August.(Odugo,2011) |
| 2 | Maiduguri | 120 131N | 110 131E | 354m | ||
| 3 | Kano | 120 231N | 90 291E | 488 m | Sudan Savannah and Guinea Savannah | Mean temperature - 260C Annual rainfall- 850 mm with single peak in August. (Wang,1996) |
| 4 | Lokoja | 70 521N | 60 461E | 54 m | Guinea Savannah | Mean temperature - 23.40°C Annual rainfall- 1000 mm with single peak in September.(Harvey,1998) |
| 5 | Abuja | 90 251N | 70 391E | 252 m | ||
| 6 | Ibadan | 70 431N | 40 311E | 230 m | High Forest | Mean temperature - 21.3°C Annual rainfall -1200 mm with two peaks in June and September.(Mahsin,2012) |
| 7 | Ikeja | 60 351N | 30 201E | 40 m | ||
| 8 | Akure | 70 591N | 80 311E | 252 m | ||
| 9 | Warri | 50 311N | 50 451E | 18 m | Mangrove Swamp | Mean temperature-22.40C Annual rainfall-2000 mm with a peak in June or July (Adejuwon,2010) |
Table 1: Summary of the study areas (The Coordinate, Vegetation types and Characteristics of the Climatic Zone).
Study area
The study area comprise of selected stations in Nigeria (Bauchi, Maiduguri, Lokoja, Kano, Abuja, Ibadan, Ikeja, Akure, Warri and Port Harcourt) (Figure1).

Figure 1: Map of Nigeria showing the study areas.
Data collection
The data used for this study are monthly rainfall (mm). They were collected from Nigeria Meteorological Agency (NIMET), Oshodi, Lagos State and the data spanned between 1981 and 2010 (thirty years). The Stations are: Bauchi, Maiduguri, Lokoja, Kano, Abuja, Ibadan, Ikeja, Akure, Warri and Port Harcourt
Method of analysis
Multiplicative model: The multiplicative time series model is written as
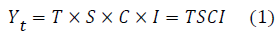
Where, Yt is value of the time series at time t, T is Trend secular value at time t
S is Seasonal value at time t, C is Cyclical value at time t, I is Irregular or random value at time t when cyclical variation is classified with the trend.
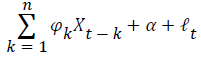
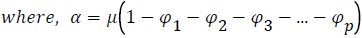
Autoregressive integrated moving average (ARIMA) model: ARIMA Model was used to estimate the rainfall pattern over the stations. ARIMA Model has four tentative models; (1 1 1)(1 0 1)12, (1 1 1)(0 0 1)12, (1 1 1)(1 0 0)12 and (0 1 1)(1 0 1)12. Akaike Information Criterion (AIC) and Schwarz Bayesian Information Criterion (BIC) [16] are used to determine the ARIMA Model best fit for the Prediction. AIC and BIC are determined based on a likelihood function. The Model with the lowest Sum of the Square Error (SSE) value of AIC and BIC is considered best for Prediction. An autoregressive model of order p, denoted by AR (p), is of the form
 (2)
(2)
Where, Xt is stationary random process/variable,  are parameters or constants
Unless otherwise stated, we assume that ℓt is a Gaussian white noise series with mean zero and variance  The mean of Xt is zero. If the mean, μ of Xt is not zero, then we replace Xt by
  which implies


 (3)
(3)
The order of an AR(p) process is determined by the partial autocorrelation function (PACF). An AR (p) process has its PACF cutting off after lag p and the ACF decays.
As an alternative to the autoregressive representation in which the term on the left-hand side of the equation are assumed to be combined linearly, the moving average model of order q, denoted by MA(q), assumes the white noise on the right-hand side of the defining equation are combined linearly to form the observed data. The moving average model of order q, denoted by MA (q) model, is defined as:
 (4)
(4)
Where there are q lags in the moving average and 
 are parameters. The noise ωt is assumed to be Gaussian white
Seasonal autoregressive integrated moving average (SARIMA) model: For multiplicative Seasonal Autoregressive Integrated Moving Average (SARIMA) model, we have the general notation (p, d, q), (P, D, Q) S where (p, d, q) is the non-seasonal part and (P, D, Q) S is the seasonal part with p, d, q having their usual meaning and P is the order of the seasonal AR process. D is the differencing of the seasonal process, Q is the order of seasonal MA process of the time series, and S is the order of seasonality. For the purpose of identifying a seasonal ARMA process, we divide the process into two parts. To identify the seasonal pattern, we ignore the non-seasonal process and determine whether the seasonality is determined by an AR or an MA process by focusing on the coefficients of the seasonal terms. Suppose that the non-seasonal part is an ARIMA (1, 0, 1) and the time series shows a yearly seasonal pattern, then the complete model becomes
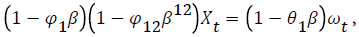 if seasonality is on the AR portion, and
 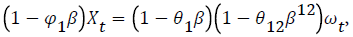 if seasonality is on the MA portion, where
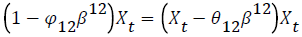
Identification of the ARIMA model: Two goodness-of fit statistics that are most commonly used for the model selection are; Akaike Information Criterion (AIC) and Schwarz Bayesian Information Criterion (BIC). The AIC and BIC are determined based on a likelihood function. The AIC and BIC are calculated using the formulas below:
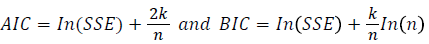
where n is the total number of observations, SSE is the sum of the squared errors, and 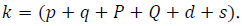
Mean absolute percentage error (MAPE): The Mean Absolute Percentage Error (MAPE) is defined mathematically by equation
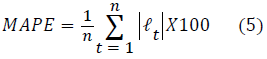
where  is the error term, n is the number of forecasting values, Xt is the actual observation for time period t and Ft is the forecast value for the same period.
Mean square error/ Mean square deviation (MSE/MSD): The Mean Square Error (MSE) is defined by equation (3.10)
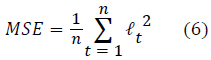
where is the error term, n is the number of forecasting values, Xt is the actual observation for time period t and Ft is the forecast value for the same period.
Mean absolute deviation (MAD): Symbolically, the Mean Absolute Deviation (MAD) is defined by equation (9)
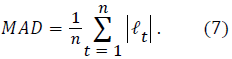
where is the error term, n is the number of forecasting values, Xt is the actual observation for time period t and Ft is the forecast value for the same period.
Time series plot of rainfall over northern stations (Bauchi, Maiduguri, Kano, Lokoja and Abuja)
Figures 2a-2e shows the time series plot of the monthly rainfall in Bauchi, Maiduguri, Kano, Lokoja and Abuja from January 1981 to December 2010. It was generally observed that rainfall amount increases across the days of the months with sharp increase in the month of July and August in Bauchi, August and September in Maiduguri, August and October in Kano while September and October in Lokoja and Abuja.

Figure 2a: Bauchi, rainfall from (1981-2010).

Figure 2b: Maiduguri, rainfall from (1981-2010).

Figure 2c: Kano, rainfall from (1981-2010).

Figure 2d: Lokoja, rainfall from (1981-2010).

Figure 2e: Abuja, rainfall from (1981-2010).
In Bauchi, monthly mean rainfall of observed in July (98 mm) and August (91 mm). The Peak monthly mean rainfall amount of (520 mm) was experienced in August, 2007 and the annual mean rainfall amount of 245mm was observed.
In Maiduguri, higher monthly mean rainfall amount was observed in August (52 mm) and September (57 mm). The Peak monthly mean rainfall amount of (380 mm) was experienced in August, 2008 and the annual mean rainfall amount of 215 mm was observed.
In Kano, higher monthly mean rainfall amount was observed in August (96 mm) and October (91 mm). The Peak monthly mean rainfall amount of 600 mm was experienced in October, 2008 and the annual mean rainfall amount of 265 mm was observed.
In Lokoja, higher monthly mean rainfall amount was observed in September (95 mm) and October (89 mm). The Peak monthly mean rainfall amount of 455 mm was experienced in October, 2000 and the annual mean rainfall amount of 215 mm was observed.
In Abuja, higher monthly mean rainfall amount was observed in August (86 mm) and October (92 mm. The Peak monthly mean rainfall amount of 490 mm was experienced in August, 2010 and the annual mean rainfall amount of 255 mm was observed.
The lowest monthly mean rainfall amount was experienced in the months of January, February, March and December (JFMD) during the research period (1981-2010) over the selected stations in the Northern. The lowest monthly mean rainfall amount was observed during this period (JFMD) confirming the climatic condition over Bauchi, Maiduguri, Kano, Lokoja and Abuja [Odjugo].
Time series plot of rainfall over south west stations (Ibadan, Ikeja and Akure)
Figures 3a-3c displays the time series plot of the monthly rainfall in Ibadan, Ikeja and Akure from January 1981 to December 2010. It was generally observed that rainfall amount increases across the days of the months with sharp increase in the month of June and September in Ibadan, August and September in Ikeja, June and August in Akure during the research period.

Figure 3a: Ibadan rainfall from (1981-2010).

Figure 3b: Ikeja rainfall from (1981-2010).

Figure 3c: Akure rainfall from (1981-2010).
In Ibadan, higher monthly mean rainfall amount was observed in June (105mm) and September (115 mm). The Peak monthly mean rainfall amount of (380mm) was experienced in June, 2002 and the annual mean rainfall amount of 235mm was observed.
In Ikeja, higher monthly mean rainfall amount was observed in June (110 mm) and September (120 mm). The Peak monthly mean rainfall amount of (620 mm) was experienced in September, 1997 and the annual mean rainfall amount of 360mm was observed.
In Akure, higher monthly mean rainfall amount was observed in June (220 mm) and August (200 mm). The Peak monthly mean rainfall amount of (460 mm) was experienced in August, 1992 and the annual mean rainfall amount of 230 mm was observed.
The lowest monthly mean rainfall amount was experienced in the months of January, February, March and December (JFMD) during the research period (1981-2010). The lowest monthly mean rainfall amount was observed during this period (JFMD) confirming the climatic condition over Ibadan, Ikeja and Akure [2].
Time series plot of rainfall over south stations (Warri and Port Harcourt)
Figures 4a-4b displays the time series plot of the monthly rainfall in Warri and Port Harcourt from January 1981 to December 2010. It was generally observed that rainfall amount increases across the days of the months with sharp increase in the month of June and September in Warri and June and September in Port Harcourt during the research period.

Figure 4a: Warri rainfall from (1981-2010).

Figure 4b: Port Harcourt rainfall from (1981-2010).
In Warri, higher monthly mean rainfall amount was observed in June (205 mm) and September (230 mm). The Peak monthly mean rainfall amount of (860 mm) was experienced in June, 1993 and the annual mean rainfall amount of 410 mm was observed.
In Port Harcourt monthly mean rainfall amount was observed in June (190 mm) and September (198 mm). The Peak monthly mean rainfall amount of (780 mm) was experienced in September, 2006 and the annual mean rainfall amount of 395 mm was observed.
The lowest monthly mean rainfall amount was experienced in the months of January, November and December (JND) during the research period (1981-2010). The lowest monthly mean rainfall amount was observed during this period (JND) confirming the climatic condition over Warri and Port Harcourt [8].
Prediction of rainfall over the stations
Table 2 shows AIC and BIC value of rainfall for the tentative ARIMA Models over all the stations. The model that has the lowest AIC and BIC among the models in ARIMA is (1 1 1)(1 0 0)12 for Bauchi, (0 1 1)(1 0 1)12 for Maiduguri, (1 1 1)(1 0 0)12 for Kano, (1 1 1)(0 0 1)12 for Lokoja, (1 1 1)(1 0 0)12 for Abuja, (1 1 1)(0 0 1)12 for Ibadan, (1 1 1)(1 0 1)12for Ikeja, (1 1 1)(1 0 0)12 for Akure, (1 1 1)(1 0 1)12 for Warri and (1 1 1)(1 0 1)12 for Port Harcourt. Therefore they were selected for prediction of Rainfall. ARIMA point rainfall forecast over all the stations are also presented in Table 3.
| Bauchi | ARIMA Model (p,d,q) | AIC | BIC | Maiduguri | AIC | BIC |
|---|---|---|---|---|---|---|
| (1 1 1)(1 0 1)12 | 14.96 | 15.1436 | 14.5562 | 14.6321 | ||
| (1 1 1)(0 0 1)12 | 14.905 | 15.0778 | 14.4571 | 14.628 | ||
| (1 1 1)(1 0 0)12 | 14.7857 | 14.9584 | 14.5416 | 14.6317 | ||
| (0 1 1)(1 0 1)12 | 14.9549 | 15.5267 | 14.4461 | 14.6188 | ||
| Kano | (1 1 1)(1 0 1)12 | 15.2456 | 15.1786 | Lokoja | 14.993 | 15.1765 |
| (1 1 1)(0 0 1)12 | 15.2357 | 15.1467 | 14.3948 | 14.5675 | ||
| (1 1 1)(1 0 0)12 | 14.9661 | 15.1265 | 15.2761 | 15.2162 | ||
| (0 1 1)(1 0 1)12 | 15.2655 | 15.4213 | 14.7183 | 14.891 | ||
| Abuja | (1 1 1)(1 0 1)12 | 14.8223 | 14.9965 | Ibadan | 5.5126 | 5.6288 |
| (1 1 1)(0 0 1)12 | 14.8121 | 14.9942 | 5.4813 | 5.5742 | ||
| (1 1 1)(1 0 0)12 | 14.8094 | 14.9821 | 5.9297 | 6.0226 | ||
| Ikeja | (1 1 1)(1 0 1)12 | 6.1061 | 7.1132 | Akure | 15.1506 | 15.6223 |
| (1 1 1)(0 0 1)12 | 6.1313 | 7.2574 | 15.1045 | 15.609 | ||
| (1 1 1)(1 0 0)12 | 6.1265 | 7.1234 | 15.0009 | 15.5748 | ||
| (0 1 1)(1 0 1)12 | 6.1344 | 7.2652 | 15.1245 | 15.6126 | ||
| Warri | (1 1 1)(1 0 1)12 | 6.3274 | 6.6342 | Port Harcourt | 15.7751 | 15.9587 |
| (1 1 1)(0 0 1)12 | 6.4464 | 6.7118 | 15.8003 | 15.9805 | ||
| (1 1 1)(1 0 0)12 | 6.4361 | 6.6435 | 15.7954 | 15.9753 | ||
| (0 1 1)(1 0 1)12 | 6.7247 | 6.7275 | 15.7832 | 15.9651 |
Table 2: AIC and BIC value of Rainfall for the tentative ARIMA Models over all the stations.
| Bauchi | Month | Period | Forecast | Lower | Upper | Maiduguri | Forecast | Lower | Upper |
| January | 433 | 0 | 0 | 1.6 | 0 | 0 | 0.8 | ||
| February | 434 | 0 | 0 | 2.1 | 0 | 0 | 1.6 | ||
| March | 435 | 0 | 0 | 1.8 | 0 | 0 | 1.2 | ||
| April | 436 | 6.8 | 5.2 | 10.6 | 2.8 | 1.8 | 3.1 | ||
| May | 437 | 19.3 | 15.7 | 23.1 | 3.8 | 2.5 | 4.3 | ||
| June | 438 | 148.7 | 110.2 | 150.6 | 27.7 | 26.6 | 28.4 | ||
| July | 439 | 77.8 | 65.8 | 79.2 | 39.7 | 36.4 | 40.2 | ||
| August | 440 | 239 | 230 | 243.4 | 142.2 | 130.8 | 143 | ||
| September | 441 | 227.8 | 206.5 | 230.3 | 105 | 98.6 | 108.4 | ||
| October | 442 | 164 | 146.6 | 168.2 | 25.9 | 24.4 | 27.1 | ||
| November | 443 | 10.3 | 8.4 | 11.4 | 4.2 | 3.8 | 4.6 | ||
| Kano | January | 433 | 0 | 0 | 0.6 | Lokoja | 0 | 0 | 0.6 |
| February | 434 | 0 | 0 | 1.1 | 0 | 0 | 0.5 | ||
| March | 435 | 0 | 0 | 2.5 | 0 | 0 | 1.2 | ||
| April | 436 | 15.8 | 12.8 | 17.2 | 39.3 | 37.4 | 40.4 | ||
| May | 437 | 0.3 | 0.1 | 2.2 | 43.1 | 42.6 | 44.8 | ||
| June | 438 | 52.7 | 45.6 | 53.6 | 150 | 138.2 | 156.6 | ||
| July | 439 | 81.7 | 76.6 | 83 | 195.6 | 187.4 | 198.2 | ||
| August | 440 | 157.5 | 155.8 | 160.2 | 168 | 152.8 | 170.1 | ||
| September | 441 | 50.5 | 48.6 | 51.6 | 233.8 | 220.6 | 239.3 | ||
| October | 442 | 118.7 | 115.6 | 120.1 | 198.9 | 195.4 | 199.6 | ||
| November | 443 | 17.3 | 15.6 | 17.8 | 119.3 | 115 | 124.2 | ||
| December | 444 | 0 | 0 | 1 | 0 | 0 | 2.1 | ||
| Abuja | Month | Period | Forecast | Lower | Upper | Ibadan | Forecast | Lower | Upper |
| January | 433 | 0 | 0 | 0.5 | 10.5 | 6.4 | 12 | ||
| February | 434 | 0 | 0 | 2.1 | 0 | 0 | 3.1 | ||
| March | 435 | 0 | 0 | 2.2 | 5.2 | 4.6 | 7.1 | ||
| April | 436 | 13.6 | 7.6 | 15.1 | 132.8 | 122.1 | 135 | ||
| May | 437 | 75.2 | 60.5 | 78.3 | 100.8 | 96.4 | 112.2 | ||
| June | 438 | 177.7 | 165.2 | 179.2 | 273.3 | 246.2 | 283.4 | ||
| July | 439 | 203 | 198.7 | 206.1 | 191.2 | 172.4 | 200 | ||
| August | 440 | 222.6 | 210 | 225.4 | 131.5 | 120.6 | 140.8 | ||
| September | 441 | 218.1 | 216.2 | 220 | 283.7 | 210.6 | 296.1 | ||
| October | 442 | 282.7 | 268.7 | 291.1 | 227.8 | 218.4 | 235 | ||
| November | 443 | 165.2 | 158.4 | 168.2 | 56.8 | 48.9 | 60.2 | ||
| December | 444 | 0 | 0 | 1.3 | 1.8 | 0.5 | 2.6 | ||
| Ikeja | January | 433 | 8.6 | 5.6 | 10.1 | Akure | 1.8 | 1 | 2 |
| February | 434 | 17 | 15.4 | 18 | 12.6 | 10.6 | 13.4 | ||
| March | 435 | 87.3 | 75.3 | 89.1 | 174.9 | 156.6 | 178.2 | ||
| April | 436 | 174.3 | 158.9 | 176 | 181.6 | 174.6 | 185.4 | ||
| May | 437 | 243.1 | 220.8 | 245.6 | 203 | 198.4 | 210.2 | ||
| June | 438 | 129.9 | 110.6 | 131.4 | 218.3 | 210.1 | 220 | ||
| July | 439 | 143.7 | 132.5 | 145.1 | 151.3 | 146.3 | 152.8 | ||
| August | 440 | 399.6 | 346.2 | 401.1 | 206.6 | 200.4 | 208.9 | ||
| September | 441 | 284.2 | 263.8 | 284.8 | 184.6 | 165.9 | 186.1 | ||
| October | 442 | 116.5 | 110.1 | 118.2 | 197.1 | 186.9 | 220.8 | ||
| November | 443 | 61.9 | 58.9 | 62.4 | 166.1 | 146.5 | 170 | ||
| December | 444 | 22.2 | 17.8 | 24.2 | 0.5 | 0.5 | 1.8 | ||
| Warri | Month | Period | Forecast | Lower | Upper | Port H | Forecast | Lower | Upper |
| January | 433 | 28 | 25.3 | 30 | 35.9 | 30.2 | 37.2 | ||
| February | 434 | 118.4 | 110.5 | 220.4 | 107.6 | 105.3 | 110.1 | ||
| March | 435 | 89.5 | 75.6 | 90.2 | 76.4 | 74.8 | 78.3 | ||
| April | 436 | 218.9 | 210.5 | 220 | 408.6 | 380.2 | 408.8 | ||
| May | 437 | 379.8 | 350.2 | 380.1 | 348.5 | 340.1 | 350 | ||
| June | 438 | 351.7 | 342.8 | 352 | 494.8 | 462.9 | 495.1 | ||
| July | 439 | 192.4 | 186.4 | 192.8 | 159.8 | 146.8 | 163.1 | ||
| August | 440 | 302.4 | 289.9 | 306.3 | 387.6 | 360.4 | 387.9 | ||
| September | 441 | 536.6 | 490 | 540.1 | 135.6 | 128.6 | 136.3 | ||
| October | 442 | 296.4 | 286.4 | 296.6 | 172.8 | 168.6 | 173 | ||
| November | 443 | 157.7 | 146.6 | 160.2 | 34.9 | 30.9 | 36.1 | ||
| December | 444 | 3.2 | 2.2 | 4 | 28.1 | 25.6 | 29 |
Table 3: Rainfall forecast in all the stations.
The highest rainfall value of 239 mm in August and lowest rainfall of 6.8 mm in April is expected over Bauchi. Rainfall amount is expected to be very low in January, February, March and December over Bauchi.
While over Maiduguri, the highest rainfall of 142.2 mm in August and lowest rainfall of 2.8 mm in April is expected. Rainfall is expected to be very low in January, February, March and December.
Also in Kano the highest rainfall of 157.5 mm in August and lowest rainfall of 0.3 mm in May is expected. Rainfall is expected to be very low in January, February, March and December over.
The highest rainfall intensity of 233.8 mm in September and lowest rainfall of 39.3 mm in April is expected over Lokoja. Rainfall is expected to be very low in January, February, March and December over the station. Also observed is highest rainfall of 282.7 mm in October and lowest rainfall of 13.6 mm in April is expected over Abuja. Rainfall is expected to be very low in January, February, March and December over Abuja while in Ibadan, the highest rainfall of 283.7 mm in September and lowest rainfall of 1.8 mm in December is expected. Rainfall is expected to be very low in February over Ibadan. The highest rainfall of 399.6 mm in August and lowest rainfall of 8.6 mm in January is expected over Ikeja. Rainfall is expected to be very low in February in the station. Akure has the highest rainfall of 218.3 mm in June and lowest rainfall of 0.5 mm in December is expected. Rainfall is expected to be very low in January over Akure.
The highest rainfall intensity of 536.6 mm in September and lowest rainfall of 3.2 mm in December is expected over Warri. Rainfall intensity is expected to be very low in January over Warri.
The highest rainfall intensity of 494.8 mm in June and lowest rainfall of 28.1 mm in December is expected over Port Harcourt. Rainfall is expected to be very low in January over Port Harcourt. The forecast is given with 95%confidence.
This work analyzed the pattern of rainfall over some selected stations in Nigeria using ARIMA and SARIMA Statistical Model. It was generally observed that rainfall amount increases across the months with sharp increase in the month of June to September in the South-west, June and September in South-south and August to October in the North. A decreasing trend was observed from December to January in the South-west, December in South-south and April to May in the North. The highest rainfall of 230 mm was recorded in September over Warri and the lowest rainfall intensity of 52 mm was recorded in August over Maiduguri, thus making the rainfall over South-south stations visibly higher than the Northern and South -western stations. Rainfall pattern of Ikeja, Akure, Warri and Port Harcourt were found to be increasing significantly as compared to Bauchi, Maiduguri, Lokoja, Kano and Abuja. The Peak monthly mean rainfall amount of (91 mm) was experienced in August during the study period in the Northern part of the country. Rainfall was very low in January, February, March and December over Northern Nigeria. The Peaks monthly mean rainfall amount of (215 mm) was experienced in June and September during the study period in the South west. Rainfall was very low in January and December over South-west. The Peak monthly mean rainfall amount of (325 mm) was experienced on September during the research period in the South-south. Rainfall is very low in December over South-south.
This research was carried out using monthly rainfall while daily values may be more reliable.
The authors appreciate Nigeria Meteorological agency for the data made available and also, the anonymous reviewers.
