Research - (2020) Volume 8, Issue 3
North-Eastern Ethiopia is one of the sensitive regions to climate variation particularly to temperature and rainfall changes. Rainfall and temperature are one of the most determinant climate patterns for the study area because more than 80% of the area’s agriculture is reliant on rain-fed. The main aim of this study was to investigate trends in temperature and rainfall in the annual, seasonal and monthly time scale at Kombolcha and Dessie Meteorological stations. The daily rainfall and temperature data were collected from National Meteorological Agency of Ethiopia. The Mann-Kendall test and Sen’s slope estimator were used to assess rainfall and temperature trends. The Mann- Kendall test revealed that a non-significant decreasing rainfall trend was observed during February to March and September at Kombolcha and during January to March and September at Dessie stations. The rainfall trends showed decreasing in belg while increasing in both kiremt and bega season at both stations. However; the detected trends are non-significant. Both maximum and minimum temperature revealed that statistically significant decreasing trends in annual and seasonal time scale at Dessie station while at Kombolcha station a significant increasing trend of maximum temperature was observed at both annual and seasonal time scale. On the other hand a non-significant warming trend of minimum temperature was observed during annual and kiremt time scale but a non-significant decreasing trend was experienced during bega and belg season at Kombolcha station. Increase in temperature and decrease in amount of rainfall may have a negative impact on crop production and soil water balance. Therefore, this study could have an important role in identifying possible present and future production strategies.
Rainfall; Temperature; Trend analysis; Mann-Kendall test
Temperature and precipitation are two most important climate parameters that are most studied in climate research because of their immediate impact in various socioeconomic sectors (e.g. agriculture and hydrology), including human comfort [1]. The changes in temperature and rainfall patterns are widely observed in many semi-arid parts of the developing world that are likely to become even hotter and dryer with time [2]. Inter-annual variability of precipitation and rising trends of temperature has observed [3]. Developing countries in East Africa like Ethiopia may experience greater variability of precipitation and evapotranspiration [4]. Principally, climate is one of the most important factors among the leading factors for vulnerability, in most parts of Ethiopia [5]. Hence, Ethiopia has been described as one of the most vulnerable countries to climate change in Africa [6].
Climate change is manifested in terms of increasing temperature and change in intensity and pattern of rainfall [7]. Increasing or decreasing of average annual temperatures and rainfall are most likely due to climate change [8]. IPCC also confirmed that a change in precipitation was due to change in climate [9]. According IPCC report, the mean global surface temperature is become increasing [10]. Many authors argue that the causes of increasing global surface temperature may be the alteration of the hydrological cycle at global and local scales [11,12]. However, the change in rainfall and temperature patterns is not globally uniform [13]. Many parts of the world, particularly countries in Sub-Saharan Africa, are affected by global warming owing to the changing in temperature and precipitation patterns [6,14]. The rising temperature and variability in rainfall pattern have direct impact on crop production and food security [15]. Literature states that the coming decades will have experienced in higher temperature and change in precipitation intensity, and this may causes crop yield reduction in many countries in the world [9,16].
The Northern part of Ethiopia is affected by climate change and variability, coupled with high rainfall variability [17,18]. In Ethiopia, the average annual minimum and maximum temperatures have increased by about 0.25°C and 0.1°C every ten years respectively [7]. The higher temperature accelerates the evapotranspiration process that creating moisture stress and this becomes more severe regarding yield losses if it occurs during the canopy formation [19]. Therefore; the main objective of this study is to detect the trend, magnitude and inter-annual variability of rainfall and temperatures over North-Eastern Ethiopia.
The study area description
The study was conducted at Kombolcha and Dessie sites in North Eastern parts of Ethiopia. The Kombolcha and Dessie sites are situated in 11.08°N, 39.72°E and 11.13°N, 39.14°E respectively. The altitudes are ranged from 1842-1915 and 2470 m-2553 m above sea level for Kombolcha and Dessie sites, respectively (Figure 1). Based on current studies, Kombolcha and Dessie sites receive a mean annual rainfall ranging from 725.1 mm to 1361.6 mm and 851.3 mm to 1612.6 mm respectively. The mean annual temperature varies from 18.7°C to 20.9°C and 14.8°C to 19.3°C at Kombolcha and Dessie, respectively.

Figure 1 : Study area map.
Data sources
Daily rainfall data (1983-2019), maximum and minimum temperature (1985-2019) were collected from the National Meteorological Agency of Ethiopia (NMA). Missing values were patched using Markov chain simulation model of INSTAT v.3.36 [20]. Quality control check was also done for maximum and minimum daily temperature values by running a macro automatic check [20].
Methods of data analysis
The daily observed climate data were arranged in Day Of Year (DOY) format for processing. The data was analyzed using INSTAT, XLSTAT, 2016 and Excel spread sheet tools. Both descriptive and Mann-Kendall trend test were computed in order detect the trends, directions and magnitudes as well the inter-annual variability of rainfall and temperatures. Descriptive statistical, such as minimum, maximum, mean, standard deviation, and coefficient of variation were computed using simple Excel spreadsheet, whereas the trend, directions, magnitudes and significances were determined using Mann-Kendall trend test, Kendall’s tau and Sen’s slope estimator [21].
The Mann-Kendall’s test: Mann-Kendall’s test is a non-parametric method, which is less sensitive to outliers and test for a trend in a time series without specifying whether the trend is linear or nonlinear [22].
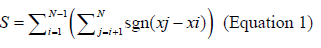
Where xj and xi are the sequential precipitation values in months j and i (j>i) and N is the length of the time series. A positive S value indicates an increasing trend and a negative value indicates a decreasing trend in the data series.
The variance of S, for the situation where there may be ties (i.e., equal values) in the x values, is given by as:
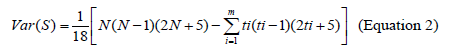
Where, m is the number of tied groups in the data set and ti is the number of data points in the ith tied group for n larger than 10.
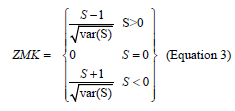
The standard normal ZMK test statistic is computed as follows [22].
Sen’s slope estimator test: The magnitude of trend is predicted by the Sen’s estimator. The slope (Ti) of all data pair computed.This test is applied in cases where the trend is assumed to be linear, depicting the quantification of changes per unit time.
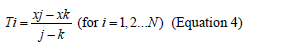
Where xj and xk are considered as data values of time j and k (j>k) correspondingly, the median of these N values of Ti is represented as Sen’s estimator of slope which is given as
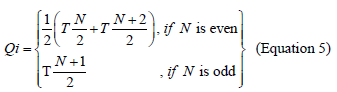
Positive value of Qi indicates an upward or increasing trend and a negative value indicates downward or decreasing trend in the time series.
Characteristics of rainfall
The temporal variations of mean monthly, seasonal and annual rainfall at Kombolcha and Dessie meteorological stations are presented in Table 1 and Figure 2. Kombolcha and Dessie stations have received the maximum rainfall about 280.4 mm and 318.7 mm respectively during August and July (Figure 2). Except the four months (December, January, February and March), all other months received a considerable amount of rainfall in the two stations (Figure 2). The annual total rainfall was varied from 725.1 mm to 1361.6 mm with a mean of 1037.6 mm at Kombolcha station, while from 851.3 mm to 1612.6 mm with a mean of 1191.7 mm at Dessie station in the last 3 decades.
| Descriptive | Kombolcha | Dessie | ||||||
|---|---|---|---|---|---|---|---|---|
| Statistics | Annual | Kiremt | Belg | Bega | Annual | Kiremt | Belg | Bega |
| Minimum | 725.1 | 379.2 | 48.2 | 1 | 851.3 | 449 | 77.7 | 18.3 |
| Maximum | 1361.6 | 962.5 | 541 | 282.1 | 1612.6 | 1196.7 | 521.9 | 362 |
| Mean | 1037.6 | 694.2 | 244.9 | 98.4 | 1191.7 | 803.8 | 264.9 | 123.2 |
| Std.Deviation | 153.5 | 136.8 | 105.3 | 67.2 | 202 | 182.4 | 110.9 | 73.1 |
| CV (%) | 14.8 | 19.7 | 43 | 68.3 | 17 | 22.7 | 41.8 | 59.3 |
| CT (%) | - | 66.9 | 23.6 | 9.5 | - | 67.4 | 22.2 | 10.3 |
Table 1 : Annual and Seasonal rainfall variability over Kombolcha and Dessie stations
Refer Table 2 for the corresponding values for belg and bega seasons. The coefficients of variation for rainfall at Kombolcha were varied moderately with CV of 14.8% in annual and 19.75% in kiremt rainy season, while it was extremely varied with 43 and 68.3% during belg and bega season respectively. This result agrees with the finding of some researchers [23,24]. Both stations were experienced with bimodal rainfall pattern, where much of the rainfall concentrated in the main rainy season (June-September) and a small amount of rainfall occurred the second rainy season (February-May). The season from October to January is a relatively dry season (Figure 2).

Figure 2: Mean monthly rainfall distribution at Kombolcha and Dessie stations.
Temporal variability of temperature
Minimum temperature is high during June and July at Kombolcha and Dessie areas respectively while that of low is during November and December in the previous order. The highest maximum temperature was occurred in the month of June and the low was in the month of December and January at both stations (Figure 3). The annual maximum temperature was varied from 25.5°C to 28°C and 22.9°C to 26.2°C at Kombolcha and Dessie stations respectively. Similarly the annual minimum temperature was varied from 11.8°C to 13.7°C and 6.6°C to 12.4°C at Kombolcha and Dessie stations respectively (Table 2). As far as temporal seasonal variation is concerned, high maximum and minimum temperature is recorded during Kiremt (June-September) season for both stations. The coefficient of variation showed that both maximum and minimum temperature is more variable at Dessie station than Kombolcha (Table 2).
| Elements | Descriptive | Kombolcha | Dessie | ||||||
|---|---|---|---|---|---|---|---|---|---|
| Statistics | Annual | Kiremt | Belg | Bega | Annual | Kiremt | Belg | Bega | |
| Maximum temperature | Minimum | 25.5 | 26.9 | 24.8 | 23 | 22.9 | 24 | 23.1 | 21.5 |
| Maximum | 28 | 29.5 | 28.8 | 26.8 | 26.2 | 27.8 | 27.3 | 24.8 | |
| Mean | 26.9 | 28.1 | 27.4 | 25.3 | 24.8 | 26 | 25.1 | 23.4 | |
| CV (%) | 2.3 | 2 | 3.6 | 3.1 | 4.1 | 3.9 | 5.5 | 4.1 | |
| Minimum temperature | Minimum | 11.8 | 14.1 | 11.5 | 8.1 | 6.6 | 8.8 | 7.3 | 3.8 |
| Maximum | 13.7 | 15.9 | 14.3 | 11.2 | 12.4 | 14.1 | 13.1 | 10.4 | |
| Mean | 12.6 | 15 | 13.1 | 9.8 | 10.5 | 12.5 | 10.9 | 8 | |
| CV (%) | 3.5 | 2.8 | 6.1 | 7.8 | 14.2 | 11.7 | 16.4 | 18.4 | |
Table 2 : Summary of annual and seasonal temperature variation.

Figure 3: Mean monthly temperature patterns at Kombolcha and Dessie stations.
Rainfall trends
A summary of the monthly, seasonal and annual rainfall trend analysis at Kombolcha and Dessie stations are shown in Tables 3 and 4. The rainfall trend is decreasing and non-significant (P>0.05) during the month of February to April and September at Kombolcha station. Similarly at Dessie station, the trends were decreasing and non-significant in the month of January to March and September. The rainfall trend was significantly increase by 2.3 mm per month at Kombolcha station, while increased by 0.17 mm per month during August at Dessie station (Table 4). The seasonal rainfall trend was increasing by 4.2 mm/season at Kombolcha and by 2 mm per season at Dessie station during Kiremt (Table 4). Whatever there were increasing or decreasing trend, the detected trends were not statistically significant in most of the months and seasons over both stations. Insignificant annual rainfall trends may be due to high inter-annual variability. In general, the rainfall trend was increased during the Kiremt and Bega season and it was decreased during the Belg season at both stations. However no significant trend was detected for seasonal rainfall distribution (Table 4).
| Station | Statistical parameters | Jan | Feb | Mar | Apr | May | Jun | Jul | Aug | Sep | Oct | Nov | Dec |
|---|---|---|---|---|---|---|---|---|---|---|---|---|---|
| Kombolcha | ZMK | -0.03 | -0.13 | -0.09 | -0.16 | 0.02 | 0.15 | 0.14 | 0.26 | -0.1 | 0.11 | 0.13 | -0.13 |
| Q | 0 | -0.25 | -0.6 | -1.39 | 0.05 | 0.37 | 1.97 | 2.3 | -0.59 | 0.33 | 0.02 | -0.04 | |
| P | 0.82 | 0.28 | 0.4 | 0.18 | 0.91 | 0.19 | 0.22 | 0.02 | 0.38 | 0.34 | 0.28 | 0.26 | |
| Dessie | ZMK | -0.09 | -0.14 | -0.15 | 0.003 | 0.04 | 0.2 | 0.07 | 0.17 | -0.13 | 0.16 | 0.26 | -0.05 |
| Q | -0.06 | -0.64 | -0.97 | 0.03 | 0.27 | 0.8 | 1.41 | 1.88 | -1.23 | 0.84 | 0.29 | 0 | |
| P | 0.46 | 0.25 | 0.19 | 0.99 | 0.71 | 0.08 | 0.56 | 0.14 | 0.27 | 0.17 | 0.03 | 0.68 |
Table 3: Summary of mean monthly rainfall trends for Komolcha and Dessie stations.
| Seasons | Kombolcha | Dessie | ||||
|---|---|---|---|---|---|---|
| ZMK | Q | P | ZMK | Q | P | |
| Annual | 0.01 | 0.1 | 0.97 | -0.03 | -0.56 | 0.82 |
| Kiremt | 0.19 | 4.2 | 0.09 | 0.06 | 2 | 0.59 |
| Belg | -0.22 | -2.4 | 0.06 | -0.12 | -1.73 | 0.29 |
| Bega | 0.01 | 0.1 | 0.95 | 0.21 | 1.58 | 0.07 |
Table 4: Trends of annual and seasonal rainfall in the two stations.
Trends of temperature
The maximum temperature trend was significantly increasing and decreasing at Kombolcha and Dessie station in all months (Table 5).
| Kombolcha | Dessie | |||||||||||
|---|---|---|---|---|---|---|---|---|---|---|---|---|
| Maximum Temp | Minimum Temp | Maximum Temp | Minimum Temp | |||||||||
| Month | ZMK | Q | P | ZMK | Q | P | ZMK | Q | P | ZMK | Q | P |
| Jan | 0.38 | 0.06 | 0 | -0.06 | -0.02 | 0.61 | -0.26 | -0.06 | 0.04 | -0.43 | -0.15 | 0 |
| Feb | 0.45 | 0.08 | 0 | -0.14 | -0.05 | 0.24 | -0.22 | -0.06 | 0.08 | -0.44 | -0.15 | 0 |
| Mar | 0.48 | 0.09 | 0 | -0.11 | -0.02 | 0.37 | -0.26 | -0.06 | 0.03 | -0.49 | -0.12 | 0 |
| Apr | 0.42 | 0.09 | 0 | 0.03 | 0 | 0.84 | -0.31 | -0.07 | 0.01 | -0.39 | -0.08 | 0 |
| May | 0.22 | 0.04 | 0.07 | 0.24 | 0.03 | 0.04 | -0.42 | -0.12 | 0 | -0.41 | -0.08 | 0 |
| Jun | 0.2 | 0.02 | 0.09 | 0.13 | 0.01 | 0.27 | -0.52 | -0.12 | 0 | -0.41 | -0.08 | 0 |
| Jul | 0.36 | 0.04 | 0 | 0.19 | 0.02 | 0.12 | -0.34 | -0.06 | 0.01 | -0.44 | -0.08 | 0 |
| Aug | 0.31 | 0.03 | 0.01 | 0.19 | 0.01 | 0.11 | -0.25 | -0.05 | 0.04 | -0.34 | -0.07 | 0 |
| Sep | 0.55 | 0.06 | 0 | 0.22 | 0.01 | 0.07 | -0.26 | -0.05 | 0.03 | -0.39 | -0.09 | 0 |
| Oct | 0.4 | 0.04 | 0 | 0.1 | 0.01 | 0.4 | -0.27 | -0.05 | 0.03 | -0.38 | -0.08 | 0 |
| Nov | 0.37 | 0.04 | 0 | 0.34 | 0.05 | 0 | -0.33 | -0.06 | 0.06 | -0.15 | -0.02 | 0.2 |
| Dec | 0.3 | 0.03 | 0.01 | -0.04 | -0.01 | 0.74 | -0.32 | -0.07 | 0.01 | -0.24 | -0.11 | 0.05 |
Table 5: Monthly temperature trends at Kombolcha and Dessie station.
Significant increasing trend of maximum temperature (0.09°C/ month) was observed during March and April while the minimum temperature trend was increasing significantly during April to November at Kombolcha station. On the other hand, the minimum temperature trend showed in decreasing trend throughout the months at Dessie station (Table 5).
A non-significant minimum temperature trend was increasing by 0.002°C and 0.01°C/season at Kombolcha station during annual and Kiremt time scale respectively (Table 6). Solomon come across with an increasing trend in annual maximum and minimum temperature at Lake Tana by a factor of 0.14°C and 0.423°C per year respectively [25]. In case of belg and bega season, decreasing trend of minimum temperature was detected at Kombolcha (Table 6).The mean annual and seasonal temperature have shown a significant increasing trend at Kombolcha station (Table 6). This is supported by Woldeamlake and Conway annual and kiremtrainfall showed significant increasing trend at Dessie and Labella where as significant decreasing trend was observed at Debre Tabor [23]. On the contrary a significant decreasing of annual and seasonal mean temperature was observed at Dessie station. The magnitude of the increasing trend of the annual and Kiremt maximum temperature compared to the minimum temperature at Kombolcha areas indicates higher daytime evaporative demand and therefore a higher water requirement for crops.
| Elements | Kombolcha | Dessie | |||||||
|---|---|---|---|---|---|---|---|---|---|
| Statistical parameters | Annual | Kiremt | Belg | Bega | Annual | Kiremt | Belg | Bega | |
| Maximum temperature | ZMK | 0.66 | 0.52 | 0.52 | 0.55 | -0.34 | -0.37 | -0.3 | -0.32 |
| Q | 0.05 | 0.04 | 0.07 | 0.05 | -0.06 | -0.07 | -0.07 | -0.05 | |
| P | 0.0001 | 0.0001 | 0.0001 | 0.0001 | 0.005 | 0.002 | 0.01 | 0.008 | |
| Minimum temperature | ZMK | 0.02 | 0.19 | -0.11 | -0.02 | -0.49 | -0.39 | -0.52 | -0.49 |
| Q | 0.002 | 0.01 | -0.02 | -0.002 | -0.09 | -0.08 | -0.12 | -0.08 | |
| P | 0.86 | 0.11 | 0.38 | 0.88 | 0.0001 | 0.001 | 0.0001 | 0.0001 | |
| Mean temperature | ZMK | 0.49 | 0.41 | 0.35 | 0.29 | -0.38 | -0.41 | -0.35 | -0.49 |
| Q | 0.03 | 0.03 | 0.02 | 0.02 | -0.08 | -0.08 | -0.09 | -0.07 | |
| P | 0.0001 | 0.0004 | 0.003 | 0.02 | 0.002 | 0.001 | 0.004 | 0.0001 | |
Table 6: Annual and seasonal temperatures trends over the two stations.
The trend of climatic variables with their fluctuation and variability of rainfall and temperature in the Kombolcha and Dessie sites were analyzed. The study area is vulnerable and susceptible to climatic fluctuation and variability; the climatic trend is more likely to result in an increase in the number and severity of natural disaster. Rainfall and temperature are one of the most determinant climatic patterns for the study area because more than 80% of the study area’s agriculture is reliant on rain fed. Increased temperature and changes in rainfall amounts will increase occurrence of drought and flood events. Hence, increase in temperature and decrease in rainfall amount may have a negative impact on crop production and soil water balance.
A non-significant decreasing trends of rainfall was observed during February, March, April and September at Kombolcha while during January, February, March and September at Dessie station in the entire study periods. The annual rainfall was increased with the rate of 0.1 mm per year at Kombolcha and decreased by 0.56 mm per year at Dessie station. Although the increasing and decreasing trends were observed, the detected trends were not statistically significant for both stations regarding to rainfall. On the other hand, the maximum temperature was increased significantly at Kombolcha and decreasing at Dessie station for all months. Similarly, the minimum temperature was decreased significantly in all months at Dessie station. In the annual and seasonal time scales, the maximum temperature has shown an increasing trend at Kombolcha and decreasing trend at Dessie station. Moreover, a non-significant increasing of minimum temperature was observed by 0.002°C/year and 0.01°C/year at Kombolcha station during annual and Kiremt time scale respectively. The analysis results provide further knowledge to improve our understanding on climate variability and change, and would be useful for future planning and management of water resources safely in the study area. In general the study reveals decreasing rainfall amounts and warming trends across Kombolcha than Dessie sites because Kombolcha is the home town of different industries and factories which causes for air pollution. Hence, information generated by this study could be beneficial to agricultural and water recourses planning and management especially in semi-arid environment were adaptability to climate variability and change is still low. Therefore; the concerned stakeholders should take into consideration the rainfall and temperature changes of the study area into their climate change adaptation strategy.
The authors thank the National Meteorological Agency of Ethiopia (NMA) for providing all the data used for this study.
Citation: Abegaz WB, Abera EA (2020) Temperature and Rainfall Trends in North Eastern Ethiopia. J Climatol Weather Forecast 8:262.doi: 10.35248/2332-2594.2020.8.262
Received: 19-Jun-2020 Published: 31-Aug-2020, DOI: 10.35248/2332-2594.2020.8.262
Copyright: © 2020 Abegaz WB, et al. This is an open-access article distributed under the terms of the Creative Commons Attribution License, which permits unrestricted use, distribution, and reproduction in any medium, provided the original author and source are credited.
