Research Article - (2016) Volume 4, Issue 2
Keywords: Cloud seeding; Potential of rainfall; Instability indices; Radiosonde
Thermodynamic diagrams are used in Practical and daily work of meteorologists as an auxiliary instruments to calculate the various quantities that cannot Measure by radiosonde. Some of those quantities such as Precipitation Water of Cloud (PWC), K Index (KI), Showalter (SI), Total (TT) and Convective Available Potential Energy (CAPE), determine the instability in atmosphere. These instability geneses are pronounced at the convection growth stage of clouds and linked closely to rainfall. Consequently, we can find a threshold for each instability indices that represent the potential of rainfall in specific cloud. In this study, to determine the rainfall potential of clouds for cloud seeding operation, some of those instability indices including PWC, KI, SI and CAPE were calculated during rainy days of 1991-2002 years in Mashhad city of Iran. The main goal of this article is to determine the optimal threshold for each index which shows minimum potential rainfall in cloud before seeding in the region. We’ve used best fitted curve on rainfall and the indices data to find optimal threshold [1-3].
Instability indices are calculated in some convective cloud seeding projects. The rainfall augmentation for crops experiment (PACE) carried successfully [4], the PWC index and buoyancy potential (difference between environment temperature and parcel temperature in 500 mb) were determined as suitable factors in cloud seeding and PWC for 26 mm was found to be the optimal PWC threshold in conducting convective cloud seeding activities. Instability indices have been calculated through studying severe wind hail storm over Sofia, Bulgaria to obtain the seeding threshold and hail suppression [5-8]. In this study CAPE was found to be 3785 Jkg-1, the vertical wind velocity of 21.9 m sec-1 and PWC of 12.9 Jkg-1. The some studies about a climate-related increase in extreme weather events have been done biased on instability indices [5,8-14]. Thunderstorm over Venice of Italy has been studied to find the most suitable forecast indices [12]. Some instability indices during hail suppression over Alberta, Canada, employing the cloud seeding operations on hailstorm [11]. The indices were as follows: the average PWC (18.8 mm), Showalter index (-3°C) and set of sets index (TT) (54°C) convective available Potential Energy (781 Jkg-1). Chi and Leng provides valuable information to help pinpoint the likely locations for possible heavy rainfall occurrences. The result shows that for the development of heavy rainfall, a deep warm, moist layer (high KI) is required but high CAPE may not be needed. The surface-based lifted index is the most useful stability index for predicting convective development. Daily sounding-derived atmospheric stability indices are typically employed for short-term severe weather forecasts.
In this study, some of the historic meteorological data during 1993-2010 are used. The number of rainy days was 804, a day being classed as rainy if only hundredth of an inch of rain fell during the 24 h. The dataset contains four sounding-derived parameters including PWC, SI, KI and CAPE at 1200 UTC formal sounding. To determine the optimal threshold for each index which shows minimum potential rainfall in cloud, the best fitted curve on scattering diagram of the rainfall data and the specific index data are used. Also, the probability of the rainfall for different range of each index has been calculated.
Mashhad city has a steppe climate with warm summers and cold winters and low precipitation. Almost all precipitation falls during the winter and during early spring. Figure 1 shows the location of Mashhad city in North East of Iran.
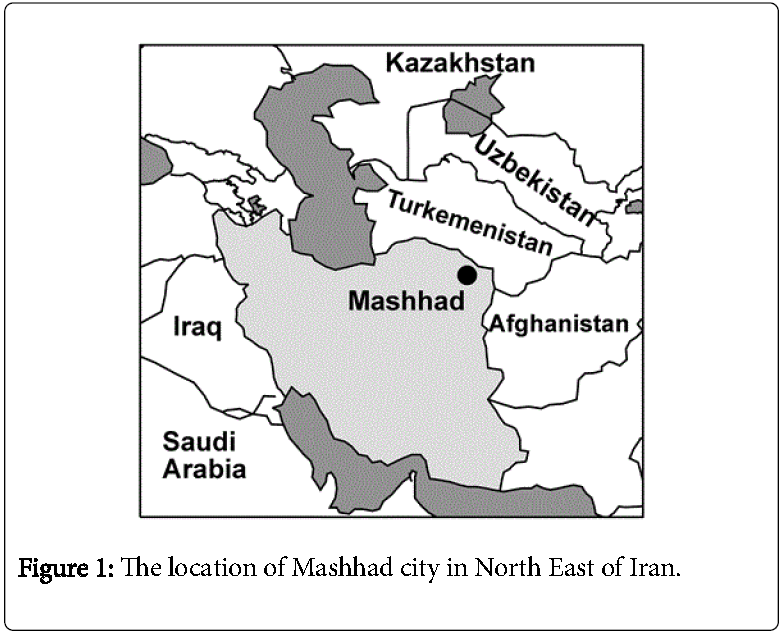
Figure 1: The location of Mashhad city in North East of Iran.
Precipitation water of cloud (PWC)
By definition, the condensed water in a humid air column is referred to as PWC (in mm or cm). The following simple relation is used to calculate the PWC as an index for prediction convection activity [11], Eqn 1.
PW=(1/g?rpd)x10 1Where, r is the average amount of mixing ratio between the pressure levels of the cloud base and peak.
Showalter Index (SI)
SI is a severe weather index. It uses a parcel lifted from 850 hPa to 500 hPa and parcel temperature is subtracted from the sounding temperature at 500 hPa. More negative SSI values indicate greater instability [15-18]. The SI is unrepresentative if the available low level moisture occurs below 850 mb, Eqn 2.
SI = T500 - T500 2
K Index
KI is useful for identifying convective clouds. It is computed from temperatures at 850, 700, and 500 hPa, and dew points at 850 and 700 hPa, Eqn 3:
K index = (T850 - T500) + Td850 - (T700 - Td700) 3
The higher the moisture difference, the higher the KI and potential for convection. It is an indication of potential instability in the lower half of the atmosphere, availability moisture in boundary layer, and reduction of buoyancy through entrainment of dry air (near 700 mb). It is most useful for forecasting thunderstorm in local forcing [1].
CAPE is characterized by the region on a skew-T diagram bounded by the environmental temperature and the moist adiabatic running from the LFC to the EL. This area specifies the amount of buoyant energy available as the parcel is accelerated. The larger the positive area, the higher the CAPE value and instability, and the greater the potential for severe convection.
The optimal threshold of PWC
Figure 2 shows the best fitted curve on scatterplots of PWC and rainfall data. The optimal threshold for cloud seeding has been defined by using the curve. According to Figure 2, PWC less than 10 mm is not suitable for cloud seeding because the most rainfall is equal zero and there isn’t any potential of rainfall.
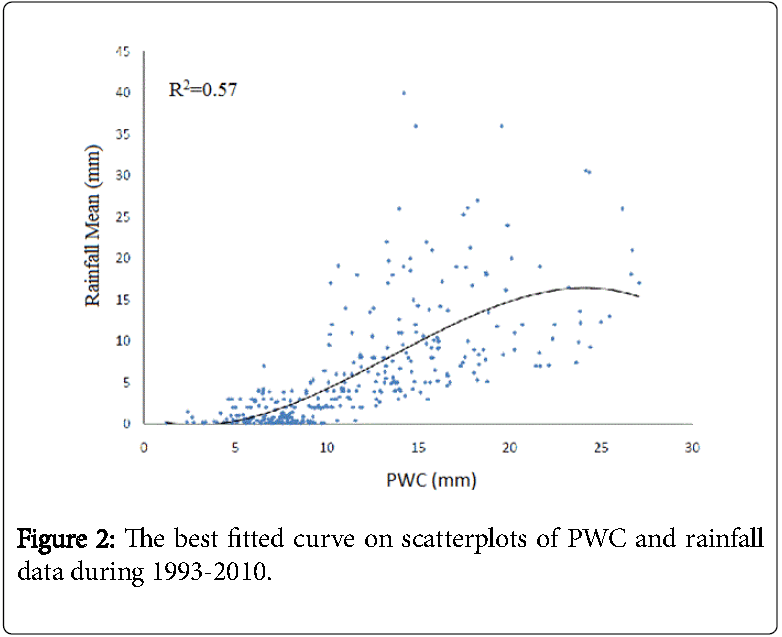
Figure 2: The best fitted curve on scatterplots of PWC and rainfall data during 1993-2010.
In this step, cloud seeding causes suppression in rainfall because of an increasing number of condensation nuclei and cloud droplet and also insufficient amount of PWC. Consequently, cloud droplet could not growth up as large as rainfall drop and over seeding will happen. When the PWC of cloud goes up 10 mm, the rainfall uniformly increases with increasing PWC (Simultaneously with increasing in age and thickness of cloud) in the area (Figure 2).
The droplets will grow up as large as rain drop due to sufficient moisture (PWC) and cloud seeding probably lead to increase in rainfall [7].
The upper limit of curve shows decreasing in the mean rainfall at 24 mm by increasing the PWC. Where an ascending air parcel is warmer than the ambient air, some mixing is expected to take place through its boundaries. Since, the ambient air is generally cooler and drier than the buoyant element, the mixing will tend to reduce the buoyancy and rainfall. This kind of mixing is called "entrainment".
The entrainment reduces PWC at 3/4 from the cloud base [15]. It is neglected in thermodynamics equations of physical process inside the cloud and it could be the possible reason of decreasing in the mean rainfall.
The probability of the rainfall for different range of PWC has been calculated (Table 1). The probability of the 8.6 mm rainfall is 68% for PWC more than 8.14 mm. The probability of low rainfall increases by decreasing PWC.
| PWC (mm) | RainfallRainfallmm 3.9-0.8Rainfallmm 8.6-3.9Rainfall>8.6 mm | |||
|---|---|---|---|---|
| More than 8.14 | Probability equal zero | 2% | 30% | 68% |
| 5.10-8.14 | 2% | 19% | 53% | 26% |
| 4.7 -5.10 | 42% | 41% | 11% | 6% |
| 4.7 Less than | 62% | 32% | 6% | Probability equal zero |
Table 1: The probability of the rainfall (in mm) for different range of PWC (in mm).
The optimal threshold of SI
Figure 3 shows the best fitted curve on scatterplots of SI and the logarithm of rainfall data. More negative SI values indicate greater instability, because the air parcel is warmer than environment and positive buoyancy causes more lifting [10]. An order 4 Polynomial is the best fitted curve to the rainfall and SI data by R2=0.78. When SI is more than 7°C, the rainfall is constant. But for SI less than 7, rainfall has increased continuously (Figure 3). In this condition, cloud growth up to sufficient thickness and cloud seeding would be successful.
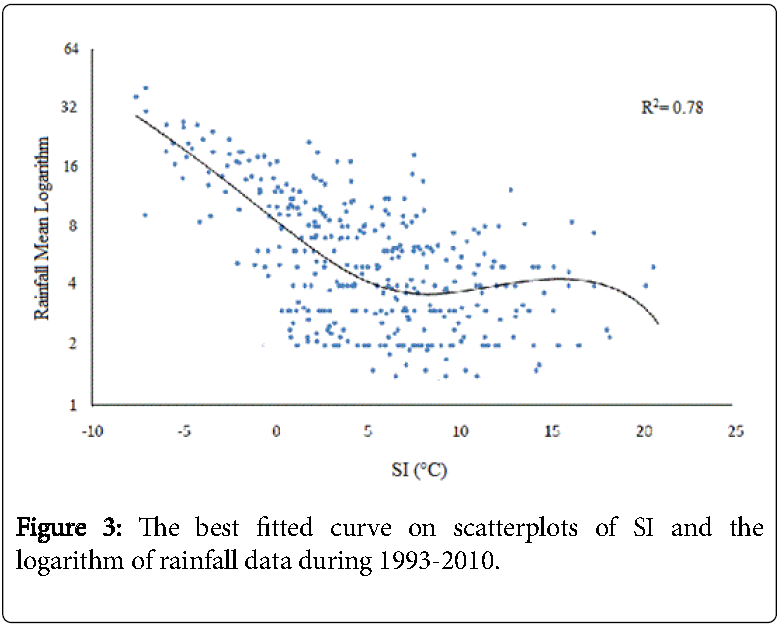
Figure 3: The best fitted curve on scatterplots of SI and the logarithm of rainfall data during 1993-2010.
The probability of the rainfall for different range of SI has been calculated (Table 2). There is no probability of rainfall for SI more than 4.5°C. The probability of rainfall increases with decreasing SI. There is a 75% probability of the rainfall (more than 7.8 mm) for SI less than 0.9°C.
| SI (°C) | RainfallRainfallmm 3.1-1.5Rainfallmm 7.8-3.1Rainfall >7.8 mm | |||
|---|---|---|---|---|
| More than 4.5 | 52% | 30% | 18% | Probability equal zero |
| 2.1-4.5 | 35% | 38% | 16% | 11% |
| -3 | 9% | 13% | 40% | 38% |
| -0.9 Less than | Probability equal zero | 6% | 19% | 75% |
Table 2: The probability of the rainfall (in mm) for different range of SI (in °C).
The optimal threshold of KI
The KI increases by increasing the first and second terms (lapse rate and initial humidity) and by decreasing third term (saturation deficit in 700 mb) (Eqn 3). The higher KI accompanied with more rainfall [12]. The large K values indicate that more humidity transferred with updraft from 850 mb to 700 mb pressure level in cloud.
An order 3 Polynomial is the best fitted curve to rainfall and KI data by R2=0.81 (Figure 4). The rainfall almost is constant for K less than 10°C due to insufficient of age and thickness of cloud. The increase in K (more than 10°C) is accompanied by increasing rainfall (Figure 4). Therefore, the optimal threshold for K could be 10°C.
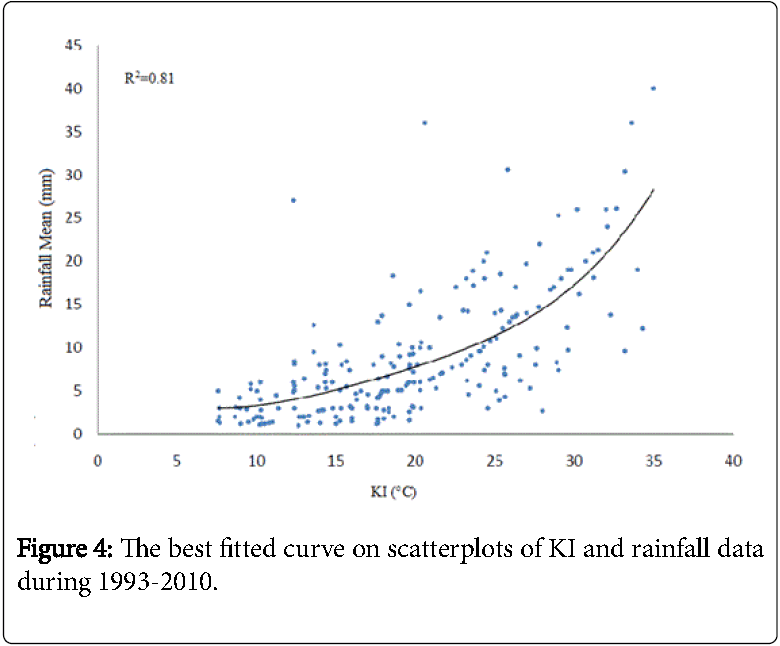
Figure 4: The best fitted curve on scatterplots of KI and rainfall data during 1993-2010.
The KI is divided to four intervals to determine rainfall probability in specific ranges (Table 3). There is a 52% probability of the rainfall for KI more than 22.5°C, and a 3% probability of the rainfall for KI less than 9.9°C.
| K Index (KI) | RainfallRainfall mm 4-1Rainfall mm 8-4Rainfall >8 mm | |||
|---|---|---|---|---|
| More than 22.5 | 9% | 7% | 32% | 52% |
| 16.30-22.5 | 18% | 33% | 25% | 24% |
| 9.9-16.3 | 20% | 41% | 24% | 15% |
| 9.9 Less than | 62% | 28% | 7% | 3% |
Table 3: The probability of the rainfall (in mm) for different range of KI (in °C).
The optimal threshold of CAPE
Since, the amount of CAPE related to the type of rainfall (Convective or Frontal) we have analyzed data for warm and cold seasons separately. The orders 4 and 3 Polynomial are the best fitted curves to the rainfall and CAPE data in warm and cold season, respectively (See Figure 5). CAPE is directly related to the maximum potential vertical speed within an updraft; thus, higher values indicate greater potential for severe weather [2]. The rainfall increases gradually by increasing CAPE in both seasons. The sharp increasing in the rainfall was found for CAPE More than 550 Jkg-1. There is a constant rainfall range for CAPE between 200-500 Jkg-1 in warm and cold seasons. It seems that rainfall typically occurs in low amount of CAPE and for some infrequent events it is more than 500 Jkg-1, especially in warm season. There is some rainfall events with the amount of CAPE close to zero in cold season. We couldn’t find any threshold for CAPE which shows minimum potential of the rainfall in cloud in the Mashhad region because the most type of rainfalls are frontal in the area and the parcel is forced to lift by mechanical.
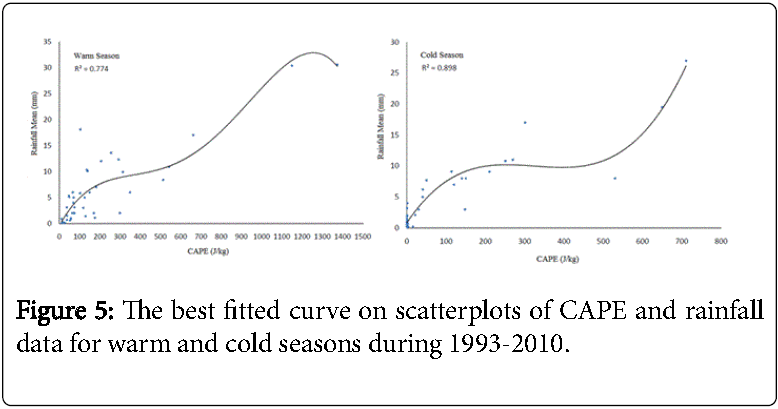
Figure 5: The best fitted curve on scatterplots of CAPE and rainfall data for warm and cold seasons during 1993-2010.
The probability of the rainfall for different range of CAPE has been calculated (Table 4). There is a 100% probability of rainfall (more than 8 mm) for CAPE more than 238.57 Jkg-1.
| CAPE | Rainfall <1 | Rainfall4-1 | Rainfall8-4 | Rainfall >8 |
|---|---|---|---|---|
| More than 238.57 | Probability equal zero | Probabilityequal zero | Probability equal zero | 100% |
| 83.32-238.57 | Probability equal zero | 27% | 73% | Probability equal zero |
| 63.12 -83.32 | 22% | 64% | 14% | Probability equal zero |
| 63.10 Less than | 79% | 21% | Probability equal zero | Probability equal zero |
Table 4: The probability of the rainfall (in mm) for different range of CAPE (in Jkg-1).
The optimal threshold of some instability indices during effective rainfall is calculated for cloud seeding decision. The thresholds for PWC, SI and KI are obtained 10 mm, 7°C, 10°C, respectively. In another research, threshold of PWC was calculated 9 mm in Esfahan city of Iran [17-19]. High values of KI and CAPE and also more negative values of SI indicate more rainfall. The results show that rainfall may occur under low amount of CAPE even zero because the type of rainfall in our region (Middle latitude) is more frontal (Mechanical lifting mechanism) and it is not related to convection in the most events, especially in winter.
