Research Article - (2015) Volume 3, Issue 3
Keywords: Typhoon; Islands; Subtropical
The Tibetan Plateau acts as a heat sink in winter and a heat source in summer. The heating effect of Tibetan Plateau plays an important role in the intensity and progress of East Asian monsoon. For example, anomalously extensive snow cover over the Tibetan Plateau during the preceding winter and current spring causes a slow progress of East Asian monsoon and a weak summer monsoon by reducing the heating over the Plateau. Correspondingly, the subtropical high over the western Pacific is intensive, but is located to the south of its normal position. There was a tendency for the WNP typhoon season to be less (more) active when the snow cover (SC) over the Tibetan Plateau (TP) was above (below) normal in the preceding winter and current spring [1]. Similarly, fewer (more) typhoons made landfall in China (including Hainan and Taiwan Islands) when the preceding winter had an above (below) normal snow cover on the TP. It also appears that heavy TP snow cover not only suppressed the overall WNP typhoon activity, but also delayed the onset of typhoon landfall in China. Historical records show that, there was, in general, a negative correlation between the number of landfall typhoons in China and the TP-SC in the preceding winter and spring [2]. The regions with the most significant correlation appear to be near 103ºE over the Eastern TP throughout the winter and near 92º–95ºE and 80ºE during the spring.
Inter annual variability of WNP typhoon activity is also known to be influenced by anomalous sea surface temperature (SST) and other climatic conditions [1,3-8]. Active WNP typhoon seasons are often associated with above-normal local SST and vice versa [5]. El Niño and Southern Oscillation (ENSO) events are known to strongly modulate the annual hurricane frequency in North Atlantic [9], but the influence of ENSO on the WNP typhoon activity shows a more complex picture. The tropical cyclogenesis in the WNP basin as a whole does not show a significant dependence on ENSO [10-12]. However, there is a strong ENSO signal at sub-basin scales [13]. In El Niño years, fewer tropical cyclones form to the west of 160°E, while more form in the region between 160ºE and the dateline. The opposite was found to occur during periods of La Niña. Previous study showed that the WNP TC activities from July to December are noticeably predictable using preceding winter–spring Niño3.4 SST anomalies, while the TC formation from March to July is exceedingly predictable using preceding October–December Niño3.4 SST anomalies [13].
The WNP typhoon data is from National Climatic Data Center (NCDC) of the United States National Oceanic and Atmospheric Administration (NOAA), which contains track and intensity of WNP tropical cyclones since 1945. For each storm, the data contains 6-hourly (0000, 0600, 1200, 1800 UTC) center locations (latitude and longitude in tenths of degrees), intensities (maximum 1-minute surface wind speeds in knots and minimum central pressures in hPa). Typhoon landfall along ECS is defined as a TC with a maximum sustained wind speed of at least 32 m/s as crossing of the storm center over the coastline.
Snow cover data is derived from the satellite-estimated percentage monthly snow cover within each 1º × 1º grid cell on the Tibetan Plateau from 1976 to 2012.In this study, 1º × 1º resolution snow cover data for the region (20º–40ºN, 75º–115ºE) covering the entire TP for the period of 1976–2012 is utilized. Geo potential height fields from 1950-2014 are derived from the National Center for Environmental Prediction (NCEP)/National Center for Atmospheric Research (NCAR) reanalysis data, archived at NCDC.
Other data sources used in this study include:
1) Japan Meteorological Agency (JMA) ENSO
2) SST from NCEP/NCEP Reanalysis Project
3) Trade wind index: It is the averaged daily 850 hPa wind anomalies in the tropical western Pacific (135°E-180°W, 5°N-5°S), Note that positive values of the 850 hPa zonal wind indices imply easterly anomalies.
4) QBO indices: computed from the zonal average of the 30mb zonal wind at the equator as computed from the NCEP/NCAR Reanalysis.
Follows [2], the Pearson correlation coefficient between the ECS landfall count and the spring TP-SC is recalculated using the 37- year data from 1976 to 2012, which yields a value of -0.47 (p<0.005), snow cover index is delivered from domain: (92º – 95ºE, 34º-38ºN). The negative correlation keeps significant. The 1978 and 2001 WNP typhoon seasons showed a startling contrast in the number of typhoons that made landfall along East China Coastline (ECS) (including landfalls on Taiwan and Hainan Islands) (Figure 1). Only two typhoons made landfalls in China in 1978, 47% below the 55-year (1950-2004) climatological average of 3.8. However, seven typhoons made landfalls in 2001 almost doubled the climatological mean. It is evident that the difference between 1978 and 2001 was mainly in the intensity of the tropical cyclone. The number of tropical cyclones including tropical storms and hurricane-intensity typhoons was 32 for 1978 and 33 for 2001, showing no significant difference. However in 1978 Figure 1 only 47% (15) of the total 32 TCs reached typhoon intensity, below the 55- year (1950-2004) average of 64% (17.5 typhoons). Only three typhoons reached category 3 or higher comparing with a climatological mean of 9.5. Only one storm was able to become a super typhoon (category 5) comparing with a climatological mean of 2.7. In contrast, in 2001, 21 of the 33 (61% of the total) TCs reached typhoon intensity, and over half (11) reached category 3 or higher, with 2 became super typhoons.
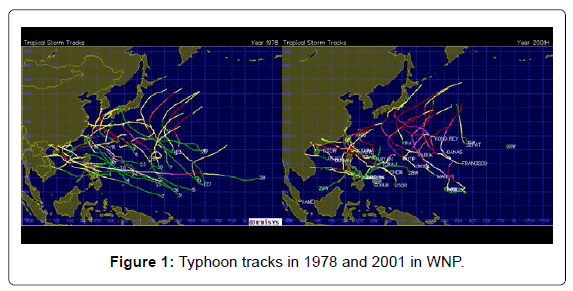
Figure 1: Typhoon tracks in 1978 and 2001 in WNP.
It is important to note the difference in the spatial and temporal distribution of the TCs between the 1978 and 2001 typhoon seasons. All but only one typhoon in 1978 developed from July to October took a northwestward track and curved northeastward when approaching China coast. During the whole season only two typhoons (#14 in August and #21 in September) made landfall on ECS. In contrast, twenty typhoons developed in a seven month period in 2001, with a total of seven made landfalls. It is also notable that six typhoons developed in early summer (June and July), and five of these six typhoons made landfalls on ECS. A question is raised: what caused such a difference in the early season? The potential causes for the differences between 1978 and 2001 are discussed below.
ENSO and regional SST anomalies
ENSO in 1978 and 2001 seasons both displayed a neutral phase. There is no evidence suggesting that neutral ENSO events and the western North Pacific regional SST pattern are significantly correlated [10,11]. Thus, the differences between the typhoon activity during the 1978 and the 2001 typhoon seasons could not be attributed to the influence of ENSO. Local SST anomalies in the WNP are known to affect the tropical cyclogenesis in WNP [13]. A significant feature of SST distribution in the first half of 1978 was the presence of a persistent below normal SST field centered around 20°N and extended west of (Figure 2) 130°E (Figure 2a). This below normal SST in the western part of the tropical North Pacific south of 22ºN continued into the peak typhoon season from July to October 1978 Figure 2b.
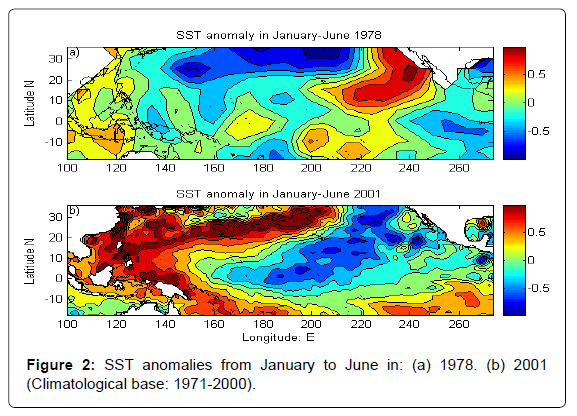
Figure 2: SST anomalies from January to June in: (a) 1978. (b) 2001 (Climatological base: 1971-2000).
In accordance with this SST anomaly pattern, the majority of the typhoons in 1978 formed north of 20°N, avoiding the cooler than normal water located to the south. In the first half and during the period of August-October, 2001, the WNP was featured by an above normal SST while the eastern North Pacific (ENP) was featured by a below normal SST Figures 3a and 3b. Tropical cyclone mainly formed and developed in above normal SST region (Figure 3). The differences in the anomalous SST distribution could be one possible cause to result in differences in typhoon activity between 1978 and 2001.
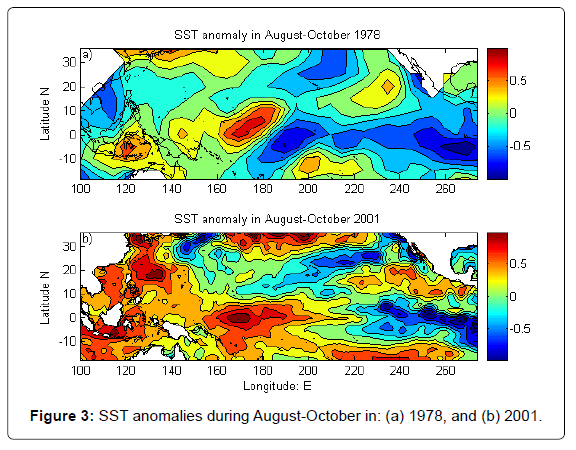
Figure 3: SST anomalies during August-October in: (a) 1978, and (b) 2001.
Snow cover on tibetan plateau (TP): (Figure 4) show an above normal SC in 1978 4 and a below average SC in 2001, respectively. The snow cover (January-March) over the Tibetan Plateau demonstrated a strong negative correlation with the number of typhoons landed on the ECS [3].
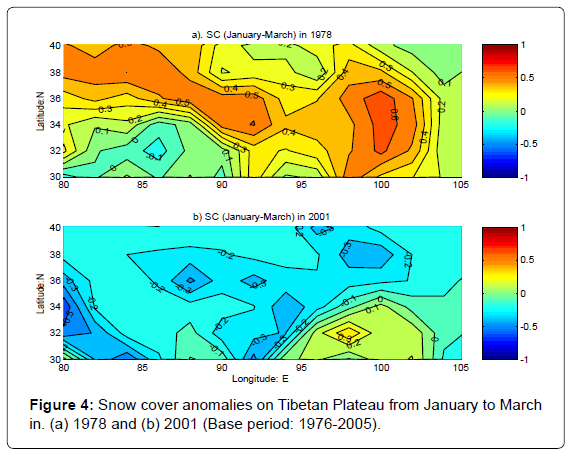
Figure 4: Snow cover anomalies on Tibetan Plateau from January to March in. (a) 1978 and (b) 2001 (Base period: 1976-2005).
The TP-SC influences WNP TC track patterns primarily through the large-scale WNP-EASM circulation, which is associated with shift of the East Asian and WNP subtropical high (EASH) position [1,14,15]. High (low) TP-SC is associated with East Asian summer drought (flood) Figures 5a and 5b. This is especially true for 1978/2001 cases. High snow over the TP changed atmospheric circulation of land-atmosphere-ocean interaction and restricted the EASM from development, typhoon activity, as a consequence, was suppressed. Chan and Gray indicted that the mid-tropospheric 500 hPa flow is associated with TC steering flow [13]. Since the TC track associated with the large-scale atmospheric conditions vary with seasons, it is necessary to examine the variations in the 500 hPa flow in a monthly base (Figure 5).
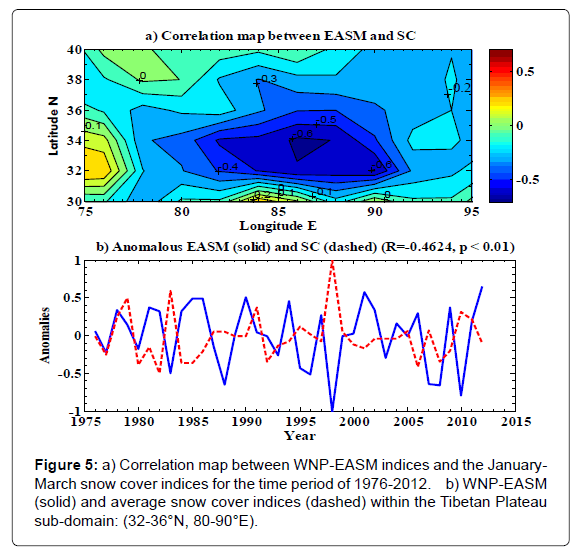
Figure 5: a) Correlation map between WNP-EASM indices and the January- March snow cover indices for the time period of 1976-2012. b) WNP-EASM (solid) and average snow cover indices (dashed) within the Tibetan Plateau sub-domain: (32-36°N, 80-90°E).
The June-July 5880 m GHT contours at 500 hPa between 1978 and 2001 demonstrated a substantial distribution pattern Figures 6a and 6b The East Asian/western North Pacific subtropical High (EA/WNPSH) situated at a more southwesterly position in June-July 2001. This pattern is usually associated with low TP snow cover. The southwesterly displacement of EA/WNPSH (Figure 6) prevents typhoons from making a northward curve; therefore typhoons took a more westerly track approaching the ECS. WNPSH position during the same period in 1978 displayed a significant northeastward shift, however, typhoons likely recurve northward instead of propagate further westerly. This condition prevents typhoons from making landfalls on the ECS. In July the 500 hPa GHT anomaly shows that tropical WNP east of the ECS dominated by a strong negative trough Figures 7a and 7c in 1978; however a southward displacement of subtropical high dominated that area Figures 7b and 7d in 2001. Five typhoons made landfalls in July 2001, however no typhoon made landfall in July 1978 though three typhoon developed during this time period. The above comparison demonstrated that monthly variability of typhoon tracks are strongly tied to GHT distribution pattern (Figure 7).
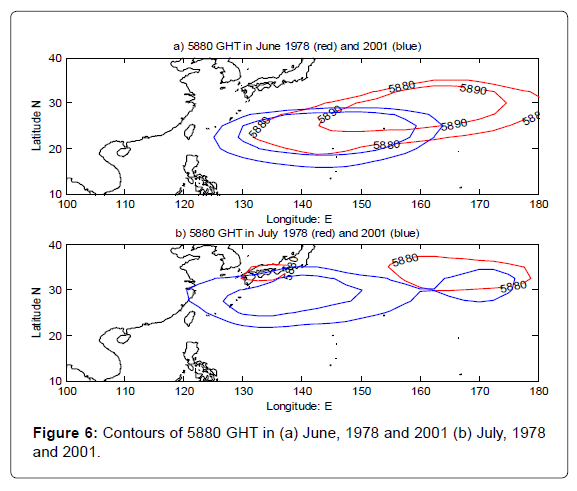
Figure 6: Contours of 5880 GHT in (a) June, 1978 and 2001 (b) July, 1978 and 2001.
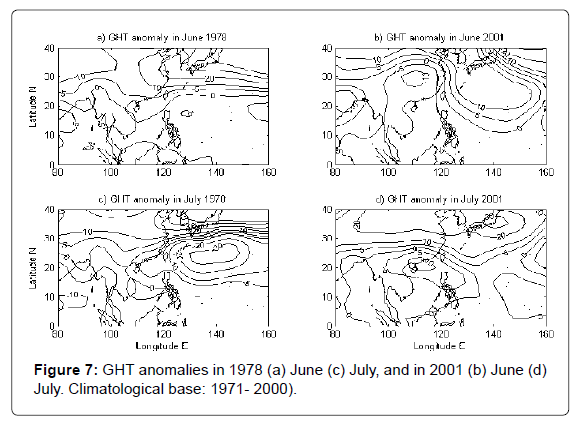
Figure 7: GHT anomalies in 1978 (a) June (c) July, and in 2001 (b) June (d) July. Climatological base: 1971- 2000).
850hPa trade wind indices (TWI): The 850hPa TWI was identified significantly associated with the WNP typhoon activity. Westerly (easterly) phase of trade wind usually corresponds to strong (weak) TC activity. Trade winds in the peak typhoon season (July-October) in 1978 and 2001 were both in an easterly phase (0.2631, 0.4750), which is generally suppressed typhoon development. TWI was, therefore, not a key factor to influence the overall TC activity in 2001. However it might be one of the factors to suppress typhoon activity in 1978.
The stratospheric quasi-biennial oscillation (QBO): Easterly QBO from January to February demonstrates a strong association with increased TC activity in the WNP [1]. This correlation is especially robust during the neutral ENSO years. The QBO during the period from January to February in 1978 demonstrated a strong westerly phase, which implied an inactive typhoon season. However QBO during January-February in 2001 displayed a strong easterly phase, which signaled a favorable condition for TC formation. Therefore, QBO may attribute to the overall typhoon activity in those years.
Arctic oscillation (AO): AO indices demonstrated a negative phase (-0.52) in 1978 and a positive phase (0.48) in 2001. As discussed in Yan [1], the positive phase of AO in March is associated with more TC tracks accumulated in eastern portion of the WNP. The majority of typhoon tracks in 1978 stayed off the ECS. The positive AO phase in 2001 is favorable for typhoons to propagate with a more westerly track. However, typhoon tracks east of 130ºE may be dominated by other climate factors.
The 2001 WNP typhoon season featured seven landfall typhoons on ECS (climatological average is 3.8). This is one of the largest numbers of landfall typhoons observed in any typhoon seasons (June- December) since 1961, and the twenty typhoons observed were 2.5 times the long-term average. Of these seven ECS landfall typhoons, five occurred in June and July - the most observed during this period in the WNP typhoon history. Typhoon tracks in 2001 split into two clusters: one occupied west of 130ºE and the other accumulated east of 130ºE. The majority of the east group typhoons are typhoons of category-3 or higher, all those intense typhoons developed from beginning of August while all except one of the west group typhoons were typhoons of category-1 or category-2, seven out of the total nine west group typhoons landed on ECS, five of those total six June-July west group typhoons and all the two September west group typhoons made landfalls on ECS. The east group typhoons demonstrated a strong curving track pattern, which resulted from a systematic southeastward displacement of the mid-tropospheric subtropical low positioned east of Japan during August and September. The west group typhoon track patterns in June and July were associated with a southeasterly extension of the subtropical ridge in the WNP, which strongly linked to the low TP snow cover in early of the year and the active East Asian Summer Monsoon. The development of southerly flow to the west of the mean ridge axis over the WNP and a tropical low centered on (115ºE, 20ºN) dominated the South China Sea west of Taiwan created a perfect steering condition for typhoons to approach ECS. This process is more evident during the early typhoon season, consistent with the observed burst typhoon activity in July 2001.
In contrast to seven landfall events in 2001, only two typhoons made landfall on ECS during the entire typhoon season of 1978. The majority of named storms that formed in the tropical WNP exhibited a strong curving tendency when passing by northeast Taiwan. The majority of typhoons in south of Taiwan that propagated along the northwestward tracks weakened dramatically as they approached the South China Sea. Super typhoon #9 formed in July was an exception. Compared to 2001, the WNP subtropical high during June-July in 1978 retreated to a more northeasterly position compared to its counterpart in 2001. This distribution pattern is likely a cause for the northward curving typhoon tracks, which prevented typhoons from making landfall along ECS. The displacement of subtropical high position surrounding the ECS has been identified associated with the high snow cover over the TP through large-scale atmospheric flow fluctuation that greatly influenced by the East Asian Monsoon system [1,3,14,15]. The variability of local SST distribution and the upperlevel winds that tend to steer tropical cyclone movement and inhibit its development over a region may vary without the influence of El Niño. This is why the number of landfall tropical cyclones formed over the WNP during neutral ENSO years varies dramatically from year to year. Combined with local SST patterns, the TP snow cover is likely the key factor to dominate the typhoon track patterns in 1978 and 2001. The sparse landfall events in 1978 may also be attributed to the negative AO phase, which is associated with more easterly tracks. The neutral ENSO events in 1978 and 2001 have minor effect on the East Asian Summer monsoon; it seems not to be the key factor to explain the difference in the number of landfall events between those two years.
Perhaps the primary factor for the increased typhoon activity during 2001 can be attributed to a favorable, large-scale pattern of extremely warm sea surface temperature (SST) distributed throughout the WNP. This above normal SST reflects an abundant thermal energy condition that is favorable for typhoon formation and development and also associated with an abundant rainfall in East Asian and the WNP. Observations of typhoon intensity and tracks coincided well with SST distribution pattern. Compared to 1978, the warm SST in 2001 was well developed prior to the typhoon season and persisted throughout the typhoon season, which ultimately provided a favorable condition for tropical cyclogenesis and intensification. The abnormally warm SST also helps to lower surface pressures hydrostatically by directly warming the lower troposphere. The reduce meridional pressure gradient of modified SLP acts to reduce low level trade winds, thereby contributes to a further warming of the ocean. In addition to the large-scale abnormal warm SST, the enhanced WNP typhoon activity in 2001 has also been linked to the negative phase of the QBO in January and February which intensified the TC activity and favorable for cyclogensis.
Analysis on the 1978/2001 WNP typhoon seasons supports the discovery of a strong negative correlation between the extent of snow cover in the preceding winter (DJF) and spring (MAM) on the Tibetan Plateau and the annual landfall frequency on ECS. This inverse correlation can be explained by the response of the WPSH to the snow-modulated land surface thermodynamic processes over the Tibetan Plateau and the anomalous SST in the WNP. Increased winter snow cover over the Tibetan Plateau leads to reduced heating during the melting period in the spring and summer, which is followed by a weak summer monsoon and a weak WPSH, which, in turn, leads to a reduced number of landfall typhoons along ECS, particularly during the early summer (May-July). Comparison of major climatic factors in 1978 and 2001 showed that the difference in the ECS landfall numbers between 1978 and 2001 typhoon seasons may result from TP-SC and its associated climatic conditions.
The observed seasonal lag correlation between TP-SC and landfall typhoon frequency on ECS is -0.47 based on 37-year period of snow and typhoon data (1976-2012), which suggests that ECS landfall typhoon can be predicted using the amount of winter and/or spring TP-SC as one of the primary predictors.
This study is supported by School of Coastal & Marine Systems Science, Coast Carolina University.
