Research Article - (2013) Volume 1, Issue 2
Keywords: Integrated; Attributes; Faults; Closure; Amplitude
Conventional seismic stratigraphic interpretation of data has been the popular way of interpreting seismic data for the purpose of mapping geological structures, subsurface stratigraphy and reservoir architecture. The geometrical expression of seismic reflectors is qualitatively mapped in time with little or no emphasis on the inherent seismic amplitude variations [1]. However, the introduction of the 3D seismic revolution has made the use of amplitudes an integral part of seismic interpretation and has allowed more valuable geological information to be discerned as seismic attributes (i.e. phase, amplitude, instantaneous frequency, etc.).
Seismic attributes form an integral part of qualitative interpretative tool that facilitates structural and stratigraphic (channels, pinch out, meanders, etc) interpretation as well as offer clues to lithology type and fluid content estimation with a potential benefit of detailed reservoir characterization [2]. For instance, fault structures which have been classified into seismically resolvable and sub-seismic scale (subtle) faults [3] can be interpreted more effectively with the aid of seismic attribute. Though the seismically resolvable faults may be interpreted using traditional diagnostic criteria (e.g. abrupt reflector cut off, kinks etc.), but the subtle faults which are often of geological or exploration significance are usually not visibly imaged by the conventional seismic sections and time slices displays. This is because they have smaller throws relative to the resolution limit of the seismic survey, which is a factor dependent on the frequency content, signal to noise ratio (SNR) of the dataset and also the depth to the reflecting horizon. The subtle fault identified in the southwestern part of the field along fault F5 motivated this study.
In this paper, we have subjected interpreted horizons (using conventional structural seismic interpretation technique) to seismic attribute generation and analysis. Seismic attribute analysis helps to identify structural features missed using the conventional method of interpretation. It is important to note that not only does seismic attribute analysis help to identify structural features; it also helps to increase the chances of success and development of new prospect areas in the study area.
Seismic attributes are defined as all the information obtained from seismic data, either by direct measurements or by logical or experience based reasoning [4]. Seismic attributes are essentially derivatives of the basic seismic measurements i.e. time, amplitude, frequency and attenuation which also form the basis of their classification [5]. It was also defined by [6]; as a measurement based on seismic data such as envelope, instantaneous phase, instantaneous frequency, polarity, dip and dip azimuth, etc. It is important to note that attribute interpretation supplements conventional structural interpretation and the discriminating properties of the attributes set may be critically checked for its relevance for a particular problem of a prospect.
The seismic data is treated as an analytic trace which contains real components (original input trace) and the complex (imaginary) component, usually generated from the Hilbert transforms from which various amplitudes, phase and frequency attributes can be deduced [7]. This complex trace allows the amplitude, phase, frequency and reflector polarity attributes of a seismic data to be calculated in a rigorous mathematical sense. Assuming a seismic trace of the form:
 (1)
(1)
A(t) is the envelope of g(t) and varies slowly with respect to cos 2πvt
For constant A(t), the Hilbert transform of g(t) is given by:
 (2)
(2)
Thus we can form a complex signal h(t) where:
 (3)
(3)
h(t) is known as the analytical or complex trace [8].
g⊥(t) is the quadrature trace of g(t) (Figure 1). If v is not constant but varies slowly, we define the instantaneous
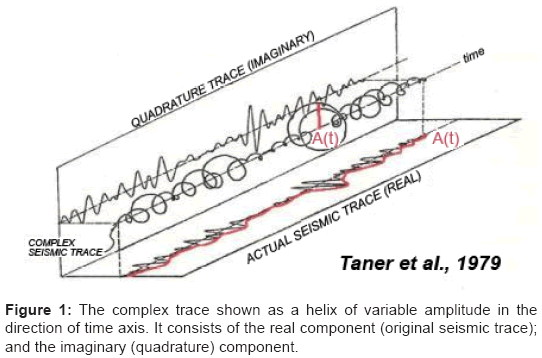
Figure 1: The complex trace shown as a helix of variable amplitude in the direction of time axis. It consists of the real component (original seismic trace); and the imaginary (quadrature) component.
frequency v(t) as the time derivative of the instantaneous phase γ(t) thus:
 (4)
(4)
The quantities A(t), γ(t) and v(t) and other measurements derivable from the seismic data are referred to as attributes [9].
A simpler mathematical description of the complex trace g(t) of a seismic trace is stated thus:
 (5)
(5)
Hence the amplitude a(t) is given by:
 (6)
(6)
The phase Φ(t) is given by:
 (7)
(7)
While the instantaneous frequency (f) is the time derivative of the instantaneous phase thus:
 (8)
(8)
Location and geology of study area
The study area is within the Niger Delta Basin in southern Nigeria. The Niger Delta is one of the most prolific hydrocarbon provinces in the world. It has a regressive clastic succession of about 10-12 km thick, comprising a shelf, broad slope area and basin floor [10]. The Delta lies on a thick prism of clastic sediments which forms the prominent seaward bulge in the continental margin off southern Nigeria [11]. The Niger Delta is an active Paleocene to Recent, wave dominated delta situated on the Atlantic coast of West Africa. Sedimentation in the Niger Delta began following the Albian rift fill deposits [12], between latitudes 3° and 6° N and longitudes 5° and 8° E and extends throughout the Niger Delta Province as defined by Klett et al. [13].
Generally, sediment inflow is North-South as the clastic sediments are sourced from the high mountains from the north into rivers Niger and Benue. These two rivers merge at a confluence and continue the sediment transportation to form the Delta as it enters into the Atlantic Ocean. The Niger Delta Province contains only one identified petroleum system [14,15]. This system is referred to here as the Tertiary Niger Delta (Akata–Agbada) Petroleum System. The base of the sequence, consist of massive and monotonous marine shales (Akata Shales) except at the deepwater of the north western area where it has been found to overlie and onlap an older progradational package [10]. This grades upward into interbedded shallow marine and fluvial sand, silts, and clays, which form the typical paralic facies portion of the delta (Agbada Formation). The uppermost part of the sequence is a massive non-marine sand section (Benin Formation). The total thickness of this composite sequence is not precisely known, but may reach 12 km in the basin center with an estimated area of about 75000 km2 as defined officially by the Nigerian government. Gravity and magnetic data suggest that the maximum thickness lies in the area between Warri and Port Harcourt. The oldest continental sand in the Benin Formation is Oligocene. The Agbada Formation ranges in age from Eocene to Pleistocene and forms the hydrocarbon prospective sequence in the Niger Delta. The Akata Formation ranges in age from Palaeocene to Holocene [16]. However, studies from a producing deepwater field have ascribed upper Oligocene age to the lowermost part of the Agbada unit and inferred the Akata interval to be pre-Miocene in the lower delta slope [17].
The study area is located in the onshore region of the Niger Delta (Figure 2). It covers about 56 km2 of the coastal swamp belt onshore eastern Niger Delta. The oil mining license was obtained in June 1967, development and production of Oil commenced immediately. The real name of the field is not given for proprietary sake but named Z-field for the purpose of this study.
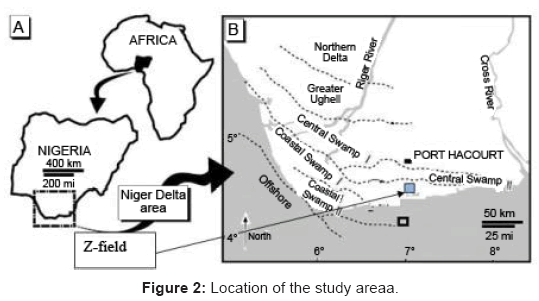
Figure 2: Location of the study area.
The materials provided for the study include; Well data (LAS files) for six wells named as Z1, Z2, Z3, Z4, Z5 and Z6 in this project, check shot data for Well Z1, deviation data for Wells Z4 and Z6, 56km2 3D seismic data with good resolution processed as 32-bit integer and base map of the study area.
The datasets were loaded into the interpretative tools, in this case, Landmarks Geographix and Schlumberger Petrel. Interpretation of the well data was carried out from correlation to evaluation of petro physical parameters such as water saturation, net pay, net to gross, volume of shale and effective porosity. These results were later integrated into seismic using the available check shot data. Six hydrocarbon bearing reservoirs were identified and correlated across the field. These reservoir levels were tied to seismic and mapped across the field. Time and depth structure maps were generated from the interpretation. Seismic attributes such as amplitude, envelope, dip, azimuth and variance were extracted based on horizon interpretation.
The extracted attributes were analyzed and it was observed that variance showed better response to faults than any other attribute used for the study.
Petro physical evaluation
Wire line logs for six wells were used to delineate six hydrocarbon bearing reservoirs in the field (Figure 3). Table 1 below shows the summary of the petro physical evaluation carried out on three of the reservoirs penetrated by the six wells Table 2.
| Wells | Depth registration | Available Logs |
|---|---|---|
| Z1 | 308ft-13019ft | CALI, GR, LITH, LLD, PHIE, PHI_SNS, SP, SW, SWARCH, VSH, VSHSTB, checkshot data |
| Z2 | 46ft- 12996ft | DT, GR, LITH, LLS, RES, SP, VSH. |
| Z3 | 51ft-13000ft | CALI, DRHO, DTU, GR, LITH, LLS, MSFL, NPHI, PHIE, PHI_SNS, RES, RHOB, SP, SW, SWARCH, VSH, VSHSTB, and deviation survey. |
| Z4 | 10ft- 11541.50ft | CALI, CILD, DT, DTL, GR, LITH, LLD, LLS, NPHI, PHIE, RHOB, SGR, SP, SW, VSH |
| Z5 | 3849ft-11675ft | CALI, DT, DTL, GR, LITH, LLD, LLS, MSFL, NPHI, PHIE, RHOB, RT, SGR, SP, SW, VSH |
| Z6 | 2800ft- 13089ft | CALI, GR, HDRS, HMRS, LITH, NPHI, PHIE, RES, RHOB, SP, SW, VSH and deviation survey. |
Table 1: Summary of the available well data and corresponding logs.
| Reservoirs | Net pay | N/G pay | N/G res | Phi pay | Sw | Vshl |
|---|---|---|---|---|---|---|
| D | 16 | 0.03 | 0.90 | 0.230 | 0.44 | 0.27 |
| E | 34 | 0.32 | 0.80 | 0.20 | 0.37 | 0.16 |
| F | 75 | 0.60 | 0.81 | 0.22 | 0.24 | 0.20 |
Table 2: Average values for parameters in reservoirs D, E and F.
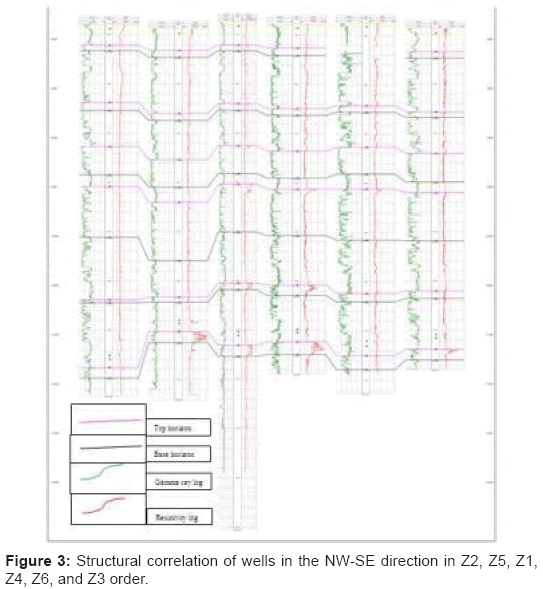
Figure 3: Structural correlation of wells in the NW-SE direction in Z2, Z5, Z1, Z4, Z6, and Z3 order.
The identification of reservoirs shows that only Well Z1 encountered hydrocarbon in the six reservoir levels. Only three reservoirs were penetrated by more than one well as summarized in Table 3.
| Horizons | Z1 | Z2 | Z3 | Z4 | Z5 | Z6 |
|---|---|---|---|---|---|---|
| A | HC | wet | wet | wet | wet | missing |
| B | HC | wet | wet | wet | wet | wet |
| C | HC | wet | wet | wet | wet | wet |
| D | HC | wet | HC | HC | wet | HC |
| E | HC | wet | wet | HC | missing | wet |
| F | HC | HC | HC | HC | HC | wet |
Table 3: Showing horizons in different wells with their corresponding fluid content.
The provided check shot for well Z1 was used to tie well picks to seismic. The plot of time against depth from the check shot is shown in Figure 4 and 5. Linear equation relating depth to time; y= mx+c, Y=4.5817x-1165.2
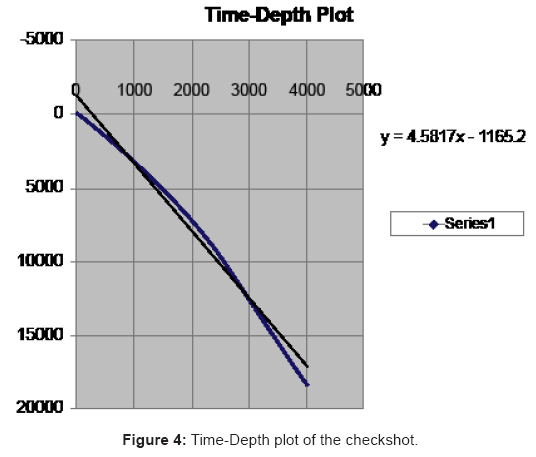
Figure 4: Time-Depth plot of the checkshot.
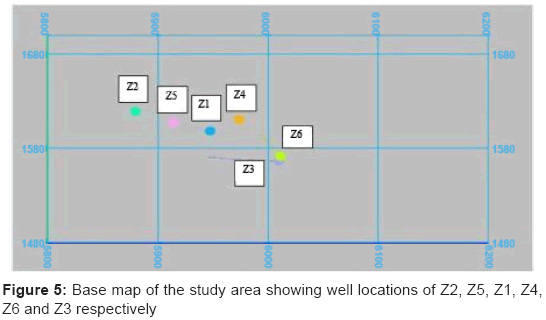
Figure 5: Base map of the study area showing well locations of Z2, Z5, Z1, Z4, Z6 and Z3 respectively.
Where Y= depth information from well data, X= time information from check shot, M=slope of plot, C= intercept.
Seismic interpretation
Seismic to well tie was done by using the check shot provided for Well Z1. Table 4, Figures 6b and 7 shows the horizons and corresponding time events on seismic.
| Horizon | Corresponding event | Time (ms) |
|---|---|---|
| 1 | Peak | 2155 |
| 2 | Trough | 2277 |
| 3 | Peak | 2368 |
| 4 | Peak | 2446 |
| 5 | Trough | 2644 |
| 6 | Trough | 2764 |
Table 4: Horizons with their corresponding event on seismic.
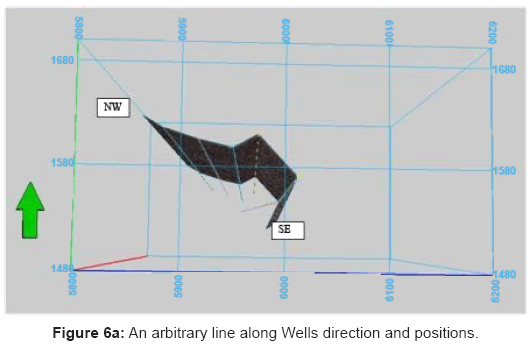
Figure 6a: An arbitrary line along Wells direction and positions.
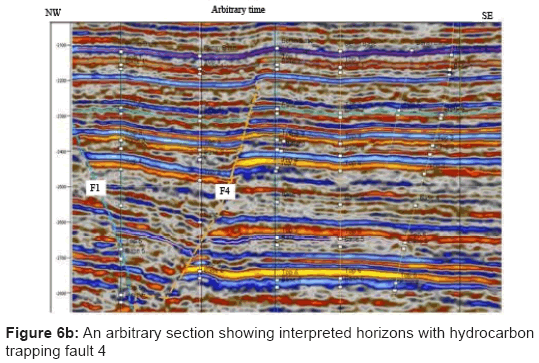
Figure 6b: An arbitrary section showing interpreted horizons with hydrocarbon trapping fault 4.
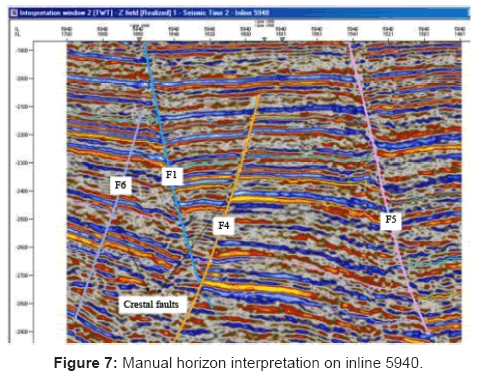
Figure 7: Manual horizon interpretation on inline 5940.
Fault interpretation
The structural framework was done by picking assigned fault segments on inline sections of seismic with the trace appearing on the corresponding cross lines. These faults are represented on the seismic sections as a discontinuous reflection along a preferred orientation of reflectors or as distortion of amplitude around the fault zones. A total of ten faults coded as F1, F2, F3, F4, F5, F6, F8, F9, F10 and F11 were identified (Figures 8a-8c), some extending through the extent of the field known as major regional growth faults, few flank faults appearing on few of the lines and listric crestal faults appearing within the seismic extent (Table 5). Two major regional growth faults F1 and F5 (Figure 7) were identified and correlated across the field forming the boundaries to the north and south of the field. The two major regional growth faults F1 and F5 and some other faults are dipping to the south away from direction of sediment supply, thus they are both regional faults while some of the other faults are dipping north, northwest, northeast, etc (Table 5).
| FAULTS | DIP DIRECTION | INLINE COVERED | FAULT TYPE |
|---|---|---|---|
| F1 | SOUTH | 5800-6200 | MAJOR REGIONAL GROWTH FAULT |
| F2 | SOUTH | 5800-5880 | CRESTAL FAULT |
| F3 | NORTH | 5800-5860 | FLANK FAULT |
| F4 | NORTHWEST | 5800-5950 | CRESTAL FAULT |
| F5 | SOUTH | 5800-6200 | MAJOR REGIONAL GRWOTH FAULT |
| F6 | NORTH | 5835-5990 | COUNTER REGIONAL FAULT |
| F8 | SOUTH | 6080-6200 | BACK TO BACK FAULT WITH F9 |
| F9 | NORTH | 6140-6200 | BACK TO BACK FAULT WITH F8 |
| F10 | SOUTH | 5800-5820 | FLANK FAULT |
| F11 | SOUTH | 5800-5820 | FLANK FAULT |
Table 5: Showing interpreted faults with corresponding seismic coverage.
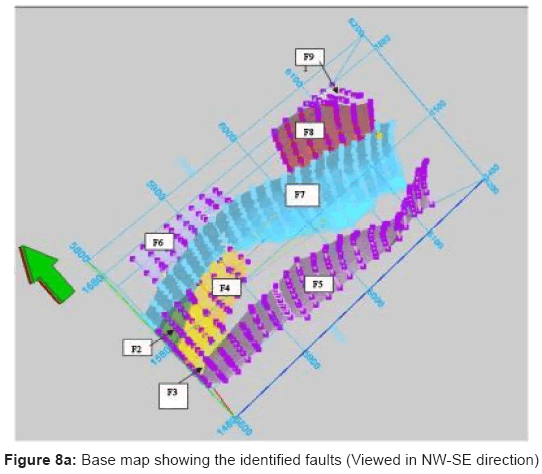
Figure 8a: Base map showing the identified faults (Viewed in NW-SE direction).
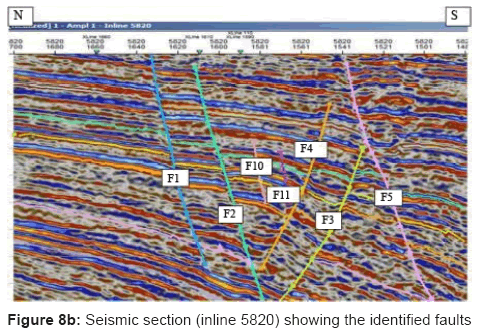
Figure 8b: Seismic section (inline 5820) showing the identified faults.
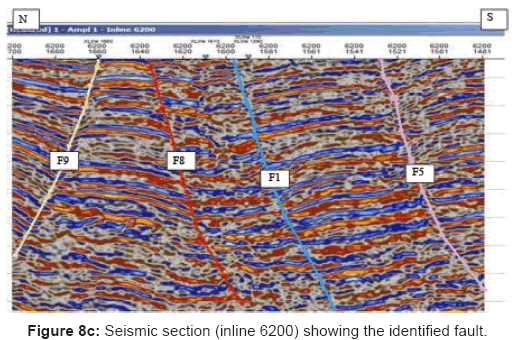
Figure 8c: Seismic section (inline 6200) showing the identified fault.
North dipping crestal fault F4 is an important trapping fault responsible for holding the hydrocarbon in Wells Z1, Z3, Z4 and Z6 named closure A. The upthrown block to the north of the field forms a prospect named closure B, trapped by the northern most regional growth fault F1 towards north eastern part of the field. The closure C prospect is a four-way closure to the spill point at shallow depth but becomes fault assisted on fault F1 and possibly fault F5 at deeper levels.
The hydrocarbon traps are basically fault assisted. Two prospects named closures B and C were identified based on closures formed in the northeastern part of the field and within the two regional growth faults F1 and F5.
Horizon interpretation
A total of six horizons were interpreted across the field (figure 7) with both time and depth maps generated for each of the horizon. Figures 9a and 9b shows the top surface maps of horizon 1 both in time and depth.
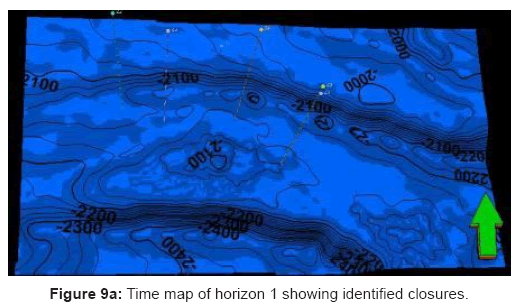
Figure 9a: Time map of horizon 1 showing identified closures.
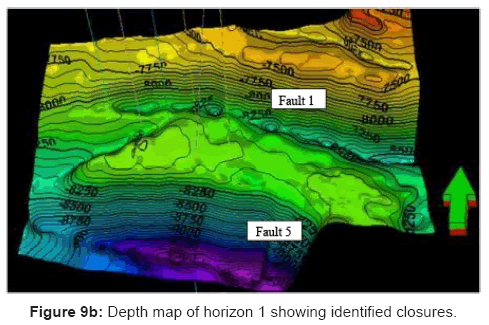
Figure 9b: Depth map of horizon 1 showing identified closures.
Attribute analysis
Five attributes (i.e. dip, azimuth, amplitude, envelope, frequency, and variance) were extracted and displayed as flattened maps (slice at 2155, 2277, 2368, 2446, 2644 and 2764 ms) for each of the interpreted horizons. Structures respond to acoustic wave in different ways thus, the five attributes extracted are best used to study different subtle and sub-seismic structures missed by conventional seismic interpretation. Structural features such as closures and faults were studied in the course of this investigation. Tables 6 and 7 show the summary of the attributes and corresponding structural features they enhance. Figures 10 and 11 below shows that amplitude as an attribute can be used to identify prospect on a green field where no prior exploration work has taken place and also in areas where further exploration work is required.
| Attributes | Time slice(s)(ms) associated with the attribute |
|---|---|
| Amplitude | 2155, 2277ms |
| Azimuth | 2155, 2277, 2368, 2446ms |
| Dip | 2277ms |
| Variance | 2155, 2277, 2368, 2446, 2644, 2764ms |
| Envelope | 2155, 2277, 2446ms |
Table 6: Attributes and corresponding response to structural closures.
| Attributes | Time slice(s)(ms) associated with the attribute |
|---|---|
| Amplitude | 2155, 2368, 2446, 2764ms |
| Azimuth | No distinct pattern shown in all the slice |
| Dip | 2155, 2277, 2368, 2446, 2644, 2764ms |
| Variance | 2277, 2368, 2446ms |
| Envelope | 2277, 2368, 2446, 2764ms |
Table 7: Attributes and corresponding response to structural closures.
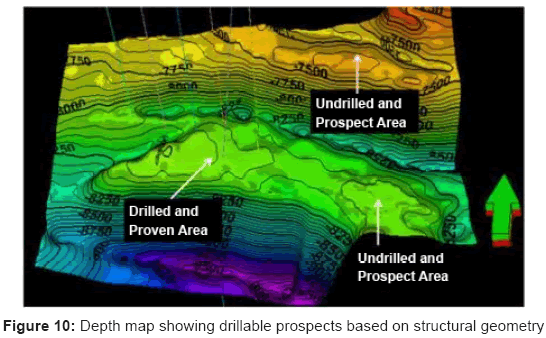
Figure 10: Depth map showing drillable prospects based on structural geometry.
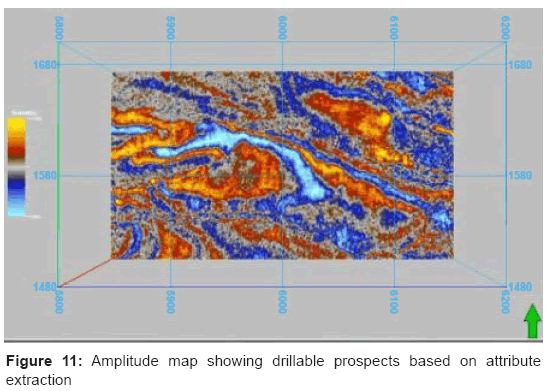
Figure 11: Amplitude map showing drillable prospects based on attribute extraction.
During the course of the research, it was observed that, using conventional seismic interpretation method, fault 5 diminished to the southeast of the field. This fault was interpreted to have terminated as shown in Figure 12 but upon extracted variance attribute, it was clearly visible that F5 did not terminate as previously interpreted.
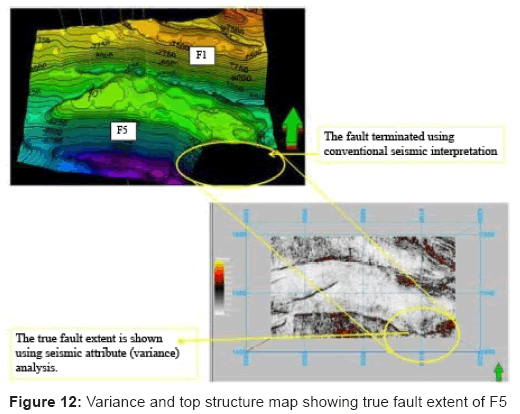
Figure 12: Variance and top structure map showing true fault extent of F5.
Interpretation of the 3D seismic data for locating both seismic scale and sub-seismic scale structural and stratigraphic elements has been demonstrated to be more efficient by the use of seismic attribute mapping and analysis. Variance attribute map has proved to be an appropriate tool to study fault architecture than dip attribute or any other attribute map in the study area. Therefore, to reduce the risk of drilling dry hole, resulting from missed fault by conventional seismic interpretation, seismic attribute analysis can be integrated into the standard practice of hydrocarbon Exploration and Production Company.
Thanks are due to the Department of Geosciences, University of Lagos for the opportunity to use their workstation facilities.
