Research Article - (2018) Volume 6, Issue 1
In order to map suitable areas for weather modification in East Africa Community (EAC), investigations were performed to determine spatio-temporal variability and relationship of aerosol, clouds and precipitation during March- April-May (MAM) and October-November-December (OND). Principal Component Analysis (PCA), Hybrid Single- Particle Lagrangian Integrated Trajectory (HYSPLIT) and Multivariate Regression Analysis (MRA) were used. Identification of near homogeneous zones of Aerosol Optical Depth (AOD), Fine Mode Fraction (FMF), Cloud Top and 3B42 Tropical Rainfall Measuring Mission (TRMM) yielded 13 (14), 20 (18), 11 (10) and 16 (17) significant Principal Components (PCs) for MAM (OND) with explained variance greater than 57%. Aerosols and clouds had positive relationship with precipitation in areas with strong factor loadings. MRA indicated independence of variables used and normality in the model residuals. Backward trajectory analysis indicated differences in origins of transported particles in the atmosphere with strong vertical mixing inlands with mixed aerosols resulting due to mountain blocking systems accounted for enhanced rainfall. Enhanced rainfall was attributed to highly varied AOD and unaffected FMF in the atmosphere. Locations east and west EAC with mean temperatures greater than -10°C were unsuitable for cloud seeding while central EAC region along the great rift-valley and coastal Tanzania exhibited optimal temperatures suitable for cloud seeding. Successful precipitation enhancement will increase available fresh water sources and thus alleviate existing and projected water stress.
Keywords: Aerosol; Cloud; Precipitation; Weather modification; Consequence
Precipitation influences quality of human life through the availability of fresh water [1]. In the tropics, it remains highly variable in space and time with many activities dependent on it [2]. The changes in tropical precipitation regimes and frequency of floods and droughts are observed to influence climate [3] significantly. Natural and anthropogenic govern formation of precipitation as well as modify radiation budget of the atmosphere by scattering and absorption of radiation [1]. These have an influence on the overall energy budget of the atmosphere-earth system. As a consequence, anthropogenic and natural changes in the amount, distribution, or properties of aerosol particles and clouds influence precipitation process and thus hydrological cycle [1].
Aerosols serve as Cloud Condensation Nuclei (CCN), modifying microphysical properties of cloud and thus thermodynamics of the atmosphere. Radioactive and microphysical effects of aerosols and response affect cloud composition, hydrological cycle, and atmospheric circulation systems [4]. Furthermore, cloud-dynamics feedbacks on multiple scales are also affected. Notably, aerosols have significant influence in some of the heaviest precipitation-producing events such as deep convective storms [5] in East Africa Community (EAC).
The response of clouds to changes in the ambient aerosol differs depending on the cloud type or aerosol regime [6,7]. Atmospheric aerosols have potential for suppressing/enhancing precipitation through changes in CCN concentration, cloud droplet size and droplet coalescence [1]. Studies suggest existence of temperature in seeding would not enhance precipitation. These include orographic and convective clouds whose tops are colder than -13°F (-25°C) due to sufficiently large concentrations of natural ice crystals and thus unsuitable for seeding. There are also indications that there is a warm temperature limit to seeding effectiveness attributed to low efficiency of ice crystal production at temperatures greater than 23°F (-5°C). Therefore, a temperature window of about 23°F (-5°C) to -13°F (-25°C) exist at which clouds exhibit seed ability. This temperature window can be extended by use of dry ice to below 32°F (0°C) or venting liquid propane approximately -2°C (2).
Interaction of aerosol particles and clouds involve processes on multiple scales. These may range from few nanometers to several micrometers up to the dynamics of cloud systems and the hydrological cycle (several kilometers) [8]. Cloud droplets grow into raindrops by coalescence that takes longer when starting from small droplets [9]. Notably, that small aerosol particle in high number concentrations produce small cloud droplets with a narrow size distribution [10] leading to delay in precipitation formation and thus decrease in rain amount. Moreover, large hygroscopic particles may result in large cloud droplets and a wider spectrum [10], and, therefore, may accelerate and enhance the formation of rain. Studies indicate that air masses with low aerosol loading (clean, maritime) and air masses with high aerosol concentration (polluted, continental air) show different precipitation characteristics [11].
The magnitude of aerosol forcing in East Africa is not well known. However, model studies in Los Angeles with smaller active aerosols than EAC [12] accounted for an enhancement of nocturnal downwelling radiation of 13 Wm-2. Studies in India -where aerosol forcing may be similar to East Africa estimated a daily mean of down-welling radiation enhancement from aerosols of 6.5 to 8.2 wm-2 [13]. In EAC, burning biomass for warmth, cooking, and light (early evening) tends to fill the shallow nocturnal boundary layers with a visible layer of smoke [12]. Moreover, large smoke aerosols, smaller hygroscopic aerosols and larger coated organic aerosols may readily swell when the humidity reaches 80% [12].
In many countries, shortage of fresh water is an issue [14] making prospect of enhancing precipitation through cloud seeding. One possible measure to improve water supply, especially for agriculture, is to try to increase precipitation by cloud seeding. Over EAC, literature review on weather modification indicate studies to suppress hail dominated the period 1960s to 1980s, characterization of clouds over Kericho and Lake Victoria basin [2]. Notably, uncertainties involving cloud seeding remain unresolved, many countries continue with operational cloud seeding activities [14]. These aim at accelerating and enhancing precipitation production [10]. Success of operational cloud seeding has been limited by uncertainties in quantifying interactions that involve microphysical effects and response, as well as clouddynamics feedbacks on multiple scales [4]. Resolving uncertainties related to aerosol-cloud-precipitation requires knowledge of atmospheric weather conditions significant to weather modification that include spatial-temporal variability of aerosols, clouds and precipitation and their relationship. This study aims to investigate variability of aerosols, clouds, and precipitation and establish their relationship in space and time. Therefore, provide insights towards planned operational weather modification over EAC to augment available fresh water resources for sustainable development.
Area of study
The study domain covered EAC region and included Burundi, Kenya, Rwanda, Tanzania, and Uganda. It is bounded by latitudes 50N 120S and longitudes 280E 420E. The Figure 1 shows the topography [15] and stations used in the study. A complete list of all station locations is provided in Annex 1.
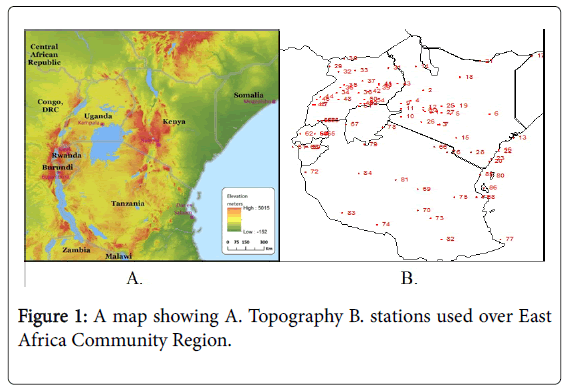
Figure 1: A map showing A. Topography B. stations used over East Africa Community Region.
East Africa has an enormous diversity of the topographic features. These include the eastern and western highlands that run north-south, parallel to the Great Rift Valley. On the highlands are snow-capped mountains; Mt Kilimanjaro and Mt Kenya whose altitude is about 5892 meters and 5202 meters above sea level respectively.
The effect of orography includes formation of local perturbations and creation of vertical components of wind speeds. These promote formation and development of clouds, precipitation and thunderstorms [16,17]. The study region has large inland water bodies such as Lake Victoria associated with musicale circulation. The highest variability in observed rainfall is also attributed to the existence of complex topographical features and existence of large water bodies [17,18].
Data
Quality assured gridded daily satellite-derived data used in the study included aerosol, cloud and rainfall spanning the period 2001 to 2012. Aerosol data included Aerosol Optical Depth (AOD) at 0.55 μm and Fine Mode Fraction (FMF) at a spatial resolution of 10×10 and Cloud data which included Cloud Top Temperature (CTT), Cloud Top Pressure (CTP) and Cloud Optical Depth (COD) [19]. Aerosol and cloud data was obtained from Moderate Resolution Imaging Spectro radiometer (MODIS) Collection 5.1 (C051). Orbiting at an altitude of 700 km in a polar sun-synchronous orbit, MODIS (on board Terra and Aqua satellites) detects aerosols over the entire globe on a daily basis with a broad swath of about 2330 km. For aerosol retrieval over ocean and land, MODIS makes use of different algorithms as the surface reflectance is different [20,21]. Comparisons with in-situ observations show the uncertainty in MODIS -derived AOD over ocean as ±0.03 ±0.05 AOD and that over the land as ±0.05 ±0.15 AOD. In order to attain maximal spatial coverage and better daily representation, MODIS observations from both Terra (equatorial crossing time 10:30 local time) and Aqua (equatorial crossing time 13:30 local time) are optimally combined by taking the mean value of observations from the two satellites in a 10×10 grid if data from both the satellites are available or by keeping the value from one of the satellites if the data from the other is missing [22,23] and thus enables attaining almost complete global coverage on a daily basis. TRMM 3B42 dataset with a 0.25°× 0.25° spatial resolution in a global belt extending from 50° south to 50° North latitude (Fisher 2004) was used. Rainfall data included satellite-derived rainfall estimates from Tropical Rainfall Measuring Mission (TRMM 3B42). The Precipitation Radar (PR), a multi-channel passive TRMM Microwave Imager (TMI) and a Visible Infrared Scanner (VIRS) are the three primary sensors of precipitation on the TRMM satellite as detailed in Kummerow et al. [24]. Worth noting, the number of years used for analysis were limited by the availability of satellite-based data and thus statistically robustness of time series analysis. However, it could be improved once more observations are available.
Methodology
Identification of near homogeneous zones of aerosol, cloud and precipitation was based on Principal Component Analysis (PCA) [25]. PCA coupled with a parallel analysis based on Monte Carlo simulations was used to determine principal components (PCs) to be retained and rotated [26]. Maximum factor loadings after rotation which is the correlation coefficients between the variables and factors was then used to determine the relation of selected variables (aerosols, clouds and precipitation) in the region. Time series analysis involved determination of trend and seasonality using Mann-Kendall (MK) test and coefficient of variation respectively (CV) [27]. In MK test, computed p-values greater than alpha (0.05) indicated no trend while computed p-values less than alpha (0.05) indicated the presence of trend [2]. The combined effect of aerosol and clouds on precipitation was determined through Multiple Linear Regression (MLR) analysis. This involved detection of variable collinearity using Variable Inflation Factors (VIFs), variable selection based on stepwise method and model selection using Akaike information criterion (AIC). Durbin-Watson test was used to assess model independence. Model‘s residual normality was checked visually using histograms and/or Quantile- Quantile (QQ) plots. Wilk-Shapiro test was used to check whether residuals come from a normal distribution. Goodness of fit of the models was assessed using the coefficient of determination, R2. Hybrid Single-Particle Lagrangian Integrated Trajectory (HYSPLIT) was then used for trajectory analysis. Backward trajectory analysis was done using the HYSPLIT model. The model was run backward in time for five days to identify the sources of atmospheric aerosols at 500, 1000 and 1500 Meters Above Ground Level (MAGL) for selected locations with high factor loading (>0.75) based on TRMM satellite-derived rainfall estimates.
Identification of near-homogeneous zones of aerosol, clouds, and precipitation
In this study, parallel analysis (Monte Carlo Simulation) was used to select significant PCs used to cluster satellite-derived aerosols, cloud and precipitation in EAC region into nearly homogeneous zones. The Table 1 presents results for optimum number of principal component retained based on aerosols, clouds and precipitation datasets.
| Parameter | Dataset | PC for MAM |
Explained Variance (%) | PC for OND |
Explained Variance (%) |
|---|---|---|---|---|---|
| Aerosol | AOD | 13 | 67.5 | 14 | 67.8 |
| FMF | 20 | 64.8 | 18 | 68.2 | |
| Clouds | CTT | 11 | 76.7 | 10 | 73.2 |
| Precipitation | TRMM | 16 | 57.3 | 17 | 57.1 |
Table 1: Identification of Significant PCs retained for Aerosols, Clouds, and Precipitation.
Application of the REOF and simple correlation analysis yielded 13, 20, 11, and 16 PC during MAM season and 14, 18, 10, and 17 PC during OND season that were retained for AOD, FMF, CTT, and TRMM 3B42 respectively (Table 1). The identified PCs were found to be significant at 95% confidence level based on Monte Carlo testing. Based on AOD, significant PCs retained accounted for 67.5% (MAM) and 67.8% (OND) of the total variability while significant PCs retained accounted for 64.8% (MAM) and 68.2% (OND) of the total variability. For CTT, significant PCs retained accounted for 76.7% (MAM) and 73.2% (OND) of the total variance while significant PCs retained accounted for 57.3% (MAM) and 57.1% (OND) of the total variance. The study noted that number of significant PC retained based on TRMM 3B42 for both MAM and OND season were higher compared to other studies such as Gitau et al. who found six PC for both MAM and OND season using daily observed rainfall. Therefore, it pointed to the different atmospheric dynamics responsible for the behavior of climate during the various seasons of the year. Moreover, the variations can also be attributed to the fact that the spatial coherence assessed from daily rainfall data arises from both inter-annual and intraseasonal variability, whereas the use of seasonal and annual totals provides information on inter-annual variability only. However, a study by Ininda [28] indicated that monthly analysis produce better results during the long rainfall season due to higher variability. Indeje [29] also classified the entire East Africa region into eight and nine near homogeneous zones based on the annual and seasonal observed rainfall respectively compared to 16 and 17 near homogeneous zones based on satellite-derived rainfall estimates, which only provided the best estimates and not the actual observed precipitation.
Relationship of aerosol, cloud and precipitation
Correlation analysis: Maximum factor loadings after rotation that is the correlation coefficients between the variables and factors were used to determine the relation of selected variables (aerosols, clouds, and precipitation) over EAC region and presented in Figure 2.
AOD values based on maximum factor loadings identified locations of high concentration in central Kenya, Coastal Kenya (Mombasa) and Tanzania (Dar es Salaam), Eastern Uganda around Lake Victoria, western parts of Uganda and Rwanda (Figure 2a1). AOD showed higher variability during OND compared to MAM (Figure 2a2). Highest AOD values of >0.9 during OND was attributed to strong surface winds associated with the Asian summer monsoon during the June July August September (JJAS) which produces large amount of sea salt aerosols leading to high aerosol production rate over the region [30]. Further, studies indicate that over the land, significant contribution to global aerosol production from soil dust in most of the seasons comes from the regions extending from northwest Africa to China, known as global dust belt [31] while over the ocean; wind generation of marine aerosols is the principal contributor. Spatial patterns of FMF based on maximum factor loadings showed similarities with AOD spatial distribution with regions of high concentration identified as central Kenya, Coastal Kenya (Mombasa) and Tanzania (Dar es Salaam), Eastern Uganda around Lake Victoria, western parts of Uganda and Rwanda. FMF values showed the highest variability during MAM season (Figure 2b1) compared to OND season (Figure 2b2). However, a study by Tosca et al. indicates persistently small -biases of AOD and AERONET values compared to observations in EAC region from MODIS data. Studies by De Graaf et al. [13] and Stein et al. noted that central-east Africa experiences low (high) aerosol loading during wet (dry) periods while southeast Africa showed alternating high and low residues with high values mainly local biomass burning aerosols during the local dry season, which are absent during the local wet season and in phase with the desert dust production north of the northernmost position of the ITCZ (the eastern Sahara). Spatial analysis of clouds based on CTT values showed highest variability over Central Tanzania, Coastal regions of Mombasa and Zanzibar, Central parts of Kenya and Uganda and the western parts of Uganda and Rwanda with seasonal variability noted to be highest during OND (Figure 2c1) compared to MAM (Figure 2c2) period. Spatial analysis of satellite-derived rainfall showed high variability during both MAM (Figure 2d1) and OND (Figure 2d2). Worth noting, several pockets of high factor loading based on satellite data was attributed to observed high rainfall variability in the EAC region due to complex mechanism and processes responsible for rainfall formation.
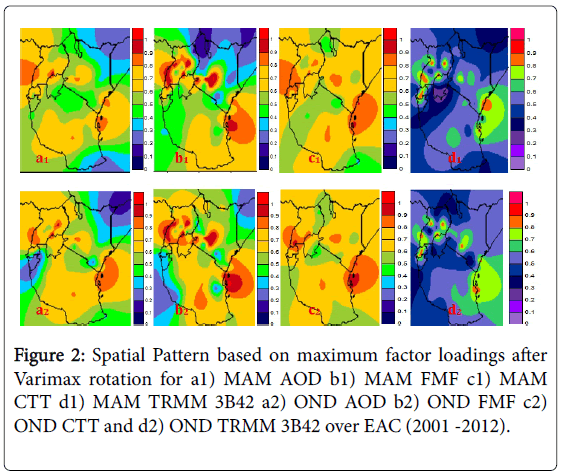
Figure 2: Spatial Pattern based on maximum factor loadings after Varimax rotation for a1) MAM AOD b1) MAM FMF c1) MAM CTT d1) MAM TRMM 3B42 a2) OND AOD b2) OND FMF c2) OND CTT and d2) OND TRMM 3B42 over EAC (2001 -2012).
Multivariate Regression Analysis: Multivariate regression analysis for both MAM and OND seasons was carried based on variables with higher factor loading after Varimax rotation were considered for multivariate regression analysis. The results are presented in Table 2 and 3 for MAM and OND season.
In Tables 2 and 3, autocorrelation analysis showed that all aerosol and cloud variables with strong factor loading in the region had positive relationship with rainfall except in Kigali, Entebbe, and Soroti during MAM season and Kasese and Tanga during OND season. Durbin-Watson test (D-W) indicated that these variables were independent as the values were distributed around 2 for both MAM and OND season. Histograms of the model residual were symmetrical in shape over selected regions during both OND and MAM season in the MRA and thus indicated normality in the model residuals. Wilk- Shapiro test showed strong evidence against normality an indication that did not come from a normal distribution for both MAM and OND season. R2 showed that the percentage of data points that could be fitted ranged between 8% and 23% during MAM season and between 7% and 21% during OND season.
| Station | Auto -correlation | Durbin-Watson (D-W) | P value | Wilk Shapiro (W-S) | P value | R2 |
|---|---|---|---|---|---|---|
| Entebbe | -0.04 | 2.09 | 0.15 | 0.69 | <2.2e-16 | 0.13 |
| Kasese | 0.03 | 1.93 | 0.26 | 0.73 | <2.2e-16 | 0.08 |
| Kigali | -0.05 | 2.03 | 0.65 | 0.65 | <2.2e-16 | 0.1 |
| Malindi | 0.11 | 1.77 | 0.01 | 0.58 | <2.2e-16 | 0.19 |
| Masindi | 0.03 | 1.95 | 0.34 | 0.71 | <2.2e-16 | 0.13 |
| Mombasa | 0.28 | 1.45 | 0 | 0.52 | <2.2e-16 | 0.16 |
| Nakuru | 0.07 | 1.85 | 0.01 | 0.8 | <2.2e-16 | 0.21 |
| Soroti | -0.02 | 2.03 | 0.62 | 0.77 | <2.2e-16 | 0.17 |
| Zanzibar | 0.08 | 1.83 | 0.01 | 0.68 | <2.2e-16 | 0.23 |
Table 2: Multivariate Regression Analysis for MAM season (P Value).
| Station | Auto -correlation | Durbin-Watson (D-W) | P value | Wilk Shapiro (W-S) | P value | R2 |
|---|---|---|---|---|---|---|
| Dagoretti | 0.17 | 1.65 | 0 | 0.57 | <2.2e-16 | 0.15 |
| Dar es Salaam | 0.14 | 1.71 | 0 | 0.56 | <2.2e-16 | 0.2 |
| Embu | 0.18 | 1.65 | 0 | 0.74 | <2.2e-16 | 0.21 |
| Entebbe | 0.08 | 1.98 | 0.6 | 0.66 | <2.2e-16 | 0.12 |
| Kasese | -0.02 | 2.03 | 0.59 | 0.74 | <2.2e-16 | 0.07 |
| Kigali | 0.04 | 1.93 | 0.18 | 0.7 | <2.2e-16 | 0.1 |
| Malindi | 0.06 | 1.89 | 0.07 | 0.53 | <2.2e-16 | 0.14 |
| Masindi | 0.03 | 1.94 | 0.28 | 0.68 | <2.2e-16 | 0.16 |
| Mbarara | 0.03 | 1.95 | 0.27 | 0.73 | <2.2e-16 | 0.12 |
| Soroti | 0.15 | 1.7 | 0 | 0.69 | <2.2e-16 | 0.19 |
| Tanga | -0.04 | 2.08 | 0.14 | 0.56 | <2.2e-16 | 0.16 |
Table 3: Multivariate Regression Analysis for OND season.
In Tables 2 and 3, autocorrelation analysis showed that all aerosol and cloud variables with strong factor loading in the region had positive relationship with rainfall except in Kigali, Entebbe, and Soroti during MAM season and Kasese and Tanga during OND season. Durbin-Watson test (D-W) indicated that these variables were independent as the values were distributed around 2 for both MAM and OND season. Histograms of the model residual were symmetrical in shape over selected regions during both OND and MAM season in the MRA and thus indicated normality in the model residuals. Wilk- Shapiro test showed strong evidence against normality an indication that did not come from a normal distribution for both MAM and OND season. R2 showed that the percentage of data points that could be fitted ranged between 8% and 23% during MAM season and between 7% and 21% during OND season.
During MAM season, the rainfall regression model developed in selected locations in EAC identified different variables (and number) in Entebbe (10), Nakuru (11), Zanzibar (11), Kasese (12), Kigali (12), Malindi (14), Masindi (14), Mombasa (9) and Soroti. In overall, clouds (CTT) indicated a negative contribution in the developed rainfall model as shown by negative coefficient values in selected stations. However, the negative coefficient values had small influence and thus less significant contribution attributed to low coefficient values all centered about zero. During OND season, the selected model for different locations selected and included Embu (15), Malindi (15), Entebbe (14), Dagoretti (12), Kasese (12), Mbarara (11), Tanga (10), Dar es Salaam (8), Kigali (8), Soroti (8) and Masindi (7). Noteworthy, clouds (CTT and aerosols (AOD and FMF) had similar influence in model developed for OND season compared to MAM season where CTT had less significant impact indicated by small coefficient values centered about zero whereas AOD and FMR had significant contribution with absolute coefficient values of up to 11 over selected locations.
Trajectory Analysis: The trajectories were computed for the start, mid and end of the season for both MAM and OND season and presented in Figures 3 and 4.
At the start of MAM season (pentad 13), backward trajectories indicated that the sources regions of selected continental stations which included Entebbe, Kasese and Masindi (Figure 3a); Soroti and Nakuru (Figure 3b Kigali (Figure 3c) at 500, 1000 and 1500 MAGL were mainly in the Arabia deserts and India subcontinent and thus continental while coastal stations that included Malindi (Figure 3b), Mombasa and Zanzibar (Figure 3c) showed the source regions as located in the sub-western Indian Ocean and thus maritime in Nature. At the middle of the MAM season (pentad 21), source areas for all stations which included Kasese, Masindi (Figure 3d); Soroti, Nakuru and Malindi (Figure 3e) Mombasa and Zanzibar (Figure 3f) except Entebbe (Figure 3a) at 1500 MAGL and Kigali (Figure 3c) at 1000 MAGL were in South-western Indian Ocean. At the end of the MAM season (pentad 30), it was noted that all the source regions for all stations (Figure 3c, 3f and 3i) at all levels considered (500, 1000 and 1500 MAGL) were located in the South-western parts of the Indian Ocean.
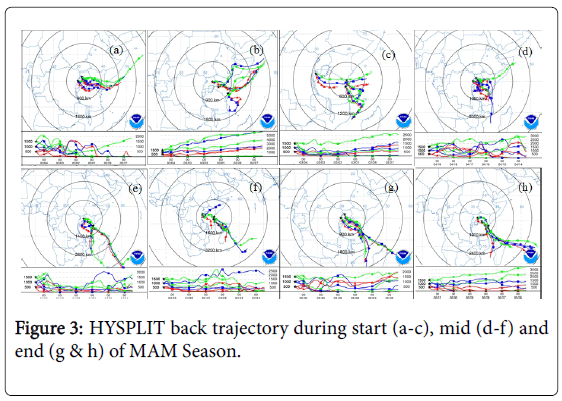
Figure 3: HYSPLIT back trajectory during start (a-c), mid (d-f) and end (g & h) of MAM Season.
At the beginning of OND season (pentad 62), source regions for selected locations were all noted to be in South-western parts of the Indian Ocean for 500, 1000 and 1500 MAGL (Figure 4a-4c)Similar patterns were observed at mid-season (Figure 4d and 4f) with source regions moving closer to the coastal areas. However, at the end of the season (Figure 4g and 4h), the areas of origin were all located in the Arabian and Siberian Plateau and thus continental in Nature. OND trajectory analysis agreed well with other studies such as Gatebe et al. [32] which noted that sources regions for locations in East Africa were mainly from the southwestern parts of the Indian Ocean characterized by the oceanic nature and Arabian regions characterized by their continental character. In general, the study noted that at different levels above the ground, transported particles in the atmosphere had different origins and particles especially aerosols underwent vertical mixing as they were moved inlands towards the region. Further, several mountains as high as 2000 m situated near the Great Rift Valley area in East Africa e.g. Mount Kilimanjaro, Mount Kenya, and Mount Rwenzori block the eastward transport of the Sahel smoke as well as dust from the Bodele Depression [33]. Therefore, these mixed aerosols accounted for enhanced rainfall observed in areas selected that had high factor loading based on TRMM rainfall.
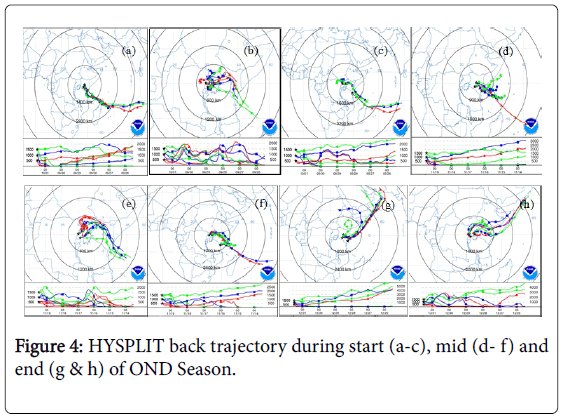
Figure 4: HYSPLIT back trajectory during start (a-c), mid (d- f) and end (g & h) of OND Season.
Mean Variation of aerosol, cloud and precipitation
The Figure 5 presents results of diurnal mean variation aerosols, clouds, and precipitation. In (Figure 5a1) mean spatial pattern of mean AOD showed higher distribution of coarse aerosols of up to 0.34 over northern Kenya, and western parts of EAC region over Rwanda, Burundi and parts of Uganda. Lower mean AOD values of 0.1 were observed in Western, North Eastern and Central Kenya and thus clear skies during this period. However, most parts of EAC region recorded mean AOD values of less than 0.22 and attributed to rainout and washout precipitation processes aerosols were used as CCN and thus their reduced number in the atmosphere. Similar patterns in mean AOD distribution was observed during OND season, (Figure 5a2).
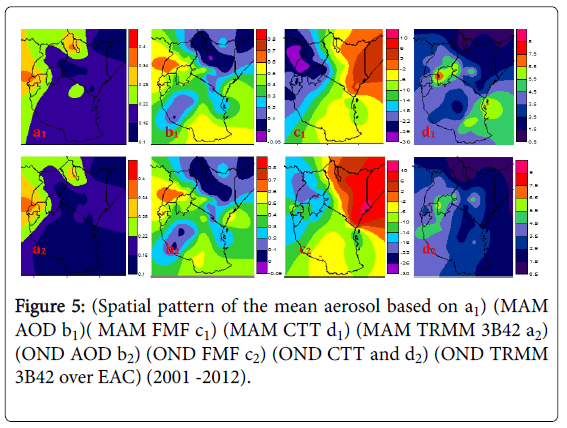
Figure 5: (Spatial pattern of the mean aerosol based on a1) (MAM AOD b1)( MAM FMF c1) (MAM CTT d1) (MAM TRMM 3B42 a2) (OND AOD b2) (OND FMF c2) (OND CTT and d2) (OND TRMM 3B42 over EAC) (2001 -2012).
However, most areas especially Southern Tanzania recorded smaller AOD values of less than 0.16. The higher mean aerosol over Northern and Western EAC region was attributed to the presence of dust brought from the Northern hemisphere especially from Sahara Desert. Based on the observed distribution of AOD measured at 550 nm, the study attributes presence of these aerosols to enhanced rainfall especially over western, central and Northern Eastern Kenya and Southern Tanzania as they act as CCN during rainfall formation processes. During both MAM and OND season, lower AOD values of less than 0.2 are observed over Northern Kenya and parts of Southern Tanzania while Southwestern Uganda, Rwanda, Southern Tanzania and coastal Kenya (Mombasa) indicated high FMF values (Figure 5b1) and (Figure 5b2). Worth noting, during MAM season (associated with long rains), FMF tended to dominate the Central and Northern Kenya and moved northwards towards north-eastern Kenya indicating that FMF aerosols were less affected during the rainfall season. Therefore, reduction of FMF aerosols could be attributed to natural processes such as deposition through gravity as they could not act as CCN during the season's rainfall formation. Notably, the fine mode aerosols are produced by a combination of combustion sources including vehicle emissions, coal-fired plants, domestic biomass burning of fuel wood and numerous industries [34]. During MAM season, spatial patterns of mean CTT indicated that temperatures were higher over the eastern EAC region with decreasing temperature gradient inlands (Figure 5c1). This CTT pattern was noted to shift Northwards during OND season (Figure 5c2). According to Cotton and Pielke, the success of a cloud seeding window was limited to clouds that were relatively cold-based, continental and had cloud top temperatures in the range -10 to -25°C. Therefore, the study noted that stations located over Eastern and Western EAC region with mean temperatures greater than -10°C were unsuitable for cloud seeding activities. However, areas located over central EAC region and mainly along the rift valley and coastal Tanzania were noted as suitable locations with optimal temperatures for cloud seeding. During MAM season, mean daily precipitation was high in over central Kenya, Lake Victoria basin, and coastal Tanzania with values of more than 4.5 mm (Figure 5d1). Compared to rainfall during OND season (Figure 5d2), mean rainfall received during MAM season was higher than OND season. Mutai and Ward [35] indicated that the wet spells in East Africa are often associated with synoptic disturbances that migrate eastwards into EAC region in association with westerly near-surface wind anomalies.
Time series analysis of aerosol, cloud and precipitation
Temporal variability of aerosol, cloud and precipitation was based on time series analysis and computed determined using MK test and CV statistics for stations utilized in the study is presented in Figures 6 and 7.
Temporal variability of aerosol, cloud and precipitation was based on time series analysis and computed determined using MK test and CV statistics for stations utilized in the study is presented in Figures 6 and 7.
During MAM season, significant trend of AOD was observed in Northern parts of Tanzania towards western areas of Mt. Kilimanjaro and extending to the central parts of Kenya on the eastern sides of Mt. Kenya, parts of eastern Uganda along Lake Victoria and Northern parts of Uganda (Figure 6a1). During OND season, significant trend in AOD over South Western parts of Tanzania, Northern Kenya around Mars bit and Eastern parts of Uganda towards Lake Victoria and parts of Northern Uganda and Coastal Tanzania (Figure 6a2). Significant trend of FMF was observed over western EAC region and included Rwanda, Burundi, Western Uganda and Tanzania (Figure 6b1) with Kenyan stations located around Mars bit, central Kenya and on the eastern Mt. Kilimanjaro while significant trend in FMF were observed over Northern EAC region and western Tanzania (Figure 6b2). For CTT, significant trend was found in south, west and northern parts of Kenya central and west Uganda (Figure 6c1) while significant pattern in trend during OND was observed over central parts of Kenya, Northern Uganda and Southern Tanzania (Figure 6c2). For satellite derived rainfall estimate (TRMM 3B42), rainfall showed significant trend in rainfall over coastal (Mombasa), southern and western Kenya (Cherangani Hills), Lake Victoria basin (Kakamega), Coastal Tanzania (Dar es Salaam) and Southwestern Indian Ocean (Figure 6d1) while coastal areas, Rwanda, Burundi, Western Tanzania and areas including Kakamega, Kitale, Marsabit, Nyeri Kigoma and Morogoro recorded significant trend in rainfall (Figure 6d2). During MAM season, AOD undergoes highest variability over western parts of Kenya, Eastern Uganda, Northern Uganda, central Tanzania and the coast of Tanzania (Figure 7a1) with CV values above 0.7 while regions within rift valley from southern Tanzania towards Kenya and up to northern Uganda observed highest variability in AOD values of 0.6 (Figure 7a2) during OND season. For FMF, Northern Kenya around Lodwar indicated highest variability with CV values greater than 4.8 (Figure 7b1) during MAM while eastern and north-eastern parts of Kenya indicated greater than 2.6 CV values (Figure 7b2). CTT showed higher CV higher over north-western parts of Kenya and Uganda (Figure 7c1) with similar patterns but lower values during OND (Figure 7c2).
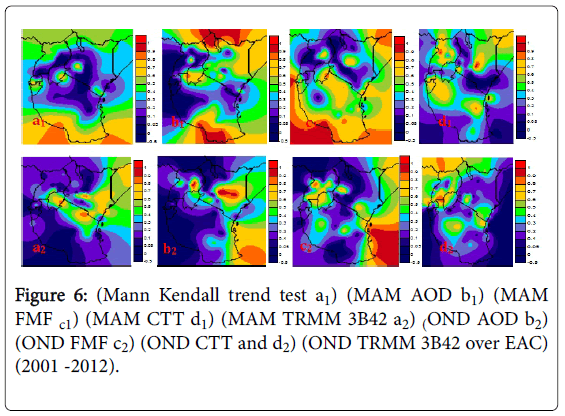
Figure 6: (Mann Kendall trend test a1) (MAM AOD b1) (MAM FMF c1) (MAM CTT d1) (MAM TRMM 3B42 a2) (OND AOD b2) (OND FMF c2) (OND CTT and d2) (OND TRMM 3B42 over EAC) (2001 -2012).
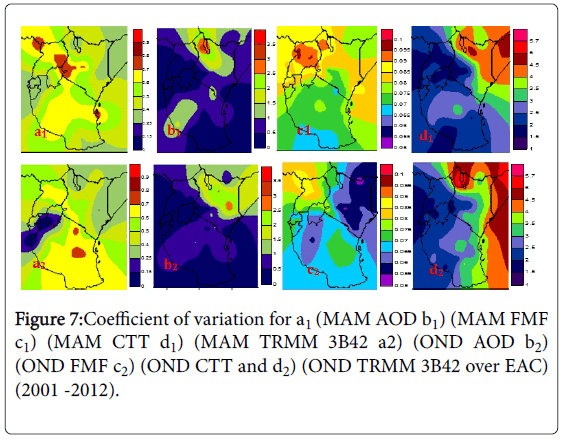
Figure 7: Coefficient of variation for a1 (MAM AOD b1) (MAM FMF c1) (MAM CTT d1) (MAM TRMM 3B42 a2) (OND AOD b2) (OND FMF c2) (OND CTT and d2) (OND TRMM 3B42 over EAC) (2001 -2012).
Rainfall showed the highest variability over Northern Kenya, parts of Uganda and Tanzania during MAM (Figure 7d1) with Eastern EAC indicating higher variability compared to western parts during OND (Figure 7d2). Notably these areas undergoing highest rainfall variability were noted to be located in arid conditions in the region. However, higher variability of FMF over Lower was not significant since mean values were small with FMF values of less than 0.1 (as shown in Figure 5b and 5f above). In general, FMF was noted to vary profoundly during the MAM season compared to OND season.
The study shows that aerosol, cloud and precipitation remain highly variable in both space and time over EAC. The lower mean AOD values recorded during MAM and OND could be attributed to either rainout and washout precipitation processes or use of aerosols as CCN. However, observations indicate that the presence of AOD measured at 550nm resulted in enhanced rainfall. High FMF values during MAM season was an indication that it was less affected by rainfall and its reduction attributed to natural processes such as deposition through gravity. Stations located in Eastern and Western EAC region with mean temperatures greater than -10°C were unsuitable for cloud seeding activities while areas located over central EAC region and mainly along the rift valley and coastal Tanzania were noted as suitable locations with optimal temperatures for cloud seeding. Seasonal analysis of rainfall showed that it remained highly variable in both time and space. Significant PCs retained based on REOF, and simple correlation analysis was due to different atmospheric dynamics responsible for the behavior of climate during the various seasons with spatial coherence arising from both inter-annual and intra-seasonal variability. Highest AOD values of >0.9 during OND was attributed to strong surface winds associated with the Asian summer monsoon during the June July August September (JJAS) which produces large amount of sea salt aerosols leading to high aerosol production rate over the region. Although Clouds (CTT) contributed negatively in the developed rainfall model, it had small influence attributed to low coefficient values all centered about zero. The pattern was similar during OND season for clouds (CTT) and aerosols (AOD and FMF). Autocorrelation analysis showed that all aerosol and cloud variables with strong factor loading in the region had a positive relationship with rainfall except in Kigali, Entebbe, and Soroti during MAM season and Kasese and Tanga during OND season. Durbin-Watson test (D-W) indicated that these variables were independent as the values were distributed around 2 for both MAM and OND season. Histograms of the model residual were symmetrical in shape over selected regions during both OND and MAM season in the MRA and thus indicated normality in the model residuals. The results based on histograms were affirmed by the QQ plots for the selected stations that followed a straight line. Backward trajectory analysis was done using the HYSPLIT model noted that at different levels above the ground, transported particles in the atmosphere had different origins and particles especially aerosols underwent vertical mixing as they were moved inlands towards the region. Further, several mountains as high as 2000 m situated near the Great Rift Valley area in East Africa, including Mount Kilimanjaro, Mount Kenya, and Mount Rwenzori, which block the eastward transport of the Sahel smoke as well as dust from the Beadle Depression resulted to mixed aerosols that accounted for enhanced rainfall observed in areas selected that had high factor loading based on TRMM rainfall.
This paper is part of the Doctor of Philosophy thesis presented to the University of Nairobi by the lead Author. The authors would like to thank Kenya Meteorology Department for providing rainfall data, NCEP/NCAR team for providing wind reanalysis data and MODIS atmosphere team for satellite atmospheric aerosol and cloud products.
