Research Article - (2015) Volume 3, Issue 1
Two case studies have been investigated using high-resolution WRF model simulations. The purpose of these case studies is to determine the effects of wind patterns on visibility and aerosol transport in the region. In the first case study, strong synoptic-scale forcing led to a large-scale pressure gradient resulting in strong wind and longrange aerosol transport. In the second case study, the mesoscale land/sea breeze offset weak synoptic-scale forcing near the coast. The daytime sea breeze and nighttime land breeze limited the ventilation of air masses and allowed recirculation of contaminants and aerosols near the shoreline, which may strongly influence visibility and air quality locally.
Keywords: WRF; Synoptic scale forcing; Mesoscale circulation; Aerosol transport; Visibility; Arabian peninsula; Shamal; Sea breeze; Air quality
The transport and dispersion of air pollutants are affected by many factors, including global and regional weather patterns and local topographical conditions. For example, the prevailing wind direction in mid- latitudes (30°-60° latitude) in much of the world is from west to east; this is a significant factor in the transport of aerosols. The primary factors affecting transport and dispersion of aerosols are wind, stability, and turbulence as shown by Hall et al. [1]. The initial direction of aerosol transport is determined by the wind direction at the source, and pollution concentration from a point source is more sensitive to wind direction than any other parameter. The higher the wind speed, the lower the aerosol concentration. Changes in the wind speed with height along with stability can lead to a variety of transport patterns. Wind speed also affects the travel time from source to receptor, as a reduction of wind speed increases the travel time. For buoyant sources, plume rise depends on wind speed; the stronger the wind, the lower the altitude the plume reaches [1]. When a temperature inversion is present, aerosols released below the inversion are trapped there and can be removed locally only by horizontal winds.
The summer season in the Arabian Peninsula is characterized by high diurnal temperature variation and hazy weather. The intense heat typically gives rise to a local thermal low pressure system over southern Iran, resulting in northwesterly winds across Kuwait and the Persian Gulf (Figure 1). These hot, dusty winds are known as Shamal winds [2], which dominate most of June and July. These winds can persist for periods of 3 to 5 days at speeds of 10-15 ms-1, transporting a large amount of dust into the lower troposphere and reducing visibility to zero in severe cases [2]. A strong Shamal usually decreases maximum temperatures in summer by approximately 5°C due to lofted dust.
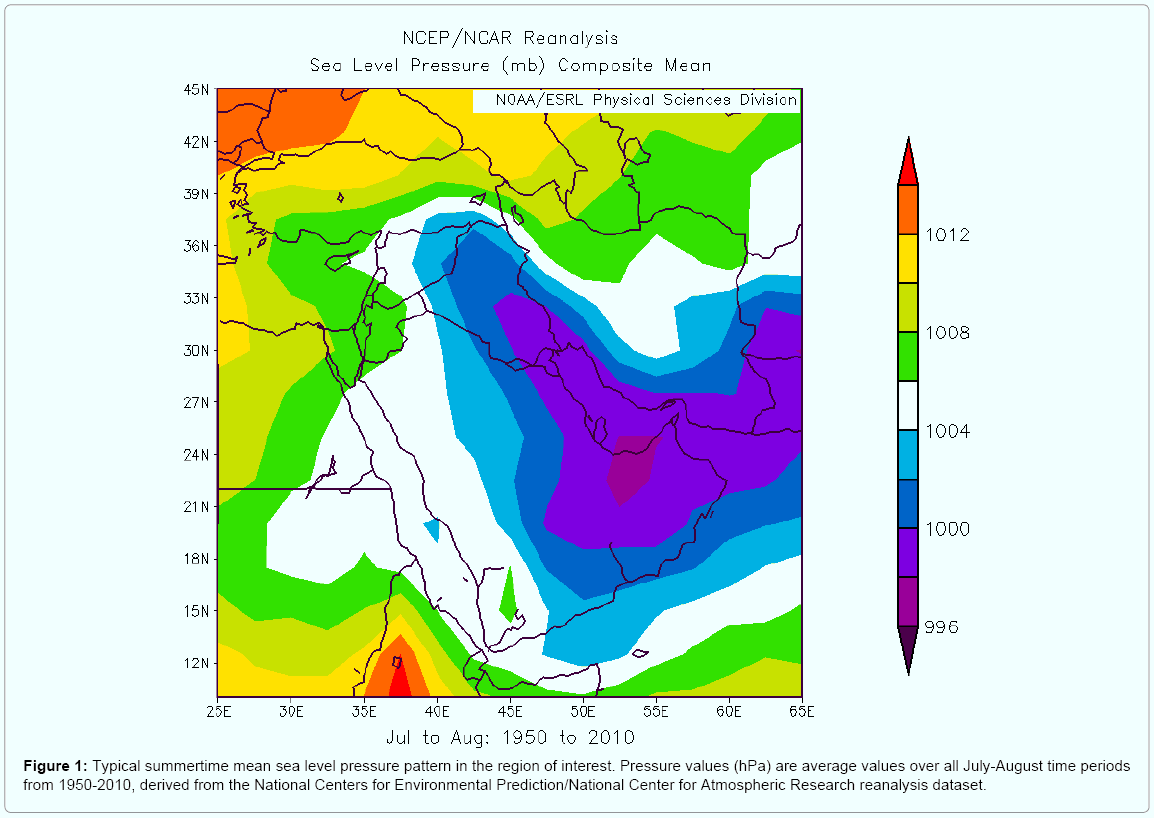
Figure 1: Typical summertime mean sea level pressure pattern in the region of interest. Pressure values (hPa) are average values over all July-August time periods from 1950-2010, derived from the National Centers for Environmental Prediction/National Center for Atmospheric Research reanalysis dataset.
In other cases, the Shamal wind can be caused by a dry cold front crossing the Arabian Peninsula, which reduces the maximum temperature [2]. July is persistently dry and hot, with temperatures that can reach nearly 50°C. Though strong northwesterly winds may cause dust or sand storms, by mid-July, the strong pressure gradient across the Arabian Peninsula often weakens considerably, leading to periods of light northwesterly wind. With a weaker pressure gradient, the Shamal winds become weak, and the wind eventually shifts to easterly to southeasterly in the afternoon due to a sea breeze near the Kuwait coast. By mid-August, the thermal low that forms over India triggers monsoonal rains over the Indian subcontinent, and allows moisture advection across the Arabian Peninsula. During its most intense phase, the Indian monsoon extends to the Mediterranean Sea, blocking frontal systems which may try to cross the region. The lack of a large-scale pressure gradient may make the region more favorable to the formation of mesoscale low pressure in late summer, and also result in high humidity along the Kuwait coast. Cities farther from the coast experience lower humidity under this regime. Figure 2 is provided to familiarize the reader with the topography of the region and the locations of cities in Kuwait which are referenced later.
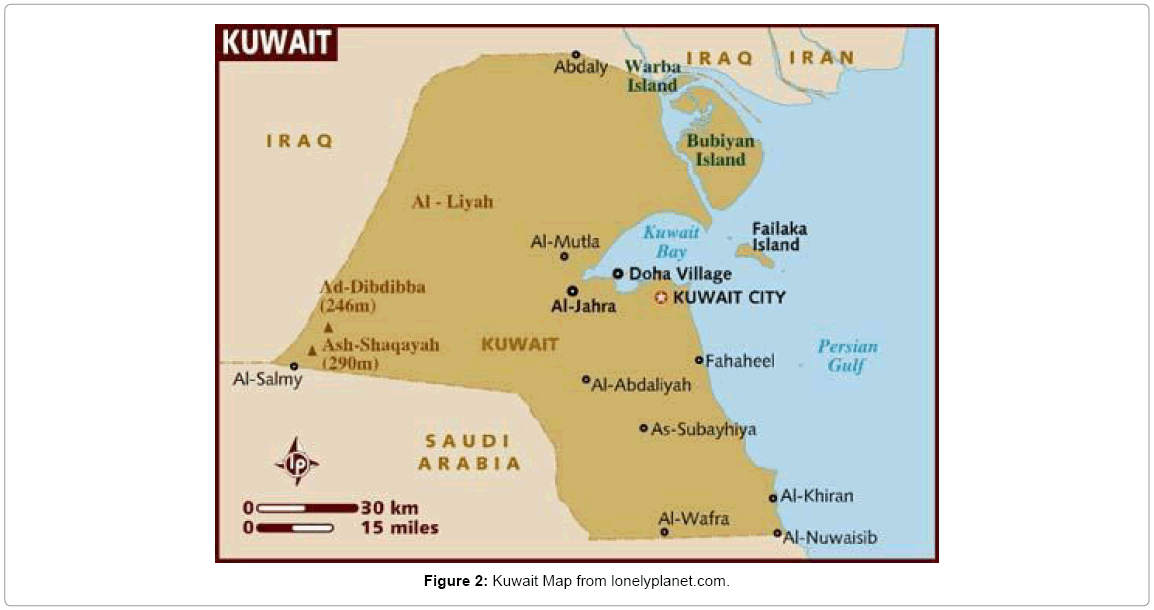
Figure 2: Kuwait Map from lonelyplanet.com.
This paper illustrates difficulties encountered in forecasting wind, dust, and pollutant impacts in urbanized coastal areas of Kuwait, where over half the population lives. Two case studies will be investigated to illustrate the character of the winds and pollution dispersion in the region under different synoptic regimes. We will illustrate how changes to the large-scale pressure gradient and resulting changes in the prevailing wind direction govern air quality in Kuwait. Typically, a large-scale pressure gradient supports the Shamal wind, while occasional breakdowns of this pressure distribution allow for a sea breeze circulation to develop near the coast and extend inland. These varying circulation regimes lead to dissimilar air quality outcomes for Kuwait.
The public-domain Weather Research and Forecasting (WRF) model was used to simulate the regional circulation, and to provide input for use with the Hybrid Single Particle Lagrangian Integrated Trajectory (HYSPLIT) dispersion model (Air Resources Laboratory 2013). WRF consists of two dynamic cores with options for the vertical coordinate system and numerous options for physical parameterizations. Here, we use the Advanced Research WRF (ARW) dynamic core, which has equations that are fully compressible, nonhydrostatic and solved on a sigma-pressure vertical coordinate with an Arakawa-C grid in the horizontal. Additional details of the model are presented in Skamarock et al. [3].
These WRF simulations used the five-layer thermal diffusion surface physics scheme, the Yonsei University (YSU) boundary layer scheme, and the Kain-Fritch convective parameterization on 27 and 9 km nested grids. Explicit cumulus was used on the fine grid along with the WRF single-moment microphysics scheme. Details of the cloud schemes are secondary, since the atmosphere was sufficiently dry that they never activated. Initial and boundary conditions were provided by the National Center for Environmental Prediction (NCEP) Final Analysis (FNL) that is generated using the NCEP Global Forecast System (GFS) model. The GFS grids have a global domain at 1° horizontal resolution, 28 vertical levels, and output every 6 hours. WRF simulations were performed for a period of 24 hours starting at 0200 UTC on 14 and 18 July 2008. There was some transient behavior over the first hour of simulation as the fine grid adjusted to the larger-scale initial conditions, but since we are interested in the part of the diurnal cycle beginning shortly before sunrise, this did not affect the results. The HYSPLIT air dispersion computation was initialized with WRF output for each day. On 14 July 2008, there was one HYSPLIT run from 0200 UTC to 0000 UTC 15 July. On 18 July 2008, two HYSPLIT runs were performed. The first was from 0200 UTC to 0000 UTC 19 July, and the second was from 1200 UTC to 0000 UTC on 19 July. The two runs were designed to investigate aerosol transport resulting from a different release time during the sea breeze cycle.
July 2008 is presented as an example of typical conditions and their variability. There were 22 days of moderate to strong northwesterly winds and 9 days with light northwesterly to variable winds during this period (Figure 3, Failaka Island). The lack of a large-scale pressure gradient and the difference between land and water temperatures on the 9 days without strong northwest wind caused a sea breeze to be established in the afternoon. The Shamal winds that were present on the remaining days caused rising dust in Kuwait. Nearly all days during July 2008 had dust storms, rising dust, suspended dust, or haze observed.
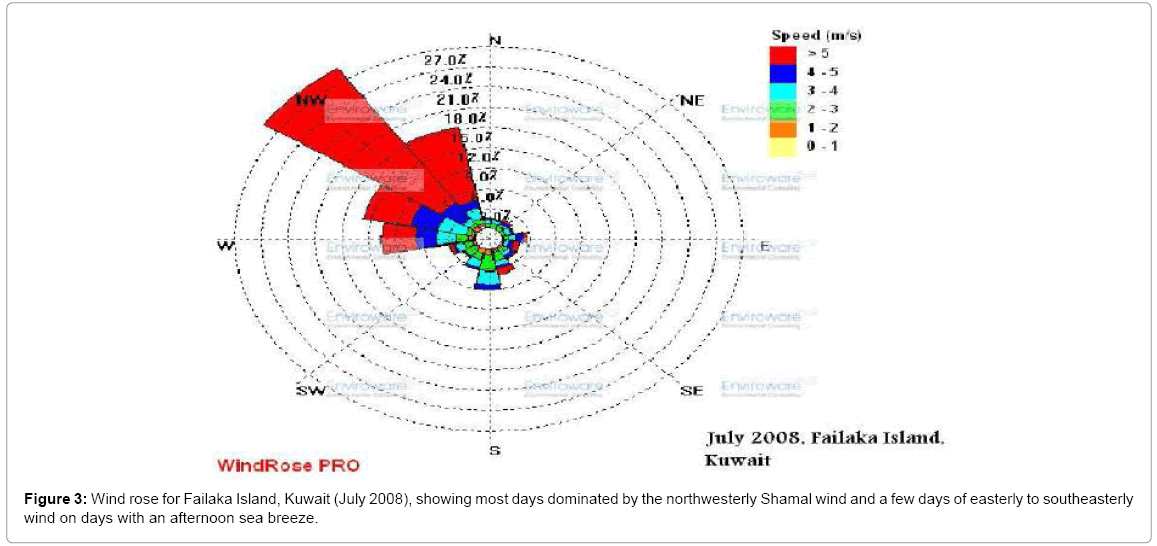
Figure 3: Wind rose for Failaka Island, Kuwait (July 2008), showing most days dominated by the northwesterly Shamal wind and a few days of easterly to southeasterly wind on days with an afternoon sea breeze.
The influence of the characteristic pressure distribution is further revealed by evaluating two case studies. During the first case, on 14 July 2008, the eastern Mediterranean Sea high pressure system intensified and a thermal low developed over Iran. This led to a strong pressure gradient across the Arabian Peninsula (Figure 4). The second case, on 18 July 2008, shows the effect of weak synoptic forcing in the area. On this day the eastern Mediterranean Sea high pressure system weakened, and a thermal low developed north of Kuwait in Iraq, causing a weak pressure gradient over Kuwait (Figure 5). This type of pressure distribution enhances the temperature difference between the land and the Persian Gulf [4], since advection of warm air from the northwest is suppressed. The land/water temperature contrast created a mesoscale circulation (sea/land breeze) near the Kuwait coast. During the daytime, the wind shifted from the normal northerly direction to an easterly/southeasterly direction due to the sea breeze, and then shifted back to northerly at night due to the land breeze [4].
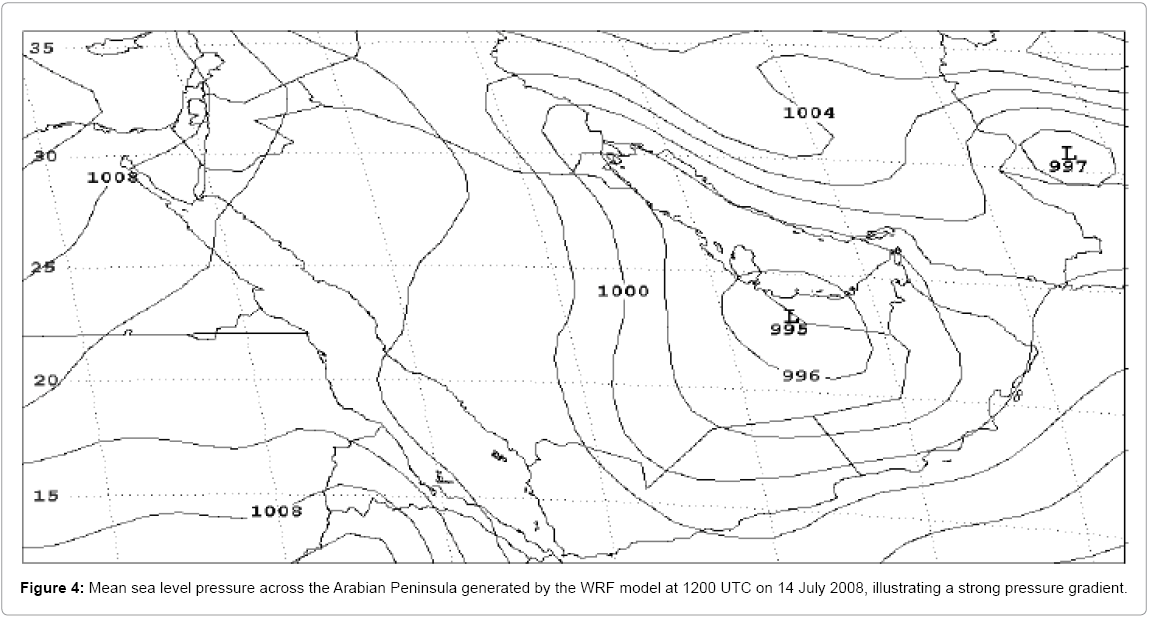
Figure 4: Mean sea level pressure across the Arabian Peninsula generated by the WRF model at 1200 UTC on 14 July 2008, illustrating a strong pressure gradient.
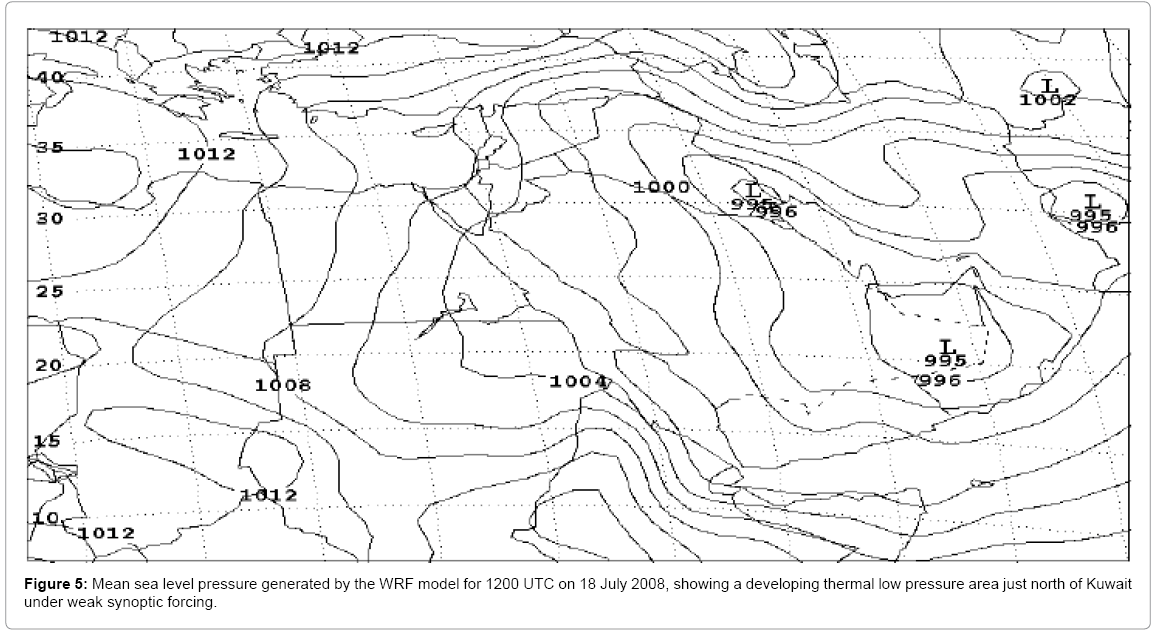
Figure 5: Mean sea level pressure generated by the WRF model for 1200 UTC on 18 July 2008, showing a developing thermal low pressure area just north of Kuwait under weak synoptic forcing.
14 July 2008
On 14 July 2008, strong northerly and northwesterly winds were caused by an intense pressure gradient enhanced by a dry cold frontal passage. A thermal low over Pakistan and Afghanistan, generated by the monsoon circulation, produced a trough of low pressure through the Zagros Mountains in Iran. The interaction of this low pressure zone with semi-permanent high pressure over northern Saudi Arabia resulted in an enhancement of the regional flow features throughout the Arabian Peninsula similar to that reported by Aurelius et al. [2]. WRF simulations of the mean sea level pressure (MSLP) distribution are shown in Figure 6. They show a surface low over the eastern Arabian Peninsula and high pressure over the eastern Mediterranean Sea (Figures 6a-6d), resulting in a strong pressure gradient across the area. Such a pressure gradient is often sustained for a few days to a week. In the afternoon at 1200 UTC (Figure 6c), the low pressure located in the southeast Arabian Peninsula intensified due to solar heating, strengthening the pressure gradient, increasing the surface wind, and deepening the mixing layer. A deep mixed layer created in this way over dry regions tends to be characterized by high lapse rates (eg. Salmond et al.) [5]. Shamal winds reached 15-17.5 ms-1 near the surface through most of the daytime hours, both inland (eg. Al Abdaly, Figure 7a) and off the coast (eg. Failaka Island, Figure 7b).
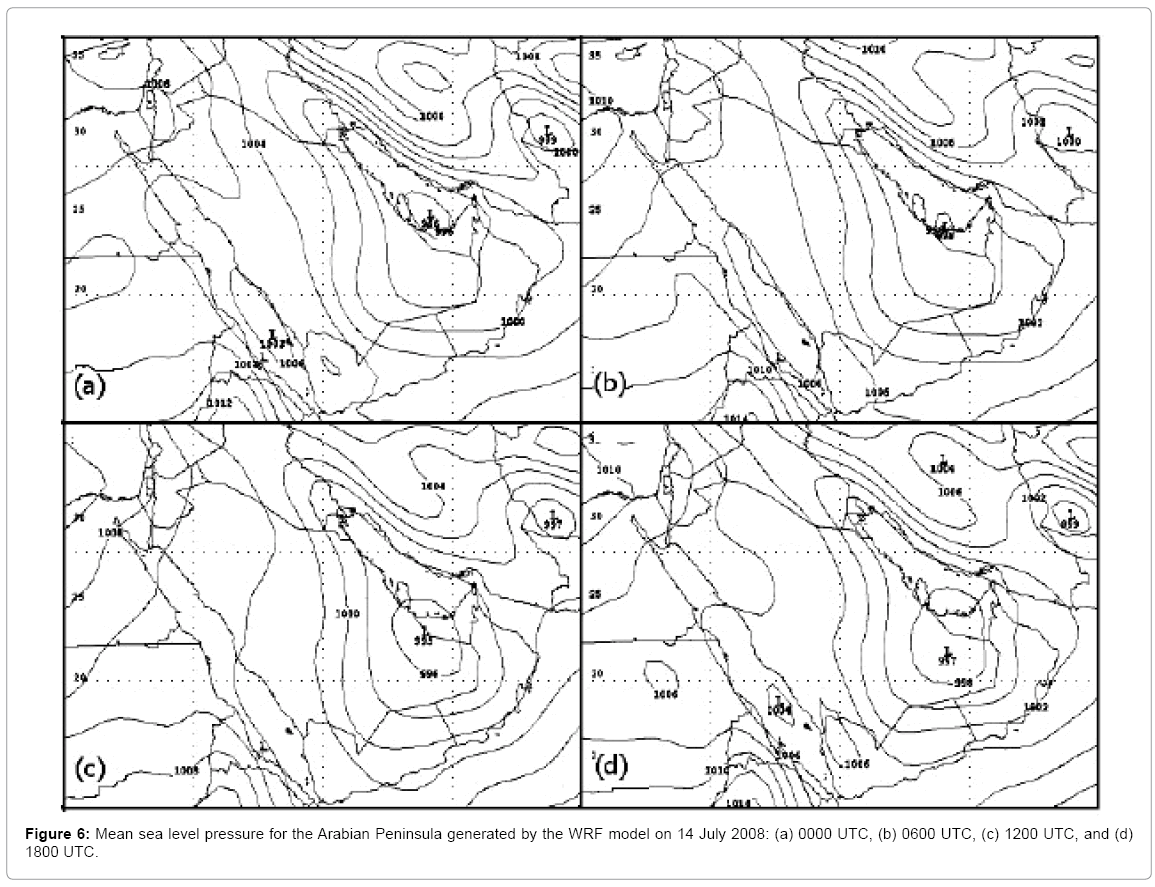
Figure 6: Mean sea level pressure for the Arabian Peninsula generated by the WRF model on 14 July 2008: (a) 0000 UTC, (b) 0600 UTC, (c) 1200 UTC, and (d) 1800 UTC.
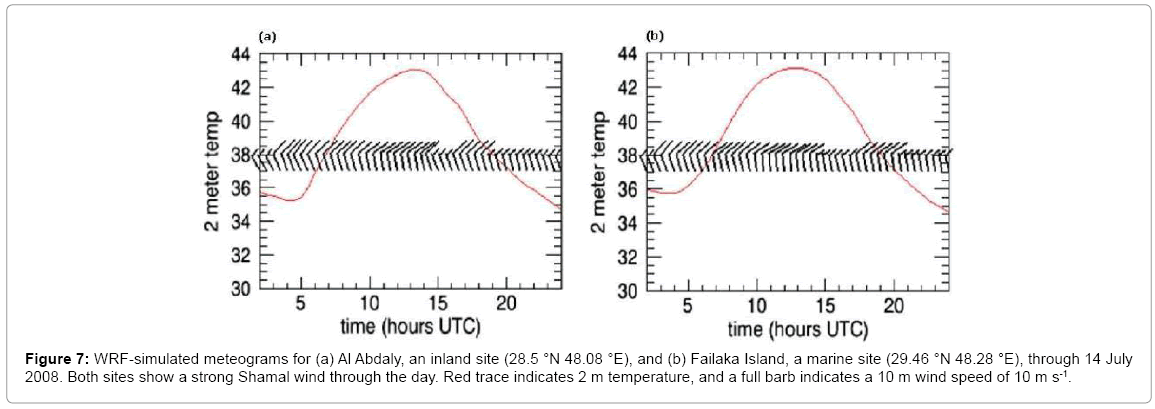
Figure 7: WRF-simulated meteograms for (a) Al Abdaly, an inland site (28.5 °N 48.08 °E), and (b) Failaka Island, a marine site (29.46 °N 48.28 °E), through 14 July 2008. Both sites show a strong Shamal wind through the day. Red trace indicates 2 m temperature, and a full barb indicates a 10 m wind speed of 10 m s-1.
A common phenomenon with Shamal wind events is decoupling of the surface layer, particularly at night, so the wind at several hundred meters above ground level (AGL) is very intense, while the wind at the surface is moderate to light. In these cases, the wind speed typically peaks at heights between 500 m and 1000 m AGL, and the change in wind speed between the surface and the level of maximum wind speed can be unusually steep [6]. As the sun angle starts to decrease in the afternoon, insolation decreases while total outgoing longwave radiation (OLR) remains constant. Net radiation at the surface becomes negative, promoting surface cooling. The resulting surface-based cool, stable layer effectively decouples from the air above it, decreasing mixing within the stable layer (eg. Doswell et al.) [7]. As a result, the frictional force disappears above the stable surface layer, promoting stronger winds aloft.
The wind at 10 m AGL (Figure 8) is typically strong during the daytime, with decreases overnight. Moderate northwest winds were present over Kuwait at 0000 UTC (Figure 8a), which intensified by 0600 UTC (Figure 8b) and still further by 1200 UTC (Figure 8c). The increase in daytime wind speed is consistent with enhancement of turbulent mixing due to surface heating, and formation of a well-mixed layer. Well-mixed boundary layers occur commonly over land during the day when surface heating is maximized, especially in summer when the sun angle is high. The wind on 14 July 2008 remained northwesterly throughout the day, changing in speed only, with the wind speed decreasing at night. The strong regional pressure gradient through 14 July (Figure 6) sustained the northwesterly wind (Figure 8). Nighttime occurrences of Shamal winds are considered to be a type of nocturnal jet, with height of the maximum wind speed linked to magnitude of the temperature inversion [2]. During the night when solar heating is removed, the low levels become stable, very little mixing occurs, and the low-level flow becomes quite laminar.
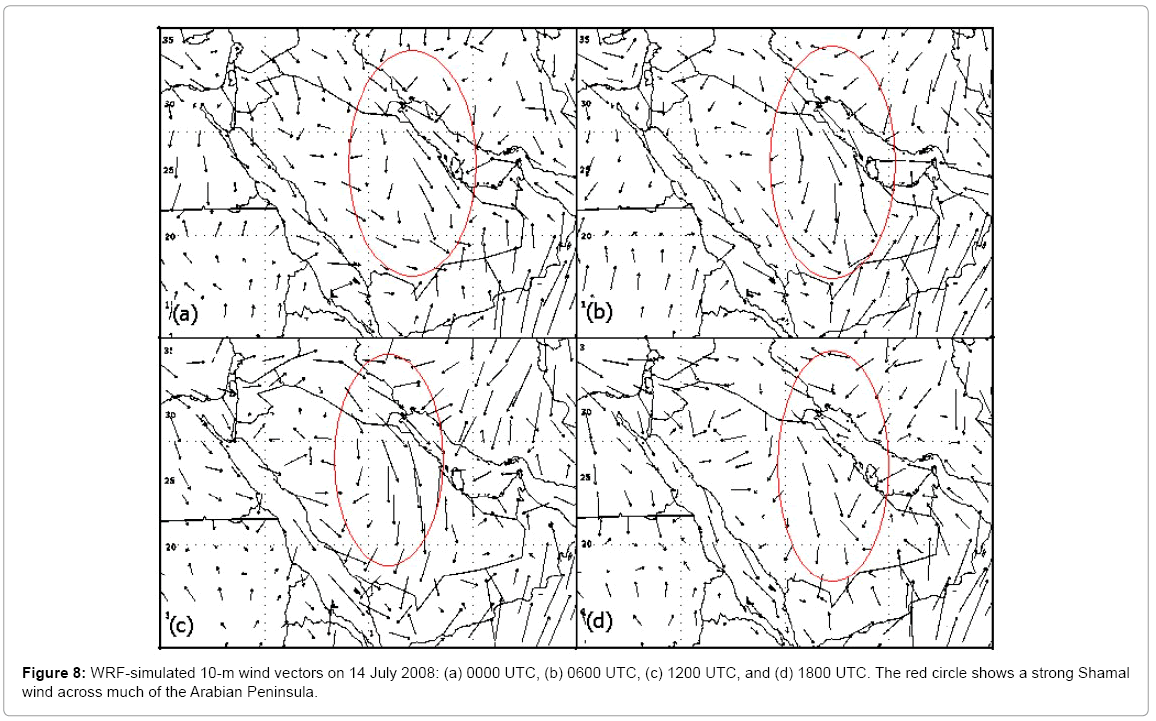
Figure 8: WRF-simulated 10-m wind vectors on 14 July 2008: (a) 0000 UTC, (b) 0600 UTC, (c) 1200 UTC, and (d) 1800 UTC. The red circle shows a strong Shamal wind across much of the Arabian Peninsula.
Figure 9 shows vertical profiles of potential temperature (θ), equivalent potential temperature (θe), and wind from WRF output. The profiles were taken at the Kuwait International Airport (KIA). This location was chosen so any effects of the marine boundary layer are not present, clarifying diurnal boundary layer modification. At 0400 UTC (shortly after sunrise), there is evidence of a shallow mixed layer to a height of about 200 m AGL, evidenced by constant θ with height (Figure 9a). Strong northeaster lies are confined below 650 hPa (~3000 m in Figure 9), which indicates that the Shamal wind is a lowlevel phenomenon. As the day progresses, the depth of the mixed layer increases to 400 m at 0800 UTC (local noon; Figure 9b) and to nearly 1600 m at 1200 UTC (mid-afternoon; Figure 9c). As the sun begins to set, the mixed layer begins to collapse (Figure 9d). An increase in wind speed through the day corresponds to increasing mixed-layer depth. More details of the variation in surface wind and its correspondence to surface θ is given in Figure 10. Surface wind speed is generally directly proportional to surface θ, since surface heating increases both θ and mixed-layer depth. Surface wind speed increases as high- momentum air is mixed toward the surface, and decreases as mixing decreases at night. The behavior shown here is consistent with that described by Membery [8] and Qiu et al. [6].
18 July 2008
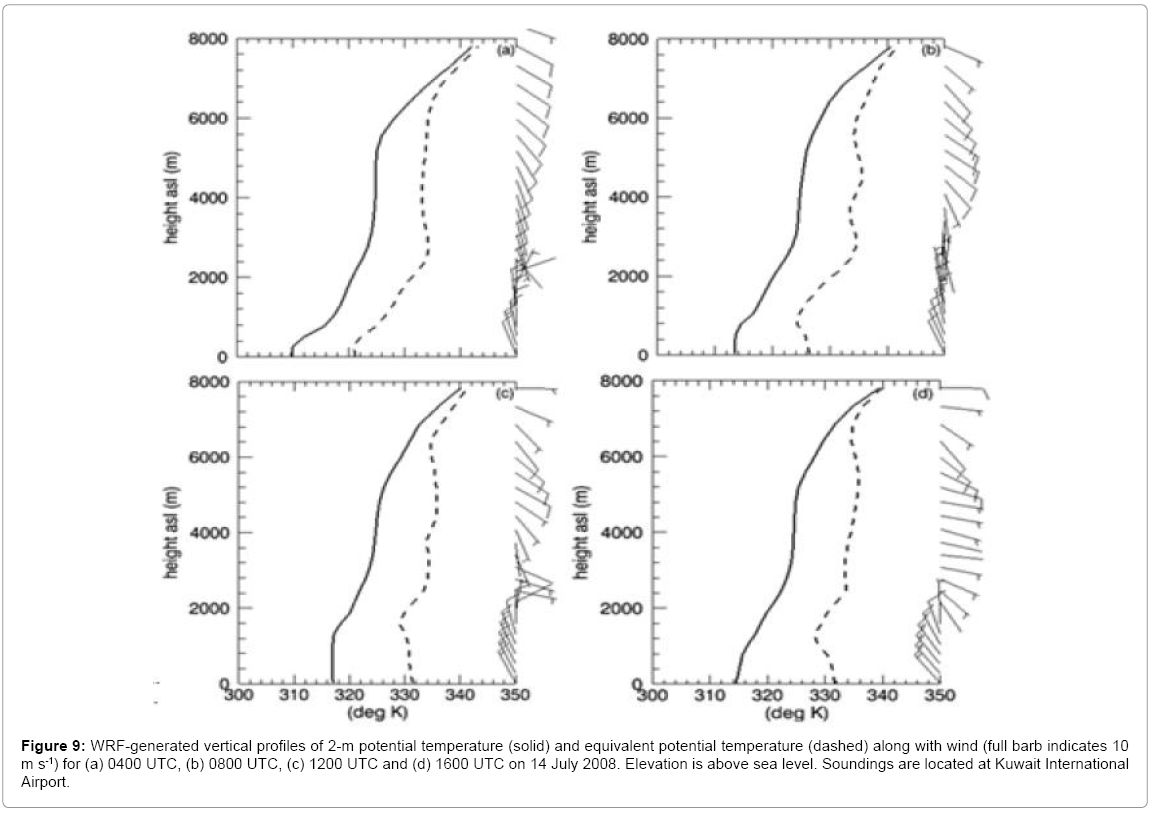
Figure 9: WRF-generated vertical profiles of 2-m potential temperature (solid) and equivalent potential temperature (dashed) along with wind (full barb indicates 10 m s-1) for (a) 0400 UTC, (b) 0800 UTC, (c) 1200 UTC and (d) 1600 UTC on 14 July 2008. Elevation is above sea level. Soundings are located at Kuwait International Airport.
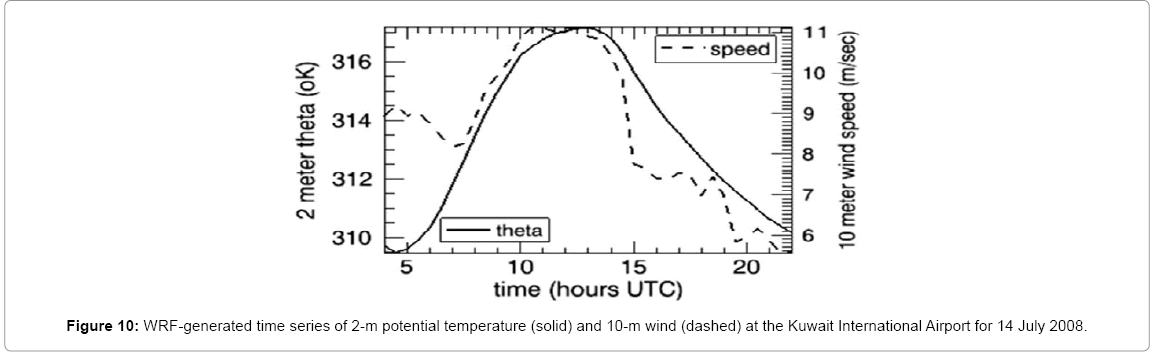
Figure 10: WRF-generated time series of 2-m potential temperature (solid) and 10-m wind (dashed) at the Kuwait International Airport for 14 July 2008.
On 18 July 2008, a weak synoptic-scale pressure gradient was present across the Arabian Peninsula (Figure 11), which allowed the development of thermal low pressure north of Kuwait in the afternoon (Figures 11c and 11d). Mesoscale circulations may develop on such days, modulated by factors including the local surface heat flux, evaporation and transpiration from the earth’s surface, and the land-water temperature difference. Cooler marine air propagates inland when a cross-shore mesoscale pressure gradient is created by differential daytime heating. The sea surface temperature changes very little, but the land becomes hotter and daytime convection redistributes heat through the boundary layer. The resulting pressure difference is responsible for sea breeze onset. The effect of this differential heating is shown in time series of the surface temperature at coastal and inland cities (Figure 12). Values at the land and marine stations are similar in the beginning of the day, when temperatures are around 30°C. Between 0700 and 0900 local time, the temperature begins to increase inland, reaching 45-50°C by local noon. This is in contrast to marine stations, where temperatures only increased to around 35°C, resulting in a large temperature difference between land and marine stations in the afternoon of 18 July 2008 (Figure 12). The largest sea-land temperature difference was approximately 13°C.
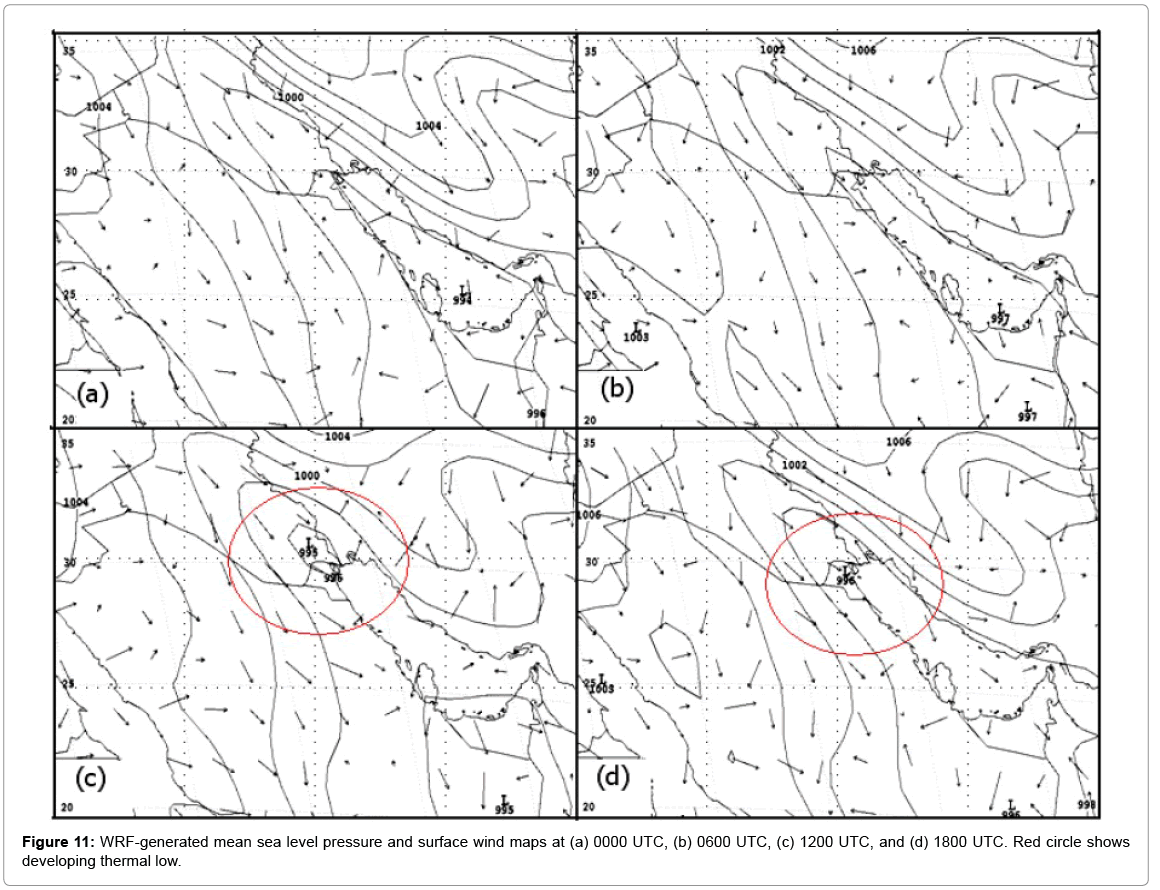
Figure 11: WRF-generated mean sea level pressure and surface wind maps at (a) 0000 UTC, (b) 0600 UTC, (c) 1200 UTC, and (d) 1800 UTC. Red circle shows developing thermal low.
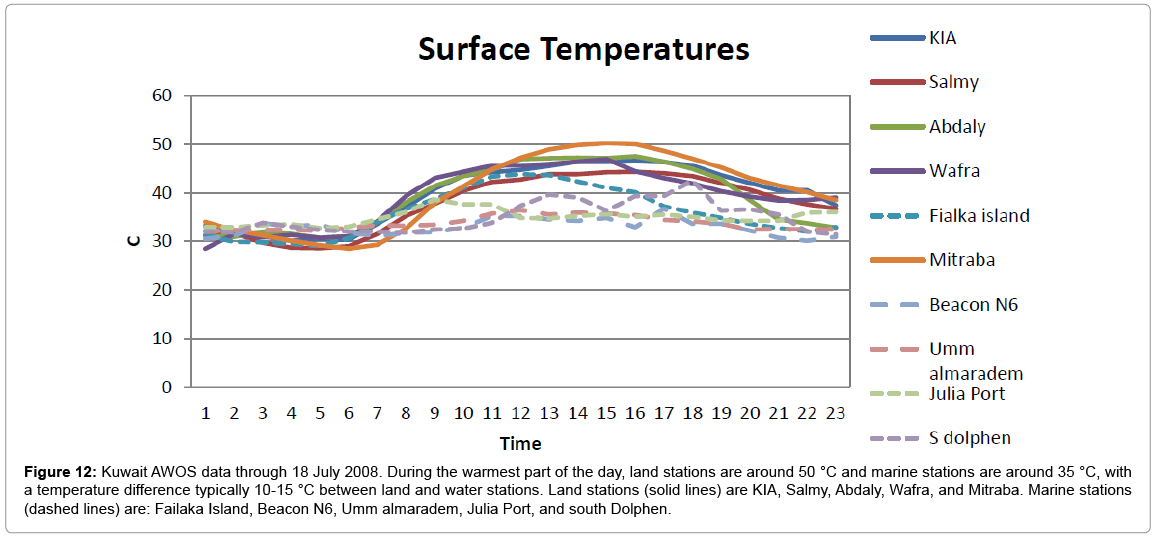
Figure 12: Kuwait AWOS data through 18 July 2008. During the warmest part of the day, land stations are around 50 °C and marine stations are around 35 °C, with a temperature difference typically 10-15 °C between land and water stations. Land stations (solid lines) are KIA, Salmy, Abdaly, Wafra, and Mitraba. Marine stations (dashed lines) are: Failaka Island, Beacon N6, Umm almaradem, Julia Port, and south Dolphen.
Figure 13 shows meteograms for four inland cities, constructed from WRF output. Wind and temperature trends were similar at all land cities, with persistent northwesterly wind. These observations contrast with those from four islands in Kuwait (Figure 14), where a change in wind direction occurred. The wind shifted from northwesterly to southeasterly in the afternoon, indicating a sea breeze in this region. Coastal cities near the Persian Gulf also experienced a sea breeze effect in the afternoon. Figure 15 shows the meteogram for two coastal cities, where the wind shifted from northwesterly to southeasterly in the afternoon. This change in wind direction indicates sea breeze influence which extends inland past the coastal cities. Another important feature is the speed with which the sea breeze passes these sites. At Shuwaik (Figure 15b), the wind direction changed and the temperature dropped by 8°C in two hours.
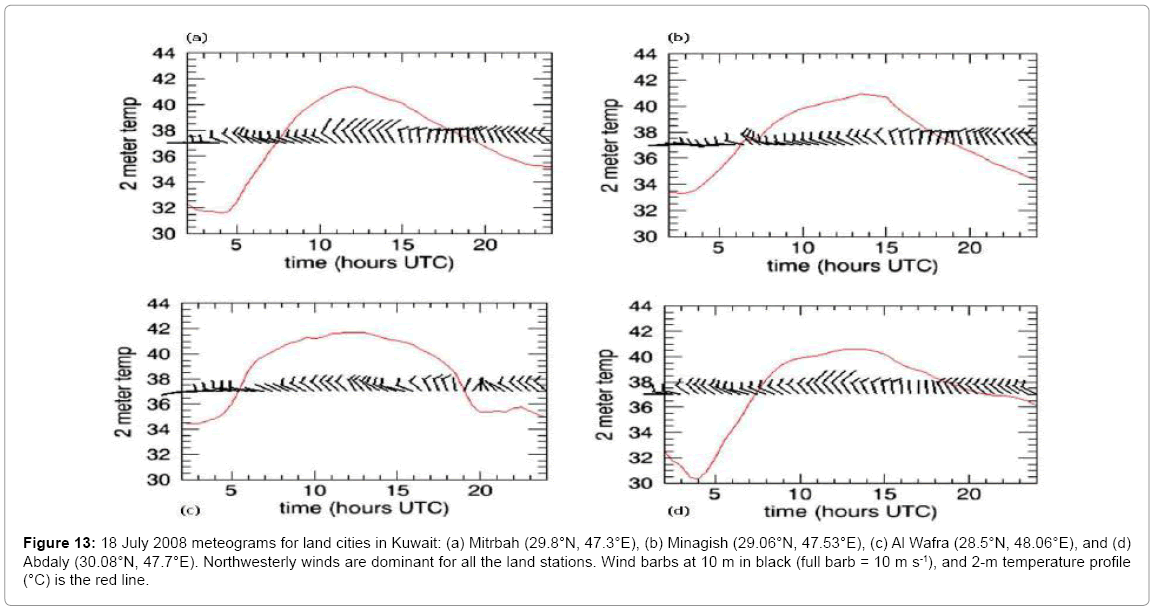
Figure 13: 18 July 2008 meteograms for land cities in Kuwait: (a) Mitrbah (29.8°N, 47.3°E), (b) Minagish (29.06°N, 47.53°E), (c) Al Wafra (28.5°N, 48.06°E), and (d) Abdaly (30.08°N, 47.7°E). Northwesterly winds are dominant for all the land stations. Wind barbs at 10 m in black (full barb = 10 m s-1), and 2-m temperature profile (°C) is the red line.
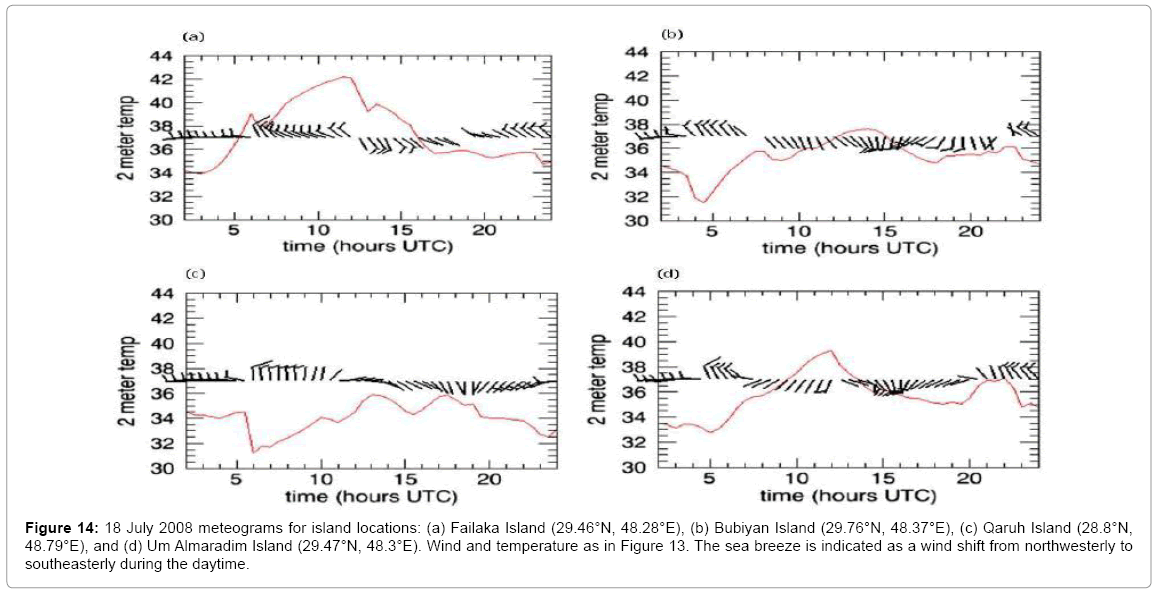
Figure 14: 18 July 2008 meteograms for island locations: (a) Failaka Island (29.46°N, 48.28°E), (b) Bubiyan Island (29.76°N, 48.37°E), (c) Qaruh Island (28.8°N, 48.79°E), and (d) Um Almaradim Island (29.47°N, 48.3°E). Wind and temperature as in Figure 13. The sea breeze is indicated as a wind shift from meteograms to southeasterly during the daytime.
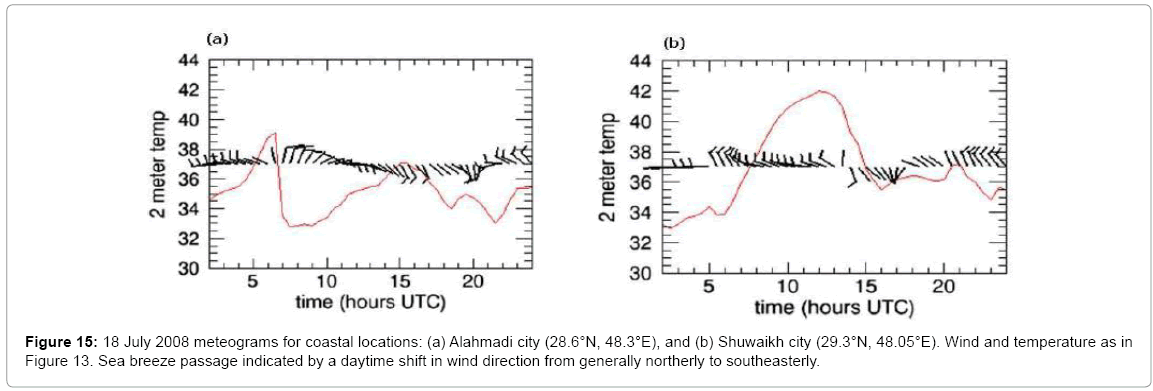
Figure 15: 18 July 2008 breeze-Sea for coastal locations: (a) Alahmadi city (28.6°N, 48.3°E), and (b) Shuwaikh city (29.3°N, 48.05°E). Wind and temperature as in Figure 13. Sea breeze passage indicated by a daytime shift in wind direction from generally northerly to southeasterly.
Limited visibility may be the most immediate indicator of poor air quality when aerosol concentration is high. Haze obscures visibility when light is absorbed or scattered by pollution particles such as sulfates, nitrates, organic carbon compounds, soot, and soil dust. Nitrogen dioxide and other gas-phase pollutants also contribute to haze. Low visibility and poor air quality conditions over the Persian Gulf region are typically associated with relatively calm conditions and the recirculation of pollutants via the sea breeze circulation. The Failaka Island station visibility (Figure 16d) indicates that visibility decreases in the afternoon when a sea breeze is present. The visibility dropped from 13 km to 5 km at 0900 UTC which indicates that haze and poor air quality occurred during the inland phase of the sea breeze. A similar trend occurred at the Kuwait International Airport (Figure 16a), where visibility decreased during the afternoon from 14 km at 0200 UTC to 5 km at 0600 UTC. The visibility at Salmy decreases to 5 km at 0600 UTC (Figure 16b), and the visibility at Al Wafrah decreased to 10 km at 1300 UTC (Figure 16c). Cities at least 20 km inland generally experienced visibility higher than 5 km, while cities closer to the Persian Gulf were affected by visibility around 5 km. The decrease in visibility near the coast is related to the recirculation of pollutants by the sea breeze, and is also likely associated with emissions from oil refineries and higher population density near the coast. Without the influence of Shamal winds, these pollutants are able to accumulate locally while a sea breeze regime is present.
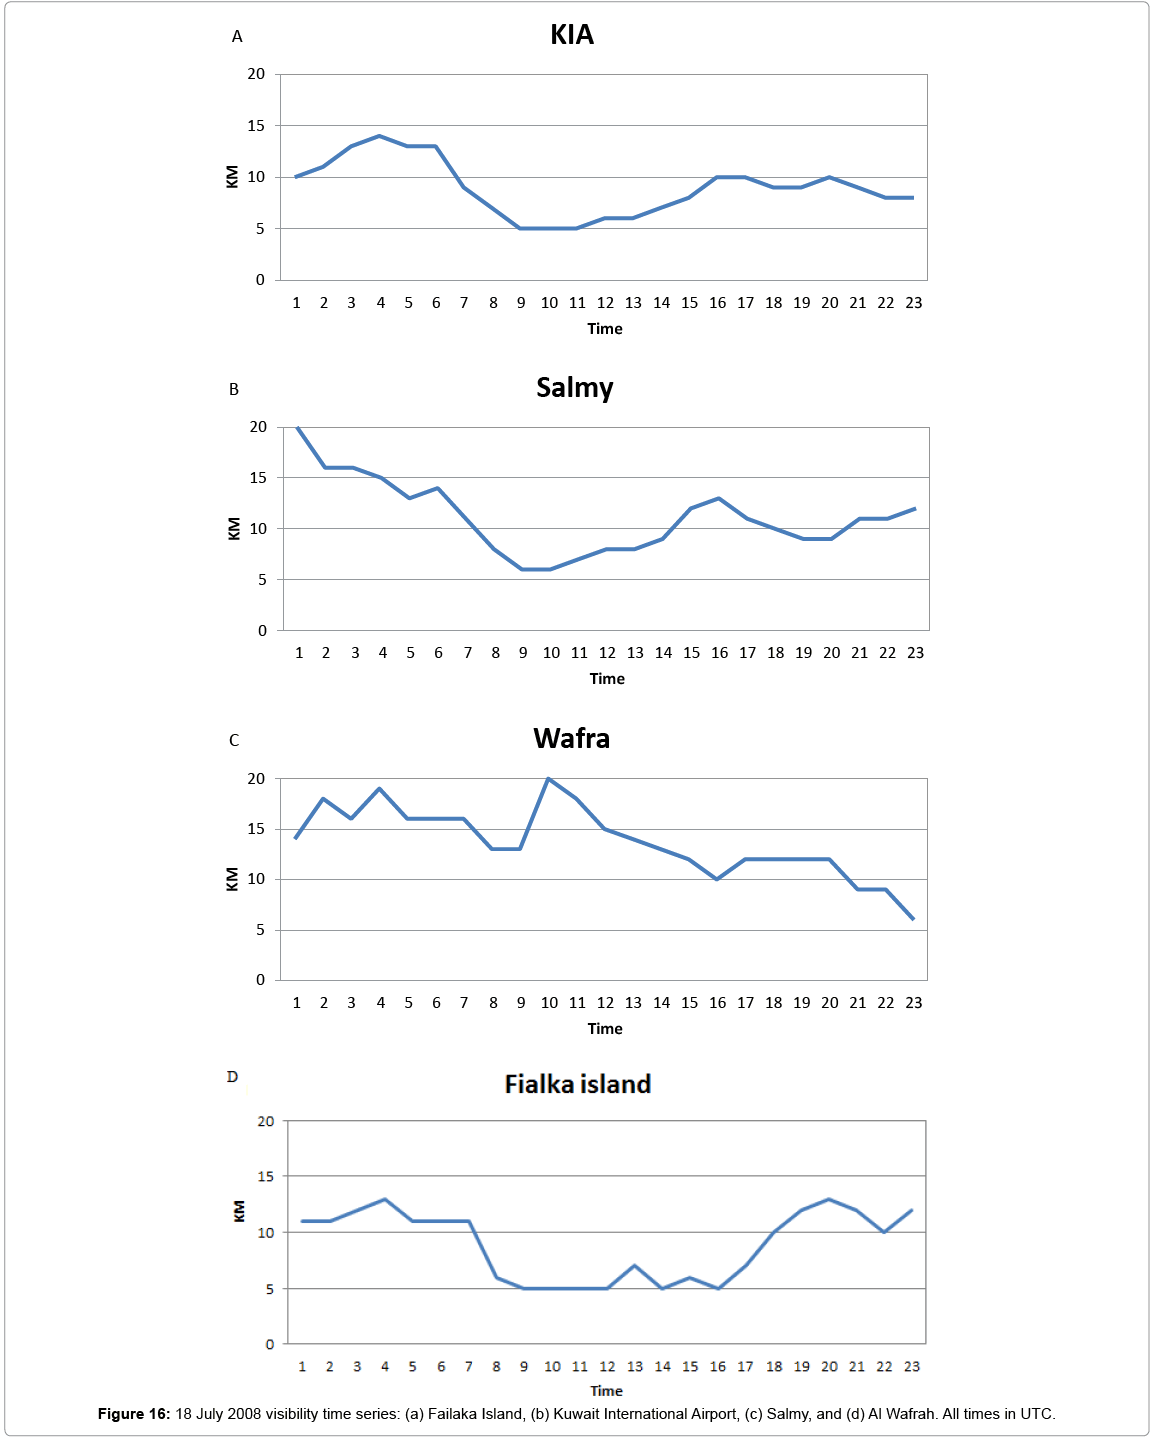
Figure 16: 18 July 2008 visibility time series: (a) Failaka Island, (b) Kuwait International Airport, (c) Salmy, and (d) Al Wafrah. All times in UTC.
In Abdaly, which is located farther north than the cities in Figure 16 and away from the Persian Gulf (Figure 2), the temporal trend of visibility was quite different (Figure 17). Visibility increased around noon as light northwesterly wind was sustained most of the day with no sea breeze effect. Variability in visibility between islands, coastal cities, and inland cities shows the role of the sea breeze in decreasing visibility and trapping pollutants near the Kuwait coast.
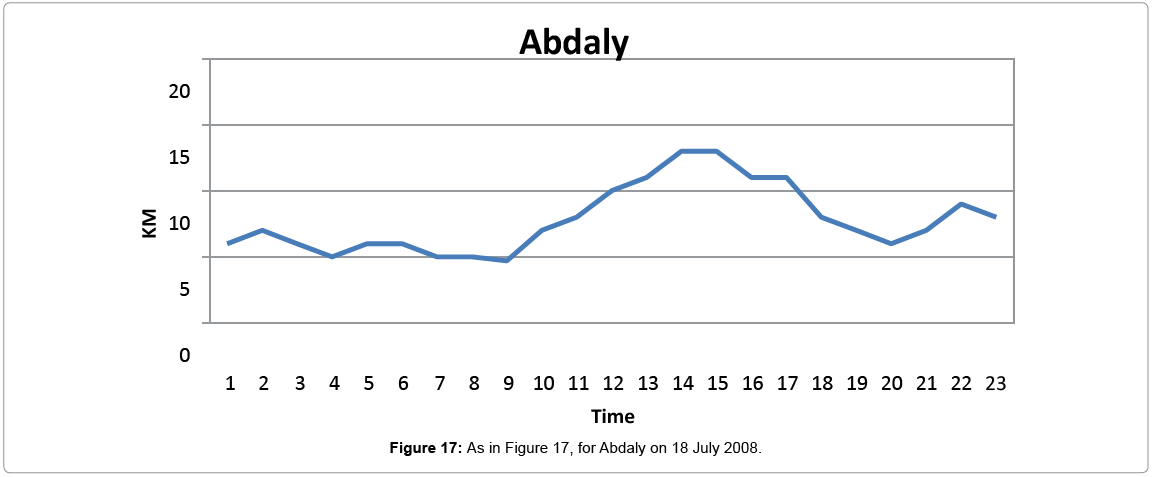
Figure 17: As in Figure 17, for Abdaly on 18 July 2008.
Surface wind vectors
The sea breeze is a challenging atmospheric phenomenon to model because of its relatively short temporal and small spatial scale. Being able to model the sea breeze requires a high-resolution model which allows identification of the sea breeze convergence zone. The WRF model with a 9-km inner grid allowed examination of the regional wind distribution, including evolution of the sea breeze. Figure 18 shows surface wind vectors for 14 July at 0200 UTC (Figure 18a) and 1400 UTC (Figure 18b), which indicate a northwesterly Shamal flow throughout the time period, which strengthened in the afternoon. The wind patterns on 18 July were more complicated (Figure 19). The reversal of the surface temperature gradient between the sea and land results in an afternoon onshore southeast to east surface wind flow near the coast (Figures 19f-19h). The early-day winds are northwesterly, suggesting the land breeze that dominates the region then. The presence of a land breeze is also evidenced by convergence over the central Persian Gulf at these times.
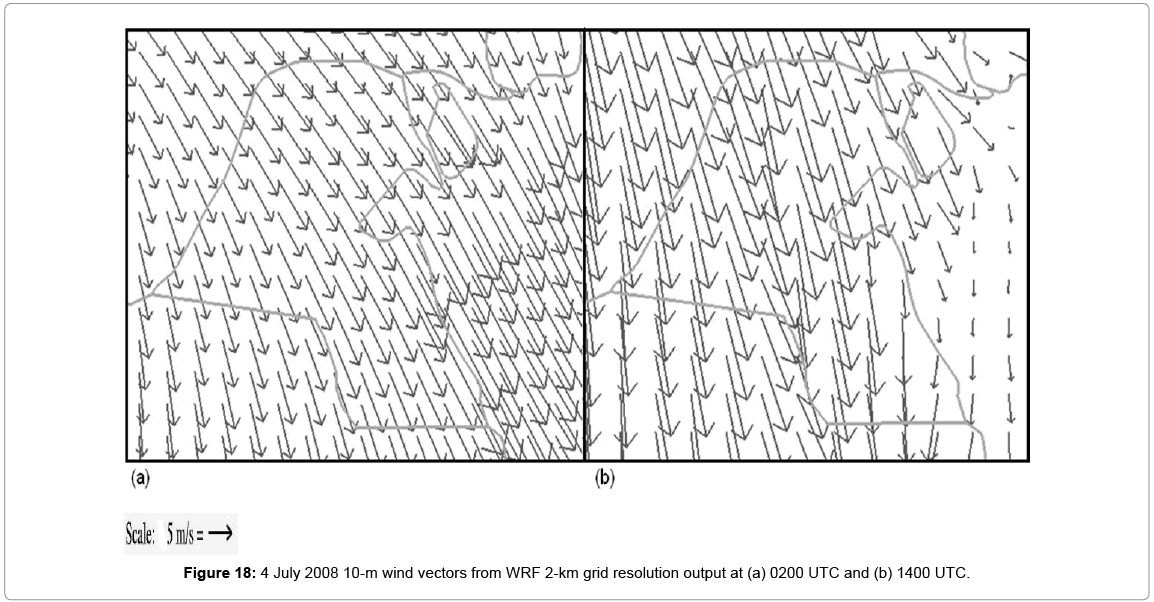
Figure 18: 4 July 2008 10-m wind vectors from WRF 2-km grid resolution output at (a) 0200 UTC and (b) 1400 UTC.
Usually when cold air from the water meets warmer air from the land, it creates a boundary similar to a cold front that is called the sea breeze convergence zone (SBCZ; Molina et al.) [9]. The strength of the thermal contrast between land and sea controls the propagation speed of the SBCZ toward land during the daytime. On 18 July, the SBCZ became evident in the Persian Gulf around 0200 UTC (Figure 19a) and reached the northern territories of Kuwait by 0400 UTC (Figure 19c). The wind field produced by WRF clearly shows the SBCZ propagating toward the land, with a convergence line in the Arabian Gulf which propagated inland.
Pollution dispersion for 14 July 2008
The HYSPLIT concentration model was driven by WRF output to investigate pollutant dispersion. The test release started at 0200 UTC on 14 July; pollutant concentration is shown in Figure 20. The strong pressure gradient across the Arabian Peninsula led to strong northwesterly to northerly wind across Kuwait. This strong wind advected the puff released at 0200 UTC rapidly southward (Figure 20). The constant northwesterly wind throughout 14 July allowed calculation of the trajectory of a puff released at only one time, since similar direction of plume advection would result even if puffs were released at different times. The dominating strong pressure gradient through most of the day led to long-range transport, supporting a hypothesis that high particulate concentrations, if observed on a day with this synoptic regime, would be advected into the area from outside [10].

Figure 19: 18 July 2008 10-m wind vectors from WRF 2-km grid resolution output at (a) 0200 UTC, (b) 0300 UTC, (c) 0400 UTC, (d) 0500 UTC, (e) 0600 UTC, (f) 0700 UTC, (g) 0800 UTC, and (h) 0900 UTC.
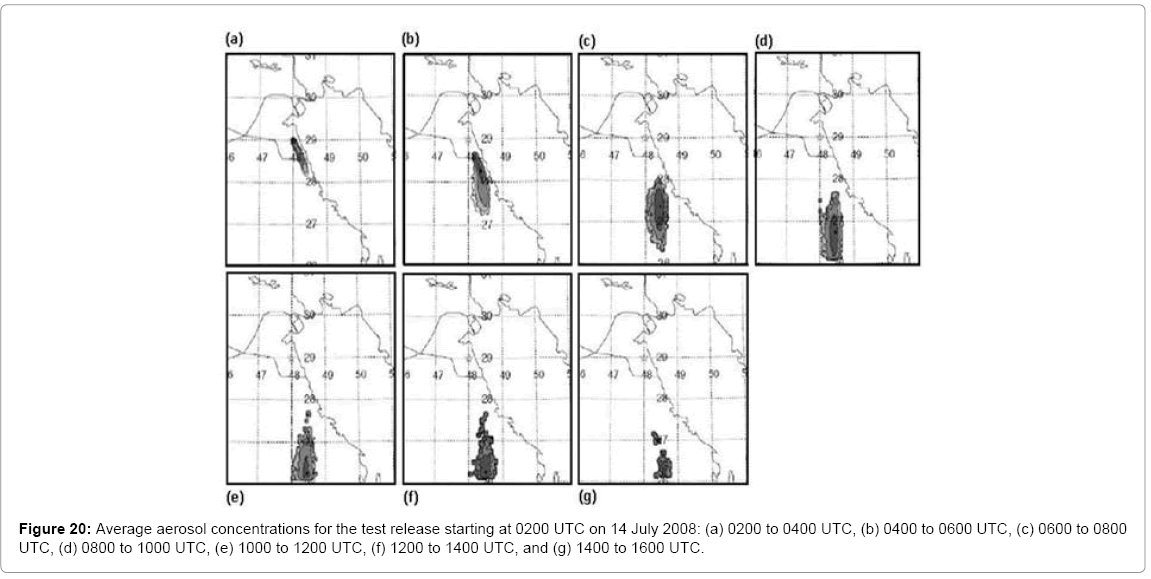
Figure 20: Average aerosol concentrations for the test release starting at 0200 UTC on 14 July 2008: (a) 0200 to 0400 UTC, (b) 0400 to 0600 UTC, (c) 0600 to 0800 UTC, (d) 0800 to 1000 UTC, (e) 1000 to 1200 UTC, (f) 1200 to 1400 UTC, and (g) 1400 to 1600 UTC.
Pollution dispersion for 18 July 2008
On 18 July, two numerical tests were performed with HYSPLIT. In the first test, puffs were released at 0200 UTC to illustrate the dispersion of pollution during the nighttime land breeze. In the second test, puffs were released at 1200 UTC to demonstrate the dispersion of pollution during the period of peak sea breeze strength.
Test 1: Plots of pollutant concentration for this case are shown in Figure 21. The concentration model showed that when the plume was released in the early morning (0200 UTC), it initially moved eastward toward the Persian Gulf. This was a result of the land breeze at night, which is directed offshore. As the wind began to shift due to sea breeze propagation between 0800 and 1000 UTC (Figure 21c), the plume started to move inland and expand near the coast. The intensification of the sea breeze pushed the plume inland, and it started to spread the plume widely in the coastal area, including farther inland (Figure 21g). As the sea breeze weakened between 2200 and 0000 UTC, the region of high concentration expanded more toward the Persian Gulf (Figure 21k). The model calculation for test 1 shows that puffs released in the early morning propagated with the land breeze, but then returned toward the land when the sea breeze was dominant, especially to the south of Kuwait.
Figure 21: Average aerosol concentrations for the test release starting at 0200 UTC on 18 July 2008: (a) 0200 to 0400 UTC, (b) 0400 to 0600 UTC, (c) 0600 to 0800 UTC, (d) 0800 to 1000 UTC, (e) 1000 to 1200 UTC, (f) 1200 to 1400 UTC, (g) 1400 to 1600 UTC, (h) 1600 to 1800 UTC, (i) 1800 to 2000 UTC, (j) 2000 to 2200 UTC,and (k) 2200 to 0000 UTC 19 July.
Test 2: Concentration maps for second test case are shown in Figure 22. The puff release in test 2 was during maximum intensity of the sea breeze (1200 UTC). Model calculations show the plume spreading widely and then propagating inland, as a result of the SBCZ propagating toward the land and pushing the plume inland (Figure 22). The sea breeze weakened during the night and the land breeze started to push the plume toward the Persian Gulf (Figure 22f). The results of test 2 show that higher pollutant concentrations were present over Kuwait than in test 1 (in which puffs were released at 0200 UTC). The concentration difference between the two simulations is best seen by comparing Figures 21i and 22d, both of which show average concentration between 1800 and 2000 UTC. The plume released early in the day during a land breeze (test 1) is transported over the Persian Gulf and away from populated areas. In contrast, the plume released during the sea breeze phase is transported over land and into populated regions.
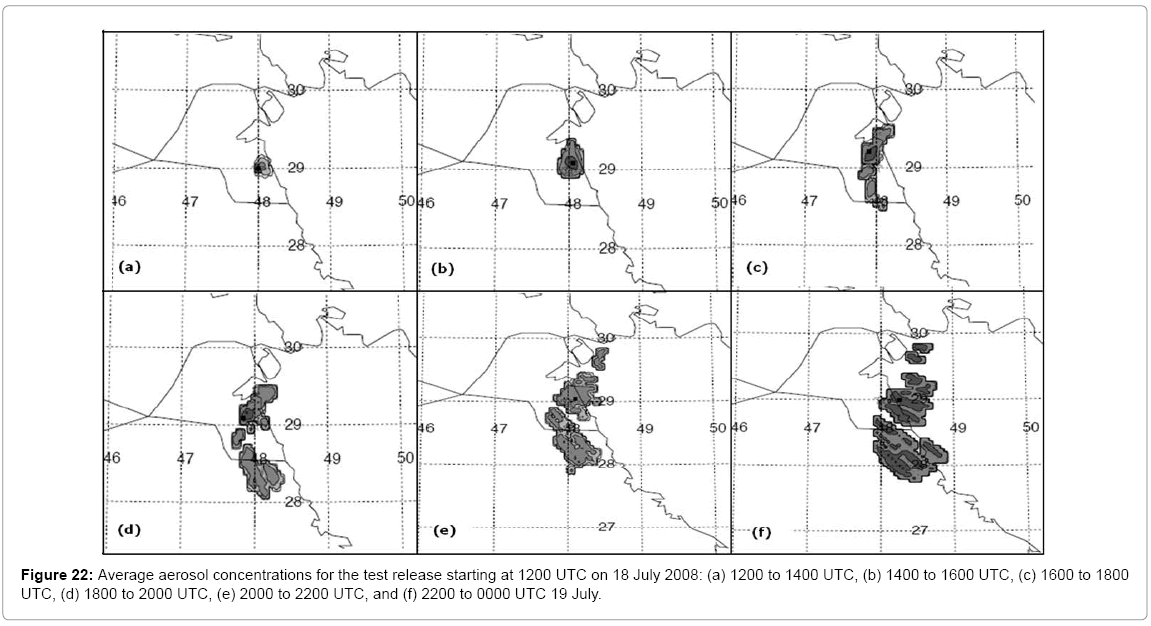
Figure 22: Average aerosol concentrations for the test release starting at 1200 UTC on 18 July 2008: (a) 1200 to 1400 UTC, (b) 1400 to 1600 UTC, (c) 1600 to 1800 UTC, (d) 1800 to 2000 UTC, (e) 2000 to 2200 UTC, and (f) 2200 to 0000 UTC 19 July.
In this paper, two case studies were investigated by using WRF model simulations to evaluate pollution dispersion under two synoptic regimes. On 14 July 2008, conditions were associated with a strong synoptic pressure gradient across the Arabian Peninsula, which overcame the mesoscale circulation in the region. The dispersion model indicated long-range southward aerosol transport due to sustained northwesterly wind. This case illustrates the contribution of strong synoptic forcing to long-range aerosol transport over the Arabian Peninsula. The second case, on 18 July 2008, was characterized by weak synoptic forcing which led to a mesoscale circulation near the Kuwait coast. The combination of a weak pressure gradient and strong solar heating caused large temperature variation between the land and the Persian Gulf, leading to sea breeze development. The WRF output for Kuwait shows progression of a sea breeze through the area during the afternoon. For this case study, two tests were completed to show varying aerosol transport. For the first test, puffs were released during the early morning land breeze and tracked through the time when a sea breeze became well-developed. The puffs moved toward the Persian Gulf early in the day due to the land breeze, then moved back inland during the afternoon due to the change of wind direction near the coast resulting from sea breeze development.
As a result, highest pollution concentration was found south of Kuwait. In the second test, puffs were released in the afternoon when the sea breeze was strong. In this test, pollution was advected inland most of the day, until the sea breeze diminished and the land breeze intensified between 2200 and 0000UTC. Dispersion model results in test 2, when pollutants were released during a sea breeze, show more pollution accumulation inland over Kuwait than test 1, when pollutants were released during a land breeze.
The two case studies have illustrated two major flow regimes in the Arabian Peninsula during the summer, which result in dissimilar aerosol transport outcomes. A local sea breeze regime, with the associated phenomena of reduced mixing depths and recirculation, can affect relatively large and often heavily-populated coastal areas. Pollutants may be effectively transported inland by the sea breeze, which should be considered by forecasters, especially in the afternoon when the wind shifts from offshore to inland. Influence of the sea breeze on pollutant concentration should also be especially considered in the summer, when it is stronger than during the cool season. Emissions should be reduced during these periods and particularly when the Shamal wind is inactive. Emissions reductions are especially important when the sea/land breeze circulation regime continues for a number of successive days.
