Research Article - (2016) Volume 4, Issue 2
Keywords: Mann-Kendall test; temporal variability; precipitation; Ladakh; Himalayas
Mountain systems account for roughly 20 per cent of the terrestrial surface area of the globe and are found on all continents. They are usually characterized by sensitive ecosystems and enhanced occurrences of extreme weather events and natural catastrophes; they are also regions of conflicting interests between economic development and environmental conservation [1]. Once, regarded as hostile and economically nonviable regions, mountains have attracted major economic investments for industry, agriculture, tourism, hydropower, and communication routes [1]. The mountains provide the direct lifesupport base for about a tenth of humankind and indirectly affect the lives of more than half of the global population [2].
Mountains especially Himalayas, are widely recognized as areas containing highly diverse and rich ecosystems, and thus, they are key elements of the global geosphere-biosphere system. At the same time, mountains contain ecosystems that are quite sensitive and highly vulnerable to natural risks, disasters, and ecosystem changes, be it through the occurrence of rapid mass movements, such as landslides, or via slow land degradation due to human activities, with all the attendant socioeconomic consequences [3].
The Himalayan Mountains of snow have also been called the third pole, since they are the third largest body of snow on our planet after the Antarctic and Arctic [4]. Almost 9.04% of the Himalaya is covered with glaciers, with 30-40% additional area being covered with snow [5]. They feed the giant rivers of Asia, and support half of humanity [4]. They abode highly fragile and sensitive ecosystems which provide vital clues about the impact of global warming and other man induced ecological imbalances.
Prevalence of varied climatic conditions that are similar to those of widely separated latitudinal belt, within a limited area, make the high mountain areas such as Himalaya, the Alps, the Andes, the Rockies etc. the ideal sites for the study of climate change [5]. The high mountains of South Asia covering the Hindukush, Karakoram Himalayan belt have reported warming trend in the past few decades [6,7]. A study of precipitation data for a fairly long period is essential for estimating its distribution and other characteristics like irrigation, availability of ground water, vegetative cover.
Leh (Ladakh), which lies in the north-western Himalayas also exhibit the impact of global environmental changes as has been reported by a number of studies conducted all over the world. Ganjoo in his study on 114 glaciers of the Nubra sub-basin came to the conclusion that 39 glaciers (34%) have shown gain in the area, 43 glaciers (38%) have vacated the area and 32 glaciers (28%) do not show any change in their area [8]. The monitoring of snouts of 2018 glaciers in Himalaya and Karakorum for the period 2001-2010/11 with the help of satellite imageries has further revealed that 1752 (86.8%) glaciers are stable in their position, 248 (12.3%) glaciers have shown retreat in their snout positions whereas 18 (0.9%) glaciers have advanced confirming the erratic behaviour of glaciers with respect to latitude, elevation and climatic/weather variation from region to region [8].
In Ladakh, the northern most region of India, all life depends on snow. Ladakh is a high elevated cold desert [9] with only 50-70 mm of average annual rainfall. Ladakh’s water comes from the snow melt both the snow that falls on the land and provides the moisture for farming and pastures, as well as the snow of the glaciers that gently melts and feeds the streams that are the lifeline of the tiny settlements [4].
Thus the present study aims to analyze the trends of changing precipitation regimes in the cold desert of Leh Ladakh.
Ladakh region of Jammu and Kashmir state situated in the western Himalayas is a low rainfall zone situated on the leeward side of the Zanskar range in the western Himalayas with Leh (34.09 N / 77.34 E, 3514 m asl) as the main town in the region. Leh with an area of 45110 Sq Km makes it largest district in the country in terms of area. It is at a distance of 434 Kms from Srinagar and 474 Kms from Manali.
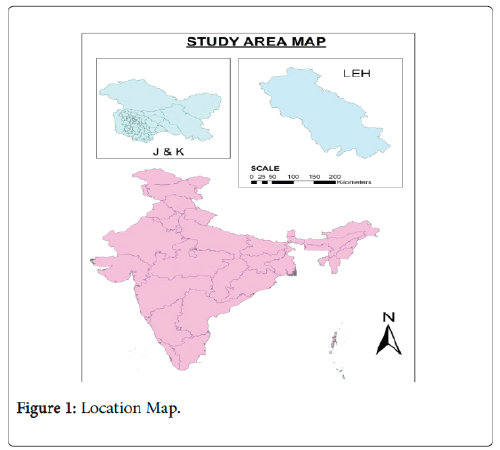
Figure 1: Location Map.
Physiographically, Leh is bounded by the Ladakh range to its north and the east and by the Zanskar range to its south and west. Greater Himalayan range lie further southwest of the Zanskar range. The town is situated on the right bank of river Indus which traverse the ladakh region from southeast to northwest.
Ladakh lies on the rain shadow side of the Himalayas, where dry monsoon winds reach Leh after being robbed of its moisture in plains and the Himalayan Mountain. The district combines the condition of both arctic and desert climate. Therefore Ladakh is often called “COLD DESERT” [9]. Wide diurnal and seasonal fluctuations in temperature with -40°C in winter and +35°C in summer are observed. Precipitation is very low mainly in the form of snow. Air is very dry and relative humidity ranges from 6-24%. Due to high elevation and low humidity the radiation level is very high. The global solar radiation is as high as 6000-7000 W/m2 (which is among the highest in the World). Dust storms are very common in the afternoon. Soil is thin, sandy and porous. The entire area is devoid of any natural vegetation. Irrigation is mainly through channels from the glacier-melted snow.
The greater Himalayan ranges are the highest among the three and act as a barrier for the eastward moving systems. Precipitation decreases considerably towards east of this range. Leh being east of Zanskar range receives very little annual precipitation as most of the weather systems move from west to east across the region. The station receives precipitation in form of both rainfall and snowfall. The total annual precipitation of Leh is about 50-70 mm with July and august being the rainiest months with mean rainfall of 15.2 and 15.4 mm, respectively. The average number of rainy days for both the months is two each.
Records of Monthly precipitation (mm) of Meteorological station Leh available from 1901 to 2000 have been obtained from the National data center of the Indian Meteorological Department (IMD), Pune and Meteorological centre (IMD) Srinagar. The same have been used to compute the seasonal variability of precipitation for Leh. Due to the profound impact of only two seasons in the Ladakh region, only summer (June-august) and winter months (November-February) were taken into consideration depending upon climatic conditions prevailing over the region. The summer and winter precipitation data was plotted against time, and trends were examined by fitting the Time series analysis to the data. Linear trends were also drawn to analyze the pattern of precipitation over the last 100 years of the study period.
For detecting trend in a variable, the data series is smoothened. In the present study, 5-year moving average was applied. Basically, it performs low pass filtering in time domain. By doing this smoothening, the year-to-year variations get suppressed and dominant behaviour, if any, emerges. If there is increasing trend in the climatic series, then the slope coefficient should be positive and statistically significant. Conversely, for decreasing trend in behaviour of a variable the slope value should be negative.
For this study, the widely used Mann-Kendall test was run on time series data for the time period, 1901 to 2000. The Mann-Kendall test is a non-parametric test for identifying trends in time series data. Non parametric Mann-Kendall method is a distribution-free method, more resistant to outliers, can usually be used with gross data errors, and can deal with the missing data values unlike the parametric method [10]. Mann-Kendall rank test is widely used in environmental monitoring for its simplicity and the focus on pair-wise slopes [11]. However, non parametric methods are fraught with more uncertainty in the statistical estimates than the parametric method [12]. The test was suggested by Mann and has been extensively used with environmental time series. This test detects the presence of a monotonic trend within a time series [13] with different significance levels p: 0.1, 0.05, 0.1 and 0.001. The Mann-Kendall S Statistic is computed as follows:
MKT = [(4Σni / N (N-1)] -1
With
var (MKT) = [(4N+10) / (9N (N-1)]
Where ni is the no. of values larger than the ith value in the series subsequent to its position in the series of N values.
Long term trends have been utilized to detect changes in the pattern of winter as well as summer precipitation in the study area by utilizing time series analysis and applying Mann-Kendall test for showing the monotonic trend in the series. Winter precipitation shows rising trend although of a little order and is statistically significant at (0.1 significance level) which is a healthy sign with respect to the glacial environment of study area. Summer precipitation shows a decreasing trend over the last century in the area.
The complex topographic setting, altitudinal variation from glacier basin to glacier basin, impact of monsoon in high altitudes, variation in various parameters of micro-climate [11], increase and/or decrease in the cloudiness, encroachment of human population to the interiors of high altitude of Karakorum-Himalaya [12] can be some of the factors in the erratic movement of the glaciers. A slight variability or fluctuation in climate could prove detrimental to the agriculture, horticulture and fast emerging hydel power sector in the Leh, Ladakh [13].
Trends in winter precipitation
Although average winter precipitation in Leh is only 27.38 mm, it is highly erratic and fluctuating. Occasionally Leh has received precipitation much higher than normal (1975, 1988) and on the other hand it has experienced a deficit, much below than the normal winter precipitation like in 1902, 1904, 1952, 1987.
If we analyze the monthly pattern of precipitation during four winter months, January comes out as the most precipitous month during the study period with average 11.3 mm precipitation followed by February (7.8 mm), December (5.8 mm) and November with 2.3 mm precipitation respectively.
Overall the winter precipitation has been on a slight rise during last century. The rise is of the order of nearly 0.04 mm per year which accounts to 0.40 mm per decade (Figure 2). The major characteristic of it being the precipitation in the form of snowfall. The linear slope analysis of the winter season in Leh reveals a positive trend with a slope of 0.042 when drawn on y=mx+c.
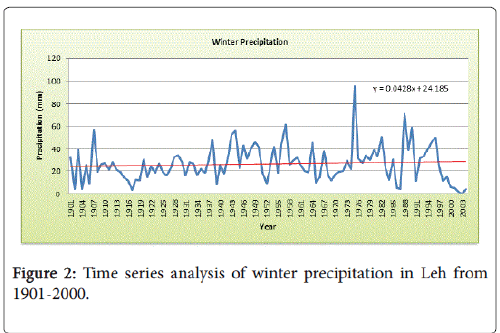
Figure 2: Time series analysis of winter precipitation in Leh from 1901-2000.
Trends in summer precipitation
The summer months of have shown an average precipitation of 30.67 mm during 1901-2000 with August (14.4 mm) being the rainiest month followed by July and then June with 12.3 mm and 3.8 mm respectively. The precipitation in the summer is usually in the form of rainfall with linear trend showing an overall decline during past century with recent decades showing some positive trend in summer season rainfall. A reduction of 0.127 mm per year in the summer precipitation is observed over the time period 1901-2000 in Leh (Figure 3).
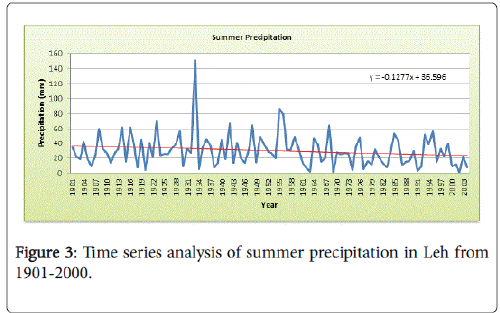
Figure 3: Time series analysis of summer precipitation in Leh from 1901-2000.
Decadal trend analysis
The decadal analysis reveals that Leh received 68.09 mm rainfall in 4 months during 1901-2000 which showed negative trend up to 1940. The winter precipitation showed a positive trend during 1941-1950 which was 95.8 mm and thereafter for two decades there was decrease in winter precipitation upto 1970. The 1971-1980 decade showed a positive trend with 86.4 mm precipitation and again showed a decrease upto 66.5 mm during 1991-2000. The summer precipitation during 1901-2000 was 101.9 mm which continuously increased for next 60 years which touched 140 mm during 1951-1960. The period from 1961-1990 showed a slight decrease in summer precipitation but it again started to rise reaching 92.1 mm during 1991-2000.
Applying Mann-Kendall test statistic (Z) indicates how strong the trend in precipitation is and whether it is increasing or decreasing.
| Technique | Season/Month | Z value | Trend Magnitude | Trend | Significance (0.10) |
| Mann-Kendall test | Summer Precipitation | -1.102 | -0.127 | Decreasing | Insignificant |
| Winter Precipitation |
1.92 | 0.042 | Increasing | Signficant |
Table 1: Mann-Kendall test.
Applying Mann-Kendall test statistic (Z) indicates how strong the trend in precipitation is and whether it is increasing or decreasing.
For average summer precipitation, Mann-Kendall test shows very low value of Z-statistic (-1.102) indicating an insignificant trend. The non-significant trend of Mann-Kendall test is indicative of decreasing precipitation during summer months, as indicated by time series.
For average winter the value of S obtained on positive side indicating increasing trend and is statistically significant at 99% significance level in Mann-Kendall test. The Z statistic for the average winter is 1.92 indicating an increasing trend in the winter precipitation during the study period.
The Mann-Kendall test was also applied for the winter and summer months taking into consideration their average precipitation during the study period. The test reveals a statistically insignificant trend for the all the winter months. Out of the summer months only June shows a statistically significant trend at 90% significance level, whereas the months of July and August follow an insignificant trend.
This study has been done for the study period of 100 years i.e. 1901-2000. The study area comprises of a mountainous topography with its water coming mainly from the snow melt. It reveals that there are discernable variations in the core summer and core winter precipitation in different months for different years with the variation extending across decades. From the trend analysis of precipitation data, it can be concluded that there is a decrease in summer precipitation in the study area, which is confirmed by Mann-Kendall Statistics. However, the study also reveals increasing trend of precipitation during the winter months. This erratic behavior of precipitation regime can have far reaching consequences and can influence the socio-economic conditions of the people living in the region.
