Research Article - (2016) Volume 4, Issue 1
Keywords: Climate response; Mann-kendall trend test; Urban and desert areas of China
The air temperature is one of the key parameters used in classification of climatological zones, for instance: temperate, humid, desert and semi-desert [1]. The variation of daily temperature is controlled mainly by incoming solar energy and outgoing long-wave surface radiation [2]. The air temperate does not vary in isolation and one of the cases is explained by Bryan et al. [3] of high temperatures and high pollution concentrations being associated with strength of high pressure systems and sunny (with fast photolysis rates) conditions.
Over a large area and over a long time, the temperatures can be averaged and thus assisting to describe the climate of area in terms of hotness/coldness. While weather elements vary from day to day or even place to place [4], climate too exhibits variability inter or intra season as well as inter or intra annual.
The changes in climate may manifest as changes in the mean state or in variability of their cycles [3]. Boko [5] illustrates these changes graphically as (Figures 1-3).
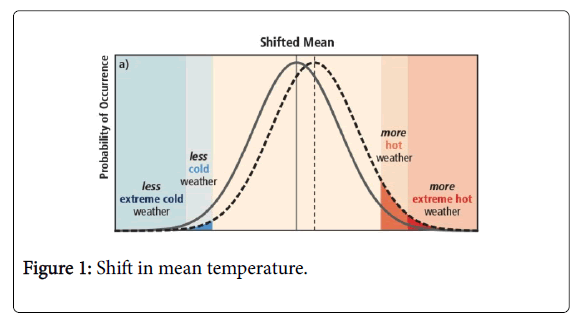
Figure 1: Shift in mean temperature.
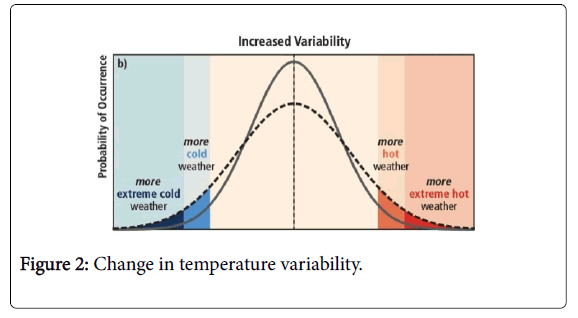
Figure 2: Change in temperature variability.
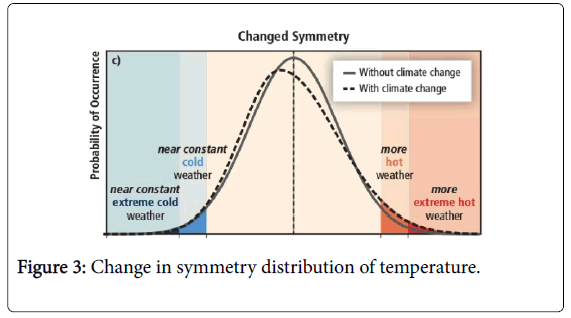
Figure 3: Change in symmetry distribution of temperature.
Climate change and variability has remained a research problem over the years. The previous studies demonstrated changes in precipitation, temperature, and other climatic parameters as well as vegetation cover [6] and these changes have been linked to economic development and urbanization [7]. Additionally, climate extremes have increased both in frequency and magnitude [8] but other areas have seen notable decline [9].
One of the indicators of climate change is changes in temperature and according to Roy et al. [10]; local temperature change is influenced by urbanization. A change in average temperature, can affect the amount of cloudiness as well as the type and amount of precipitation that Occurs [11] and is attributed to changes in radiative forcing [8,12,13] such as changes in landscape leading to changes in surface reflectivity to solar radiation; surface moisture variability; modification of vegetation cover as well as anthropogenic heat release which combine and cause temperature rise.
The increase in temperature has impacts such as: increased incidence and severity of heat-waves, droughts [13,14]; shrinking of glaciers ice caps, mountain glaciers, and permafrost regions of the world [15] and can affect growing practices such as sowing dates and cultivars [16]. The global temperatures are estimated to have increased by 0.5-0.6°C over the last century [9,13] and are estimated to increase by 0.3-0.7°C by 2035 [17].
Due to differential rates of development and urbanization as well as differences in land surface characteristics, we can expect different trends of temperature over deserts and cities. This is because, the economic development of a region is directly correlated with urbanization [18,19] and urbanization affects surface greenness and leads to changes in surface albedo [12]. Thus these changes affect receipt of solar radiation on the earth and influence air temperature. Additionally urbanization and industrialization have led to increase in greenhouse gases (GHGs) which has also influenced temperature [20]. In recent years, China has experienced massive industrial growth and economic development as well as increased urbanization [21]. The growth of cities introduces the need for constant monitoring of weather and climate over different regions of China.
Although temperature trends have been studied in many regions of the world [17], studies considering differential responses of temperature over desert and cities are limited. We compare the temperature variability including their extremes over cities and desert areas of Northern China for the period 1981-2010. The study areas are presented in Figure 4; section 2 describes the data sources, section 3 presents the study methods, section 4 presents results and discussion while section 5 gives summary and conclusion.
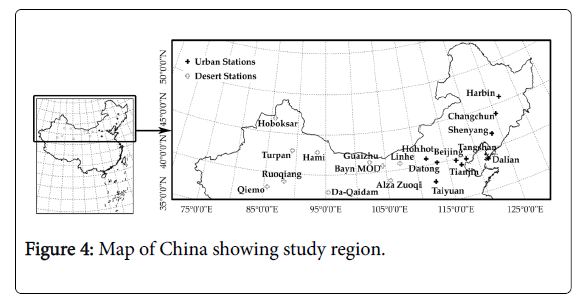
Figure 4: Map of China showing study region.
The daily maximum and minimum temperature data is obtained from the School of Atmospheric Science of Nanjing University of Information Science and Technology (NUIST). This data is regularly updated and quality controlled to take care of the on-going research in the university. The data is then organized into temporal scales (annual, spring and summer). The diurnal temperature range (DTR) is computed from eqn. (1) as the difference between daily maximum temperature (Tmax) and daily minimum temperature (Tmin) and is also organized in terms of annual and seasonal temporal scales.
DTR = Tmax - Tmin (1)
The high temperature days are computed according to Thomas et al. [13] as days that have Tmax exceeding 32.0°C and the number of days with extreme high temperature is those that exceed 90th percentile of daily observed Tmax. Our study used a higher threshold of 35.0°C for high temperature days and the number of days with extreme high temperatures as those with Tmax over the 95th percentile. The extreme low temperature as those days with Tmin below the 5th percentiles of daily Tmin and the frost days as the days with Tmin below 0°C.
In order to study the trends of temperature over regions of different climatology, the relative deficit and or surplus (anomalies) of temperature  are used and calculated using the eqn (2).
 (2)
(2)
Ti is temperature in question and  is respective long-term mean temperature over the study period. The of a temperature data set, {T1, T2, ..., Tn} is computed using eqn (3):
 (3)
(3)
The Mann-Kendal trend test
The Mann-Kendall (MK) trend test is used to analyze the trends of: Tmax, Tmin and DTR. The MK is recommended by Qiang et al. [22] because it is (1) a rank-based nonparametric test, able to test trends without requiring normality or linearity; (2) less sensitive to outliers and (3) recommended by the World Meteorological Organization. Additionally Jagannathan and Parthasarathy [23] have identified the MK test as powerful for testing trends that are linear or non-linear. For a time ordered temperature data-set, we define MK trend test statistic, S (eqn. 4):
 (4)
(4)
where sgn(Tj - Ti) is:
 (5)
(5)
for non-tied values of Ti, the variance δ2(S) of the distribution of S is computed using:
 (6)
(6)
for tied values of Ti, the variance is given by:
 (7)
(7)
ti is number of ties of extent i. The MK test statistic is then given by the standard Gaussian value, M Kz defined as:
 (8)
(8)
The computation of temperature extremes
We use Jenkinson [24] formula (eqn. 9) for computing extreme temperatures. This formula is discussed by Chris and Anderson [25] in comparison with other formula for studying extremes and is recommended for the study of climate extremes [25,26]. According to the Jenkinson formula, the probability, p that a random value is less than or equal to the rank of that value, Ti is given by:
 (9)
(9)
where m is the position of the value and n is the number of values in the data set. The Ti for example summer season which has 92 days, is arranged in ascending order: {T1, T2, · · ·, T91, T92}. The Ti representing the 95th percentile is linearly interpolated between the 88th ranked value (giving: p=94.9%) and 89th ranked value (p=96.0%). The 95th percentile is thus interpolated.
We considered high temperature days, frost days, high temperature extremes and low temperature extremes. The high temperature days are the days with Tmax greater than 35.0°C, frost days are the days with Tmin below 0°C, high temperature extreme days are the number of days with Tmax over the 95th percentiles of daily Tmax, while low temperature extreme days are the days with Tmin below the 5th percentiles of daily Tmin. The number of days with extreme high temperature and extreme low temperature are obtained using the Jenkinson formula (eqn. 9).
Regression method
We use regression to obtain the decadal (10 year) rate of changes of temperature, described as under. Given an n time-ordered temperature dataset: {T1, T2, · · ·, Tn−1, Tn}, ordered in time, t the linear regression equation is given as:
 (10)
(10)
where
i=1, 2, · · ·, n
α is the rate of change, is the error and the decadal rate of change of temperature (α10) is computed as:
 (11)
(11)
Annual temperature trends
The annual temperature trends over deserts (Table 1) and over cities (Table 2) are obtained using MKz at 99% confidence level. Over deserts, we find an increasing trend for both Tmax (MKz=0.431) and Tmin (MKz=0.407) and a decreasing trend for DTR (MKz=-0.091). The annual DTR shows high variability (Figure 5). It peaked during the period 1990-2000 and declining over the period 2001-2010. This variability probably explains the weak decreasing trend in Table 1. The annual trends of DTR for individual stations were in the range of: -0.35°C/decade to -0.04°C/decade. The Tmax has been increasing since 1985 (Figure 6) in the range of 0.36-0.70°C/decade and on average at 0.51°C/decade. The Tmin shows a high variable increasing trend (Figure 7) in the range of 0.06-0.8°C/decade and on average at 0.52°C/decade. This rate is slightly greater than that of Tmax. We thus argue that Tmin increase faster than Tmax which could be accounting for the rate of decrease of DTR over deserts in (Table 1).
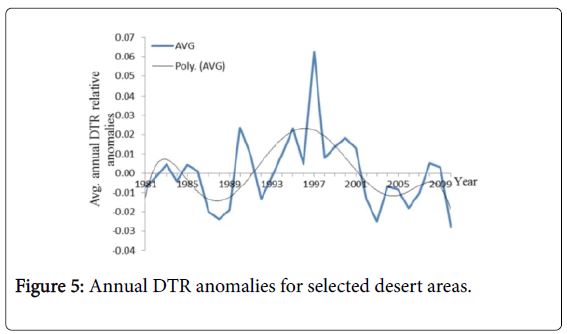
Figure 5: Annual DTR anomalies for selected desert areas.
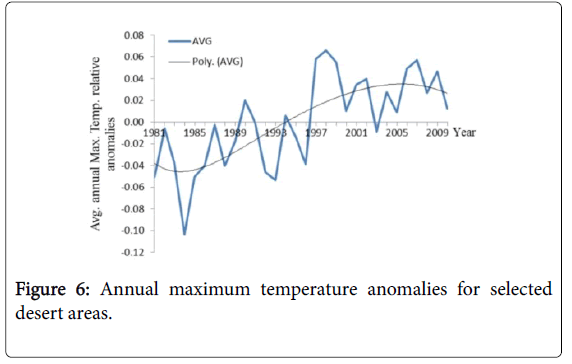
Figure 6: Annual maximum temperature anomalies for selected desert areas.
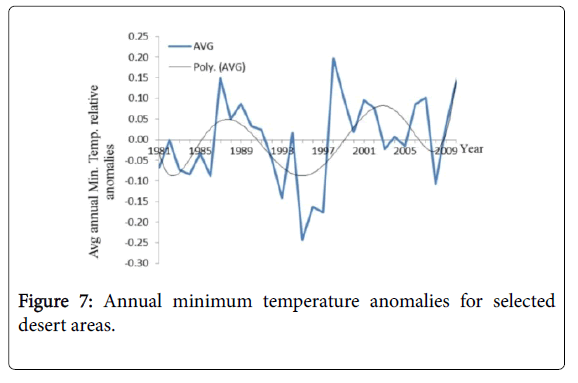
Figure 7: Annual minimum temperature anomalies for selected desert areas.
| Station | Tmax | Tmin | DTR |
|---|---|---|---|
| Alza Zuoqi | 0.370 | 0.527 | -0.457 |
| Bayn MOD | 0.448 | 0.037 | 0.269 |
| Da-Qaidam | 0.591 | 0.497 | -0.067 |
| Guaizhu | 0.301 | 0.467 | -0.223 |
| Hami | 0.444 | 0.144 | 0.301 |
| Hoboksar | 0.264 | 0.385 | -0.269 |
| Linhe | 0.315 | 0.480 | -0.545 |
| Qiemo | 0.522 | 0.406 | 0.278 |
| Ruoqiang | 0.545 | 0.531 | 0.177 |
| Turpan | 0.508 | 0.596 | -0.375 |
| Average | 0.431 | 0.407 | -0.091 |
Table 1: Annual temperature variation for desert areas.
| Station | Tmax | Tmin | DTR |
|---|---|---|---|
| Beijing | 0.260 | 0.545 | -0.384 |
| Changchun | 0.269 | 0.416 | -0.320 |
| Dalian | 0.228 | 0.370 | -0.315 |
| Datong | 0.402 | 0.554 | -0.292 |
| Harbin | 0.260 | 0.582 | -0.683 |
| Hohhot | 0.384 | 0.577 | -0.503 |
| Shenyang | 0.140 | -0.145 | 0.214 |
| Taiyuan | 0.407 | 0.697 | -0.393 |
| Tangshan | 0.343 | 0.485 | -0.398 |
| Tianjin | 0.214 | 0.016 | 0.145 |
| Average | 0.291 | 0.410 | -0.293 |
Table 2: Annual temperature variation for cities.
Over cities, we find both Tmax and Tmin increasing annually with exception of Shenyang and a decreasing DTR (MKz=-0.293). The annual DTR for cities decrease sharply (Figure 8) in the range of -0.659 to -0.146°C/decade and on average -0.238°C/decade. The Tmax is increasing (Figure 9) in the range of 0.11 to 0.501°C/decade and an average of 0.325°C/decade.
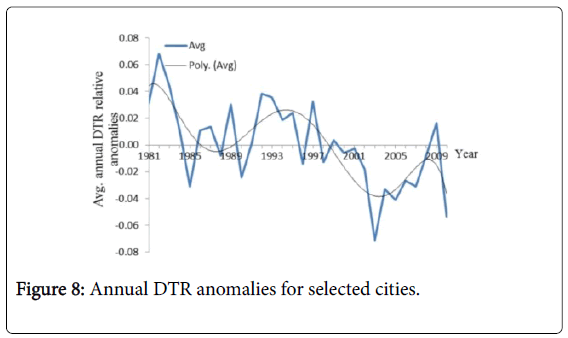
Figure 8: Annual DTR anomalies for selected cities.
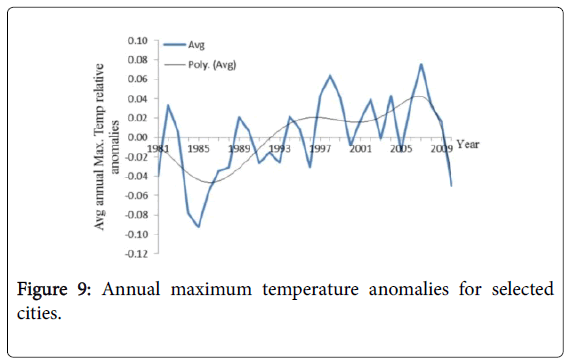
Figure 9: Annual maximum temperature anomalies for selected cities.
The Tmin (Figure 10) does not present plausible results but we can infer that Tmin was decreasing slightly over the period 1995-2010. With exception of Shenyang, the annual Tmin trends for individual stations were increasing in the range of 0.022 to 1.015°C/decade and an average of 0.566°C/decade. Thus the annual rate of increase of Tmin is greater than that of Tmax over cities.
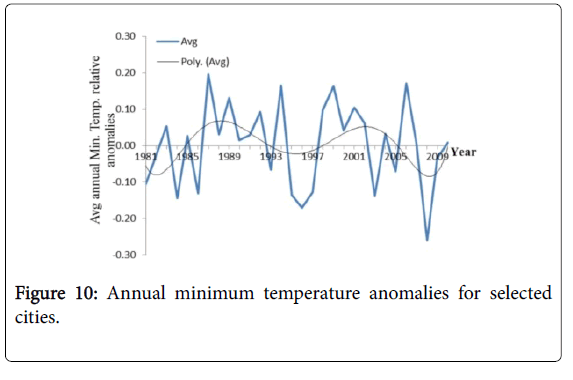
Figure 10: Annual minimum temperature anomalies for selected cities.
Spring temperature trends
The spring temperature trends over deserts (Table 3) and over cities (Table 4) are obtained using MKz at 99% confidence level.
| Station | Tmax | Tmin | DTR |
|---|---|---|---|
| Alza Zuoqi | 0.274 | 0.416 | -0.218 |
| Bayn MOD | 0.329 | 0.195 | 0.149 |
| Da-Qaidam | 0.467 | 0.301 | 0.122 |
| Guaizhu | 0.191 | 0.375 | -0.260 |
| Hami | 0.255 | 0.269 | 0.113 |
| Hoboksar | 0.149 | 0.324 | -0.209 |
| Linhe | 0.195 | 0.499 | -0.370 |
| Qiemo | 0.411 | 0.425 | 0.297 |
| Ruoqiang | 0.343 | 0.508 | 0.090 |
| Turpan | 0.177 | 0.425 | -0.209 |
| Average | 0.279 | 0.374 | -0.050 |
Table 3: Spring temperature variation for desert areas.
| Station | Tmax | Tmin | DTR |
|---|---|---|---|
| Beijing | 0.154 | 0.338 | -0.195 |
| Changchun | 0.113 | 0.264 | -0.278 |
| Dalian | 0.214 | 0.320 | -0.175 |
| Datong | 0.186 | 0.377 | -0.195 |
| Harbin | -0.002 | 0.324 | -0.511 |
| Hohhot | 0.246 | 0.457 | -0.297 |
| Shenyang | 0.117 | -0.039 | 0.039 |
| Taiyuan | 0.315 | 0.476 | -0.228 |
| Tangshan | 0.163 | 0.384 | -0.338 |
| Tianjin | 0.195 | 0.149 | 0.090 |
| Average | 0.170 | 0.410 | -0.293 |
Table 4: Spring temperature variation for cities.
Over deserts, we find both spring Tmax and Tmin increasing. The DTR over five stations is increasing while the rest are decreasing. On average, DTR is decreasing (MKz=-0.050) and it increased over the period 1990-2010 (Figure 11). Both Tmax (Figure 12) and Tmin (Figure 13) are increasing at MKz=0.279 and MKz=0.374 respectively and increased over the period 1987-2007. The differential increases in trends of Tmax and Tmin, can in part explain the moderate increase of DTR over the same period. The rate of decrease of DTR of individual stations is in the range of -0.547 to -0.18°C/decade except for the stations that presented an increasing DTR trend.
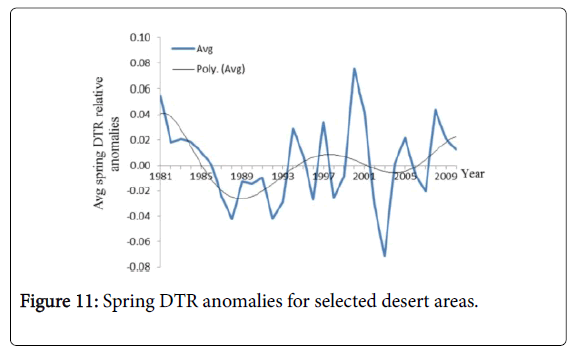
Figure 11: Spring DTR anomalies for selected desert areas.
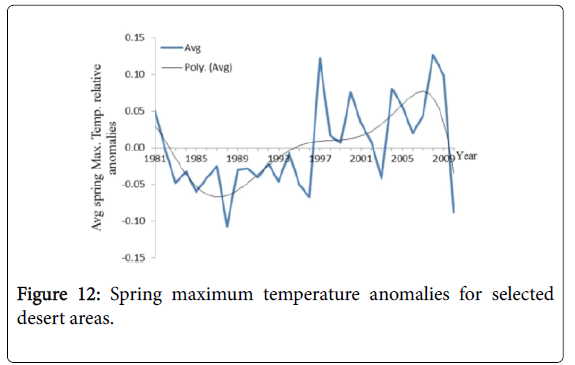
Figure 12: Spring maximum temperature anomalies for selected desert areas.
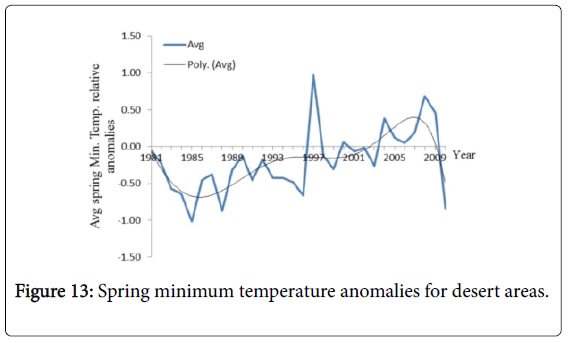
Figure 13: Spring minimum temperature anomalies for desert areas.
In general, the rate of decrease of DTR over 1981-2010 is -0.023°C/ decade (negative sign is maintained to emphasize the decrease and differentiate it from increasing trend, where increase is shown with a positive sign). The spring Tmax is in general increasing in the range of 0.3-0.8°C/decade and on average at 0.54°C/decade. The spring Tmin, (Figure 13) is increasing too in range of 0.23-0.85°C/decade with an average of 0.56°C/decade.
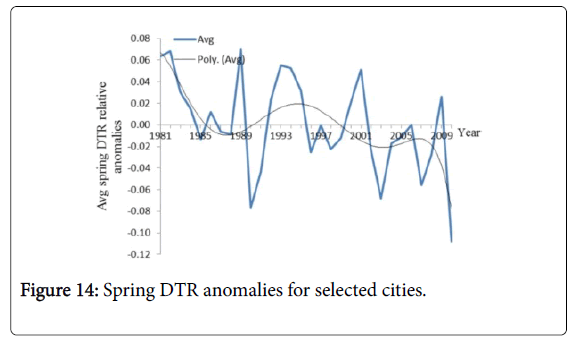
Figure 14: Spring DTR anomalies for selected cities.
Over cities, we find an increasing trend of both spring Tmax and Tmin with exception of Harbin whose Tmax is decreasing and Shenyang’s Tmin. The DTR is decreasing (MKz=-0.209) with the exception of Shenyang (Figure 14) in the range of -0.829 to -0.157°C/ decade and on average at -0.307°C/decade.
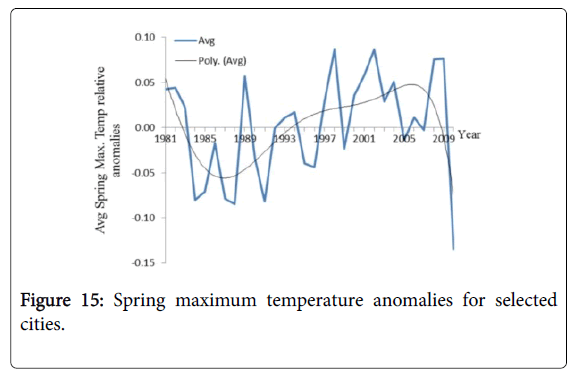
Figure 15: Spring maximum temperature anomalies for selected cities.
The spring Tmax (Figure 15) is increasing with an average MKz of 0.170 and in the range of 0.052 to 0.533°C/decade and overall rate of 0.252°C/decade. The spring Tmin (Figure 16) is increasing as well with exception of Shenyang in the range of 0.137 to 0.928°C/decade and overall increasing at 0.560°C/decade.
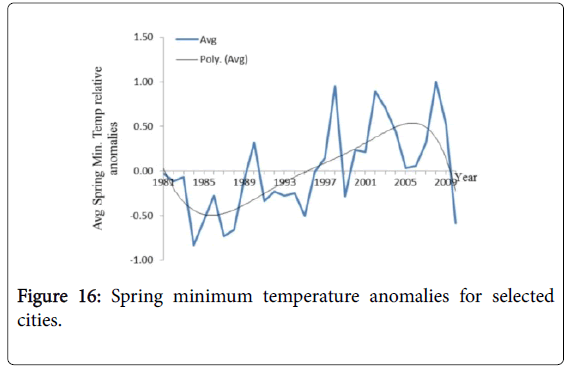
Figure 16: Spring minimum temperature anomalies for selected cities.
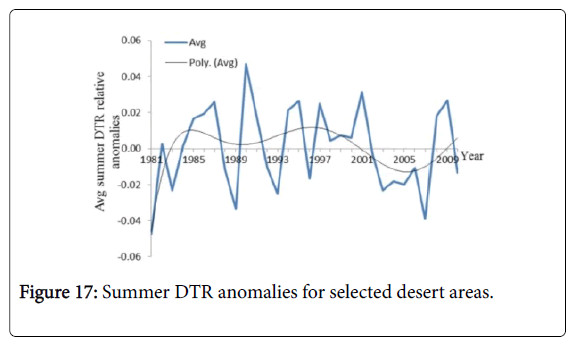
Figure 17: Summer DTR anomalies for selected desert areas.
The rate at which spring Tmin is increasing (0.560°C/decade) is greater than the rate of spring Tmax (0.252°C/decade) which probably explains the decreasing trend of spring DTR (-0.307°C/decade).
Summer temperature trends
The summer temperature trends over deserts (Table 5) and over cities (Table 6) are obtained using MKz at 99% confidence level.
| Station | Tmax | Tmin | DTR |
|---|---|---|---|
| Alza Zuoqi | 0.287 | 0.444 | -0.301 |
| Bayn MOD | 0.343 | 0.292 | 0.278 |
| Da-Qaidam | 0.439 | 0.513 | -0.232 |
| Guaizhu | 0.434 | 0.410 | 0.062 |
| Hami | 0.485 | 0.195 | 0.315 |
| Hoboksar | 0.324 | 0.434 | -0.090 |
| Linhe | 0.278 | 0.526 | -0.315 |
| Qiemo | 0.494 | 0.343 | 0.159 |
| Ruoqiang | 0.522 | 0.462 | -0.039 |
| Turpan | 0.499 | 0.333 | 0.163 |
| Average | 0.411 | 0.395 | −2.8 × 10⁻¹⁸ |
Table 5: Summer temperature variation for desert areas.
| Station | Tmax | Tmin | DTR |
|---|---|---|---|
| Beijing | 0.228 | 0.494 | -0.255 |
| Changchun | 0.287 | 0.352 | -0.136 |
| Dalian | 0.085 | 0.186 | -0.145 |
| Datong | 0.352 | 0.526 | -0.011 |
| Harbin | 0.267 | 0.494 | -0.287 |
| Hohhot | 0.324 | 0.536 | -0.067 |
| Shenyang | 0.071 | -0.057 | 0.182 |
| Taiyuan | 0.379 | 0.568 | -0.140 |
| Tangshan | 0.237 | 0.384 | -0.329 |
| Tianjin | 0.154 | 0.186 | 0.094 |
| Average | 0.238 | 0.367 | -0.109 |
Table 6: Summer temperature variation for cities.
Over deserts, the summer Tmax and Tmin are increasing with DTR for five stations increasing while the rest decreasing. We find a moderate decreasing trend for summer DTR over the deserts (Figure 17) in the range of 0.026 to 0.382°C/decade. The summer Tmax is increasing (Figure 18) as well in the range of 0.369 to 0.723°C/decade and on average 0.55°C/decade. The summer Tmin is also increasing sharply over the period 1985-2010 in the range of 0.28 to 0.94°C/ decade and on average 0.536°C/decade (Figure 19).
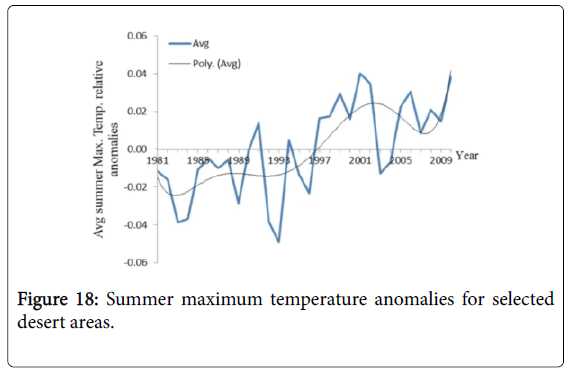
Figure 18: Summer maximum temperature anomalies for selected desert areas.
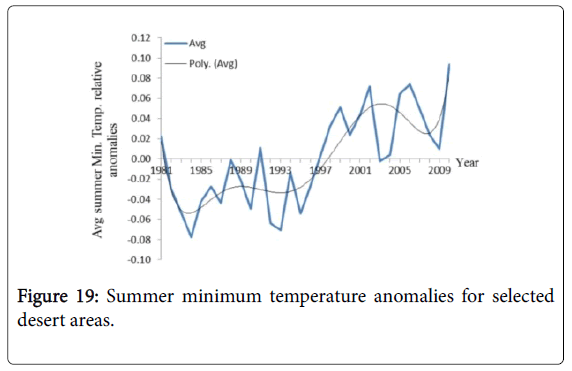
Figure 19: Summer minimum temperature anomalies for selected desert areas.
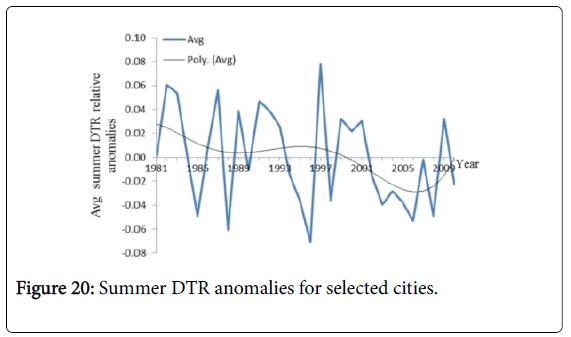
Figure 20: Summer DTR anomalies for selected cities.
Over cities, we find increasing trends of summer Tmax and Tmin except Shenyang’s Tmin and decreasing trend of DTR (MKz=-0.109) (Figure 20). The trend of summer DTR is in the range of -0.419 to -0.023°C/decade and on average decreasing at a rate of -0.140°C/ decade. The summer Tmax (Figure 21) is increasing over the period 1991-2010 in the range of 0.107 to 0.684°C/decade and in general, at a rate of 0.389°C/decade. From 1993, the summer Tmin is also increasing (Figure 22) with exception of Shenyang in the range of 0.144 to 0.864°C/decade and in general increasing at 0.529°C/decade. Thus the rate of increase of Tmin (0.529°C/decade) is greater than that of Tmax (0.389°C/decade) explaining the decreasing trend of DTR.
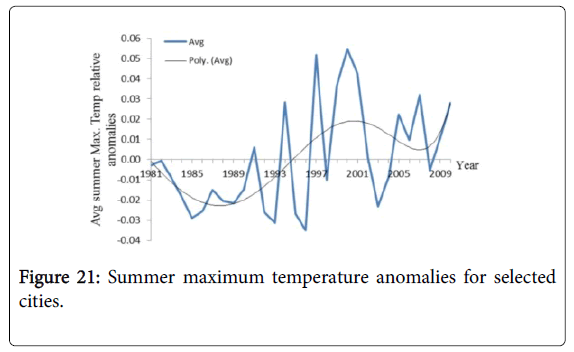
Figure 21: Summer maximum temperature anomalies for selected cities.
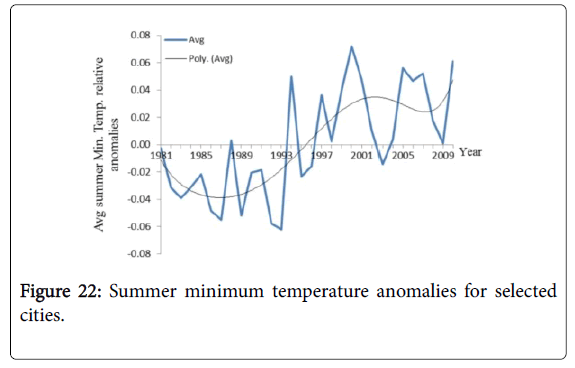
Figure 22: Summer minimum temperature anomalies for selected cities.
High temperature days and high temperature extremes
The Table 7 presents the trend of high temperature days and high temperature extreme days over desert areas during summer. The number of high temperature days, with exception of DaQaidam is increasing for all the stations (MKz=0.151 to 0.492) as well as the days having high temperature extremes (MKz=0.159 to 0.493). The highest temperature for Da-Qaidam was below 35°C and thus has the smallest rate of high temperature extremes.
| Area | High Temp. Days | High Temp. Extremes |
|---|---|---|
| AlzaZuoqi | 0.250 | 0.493 |
| Bayn MOD | 0.338 | 0.440 |
| Da-Qaidam | N/A | 0.159 |
| Guaizhu | 0.464 | 0.426 |
| Hami | 0.492 | 0.445 |
| Hoboksar | 0.151 | 0.308 |
| Linhe | 0.189 | 0.328 |
| Qiemo | 0.363 | 0.300 |
| Ruoqiang | 0.509 | 0.339 |
| Turpan | 0.386 | 0.353 |
| Average | 0.349 | 0.326 |
Table 7: Trend of high temperature days and high temperature extremes for desert areas.
The Table 8 shows the trend of high temperature days and high temperature extremes for selected cities. Like for the desert areas (Table 7), both the number of high temperature days is increasing for all the cities (MKz=0.140 to 0.511) and the number of days with high temperature extremes (MKz=0.105 to 0.442).
| Area | High Temp.Days | High Temp.Extremes |
|---|---|---|
| Beijing | 0.283 | 0.343 |
| Changchun | 0.314 | 0.138 |
| Dalian | 0.179 | 0.105 |
| Datong | 0.505 | 0.321 |
| Harbin | 0.269 | 0.307 |
| Hohhot | 0.289 | 0.303 |
| Shenyang | 0.14 | 0.02 |
| Taiyuan | 0.511 | 0.442 |
| Tangshan | 0.242 | 0.307 |
| Tianjin | 0.252 | 0.327 |
| Average | 0.298 | 0.261 |
Table 8: Trend of high temperature days and high temperature extremes for cities.
Frost days and low temperature extremes
The Table 9 shows the trend of frost days and days for low temperature extreme over spring for desert areas. We find both the frost days (MKz=-0.414 to -0.128) and the number of days with extreme low temperatures (MKz=-0.446 to -0.010) decreasing with a positive correlation of 0.614. This decreasing trend means that few and fewer days have minimum temperature below zero degrees Celsius (0°C). The Table 10 shows the trend of frost days and days for low temperature extreme over spring for cities.
| Area | Frost Days | Low Temp.Extremes |
|---|---|---|
| AlzaZuoqi | -0.335 | -0.209 |
| Bayan MOD | -0.128 | -0.01 |
| Da-Qaidam | -0.355 | -0.05 |
| Guaizhu | -0.375 | -0.222 |
| Hami | -0.215 | -0.107 |
| Hoboksar | -0.379 | -0.094 |
| Linhe | -0.383 | -0.446 |
| Qiemo | -0.155 | -0.054 |
| Ruoqiang | -0.414 | -0.242 |
| Turpan | -0.339 | -0.125 |
| Average | 0.308 | 0.156 |
Table 9: Trend of frost days and low temperature extremes for desert areas.
| Area | Frost Days | Low Temp.Extremes |
|---|---|---|
| Beijing | -0.125 | -0.304 |
| Changchun | -0.133 | -0.381 |
| Dalian | -0.231 | -0.148 |
| Datong | -0.334 | -0.311 |
| Harbin | -0.272 | -0.442 |
| Hohhot | -0.324 | -0.29 |
| Shenyang | 0.021 | 0.319 |
| Taiyuan | -0.362 | -0.389 |
| Tangshan | -0.272 | -0.184 |
| Tianjin | -0.08 | 0.01 |
| Average | -0.237 | -0.308 |
Table 10: Trend of frost days and low temperature extremes for cities.
Like deserts, the cities show a decreasing trend of both frost days (MKz=-0.362 to -0.080) and the number of days having extreme low temperature (MKz=-0.442 to -0.148) with a positive correlation of 0.730. The decreasing trend means that few and fewer days have Tmin below zero degrees Celsius (0°C.) and it also explains the increase of spring Tmin. We find a greater decrease of frost days for desert greater than the rate for the cities which probably indicates that spring night are becoming warmer for deserts at a faster rate compared to cities.
In the present study, we investigated the variability of temperature over desert and cities of Northern China for the period 1981-2010. We found DTR decreasing for both desert and cities. It is evident that the DTR for cities is decreasing faster than the desert’s. The Tmax is increasing for both desert and cities and that Tmax for the deserts is increasing faster than that for the cities. The Tmin is increasing as well for both deserts and cities and the rate of increase of Tmin for the desert greater than the one for cities.
We also find both the deserts and cities exhibiting an increasing trend of high temperature days and high temperature extremes. The rate of increase of high temperature extremes over deserts is slightly higher than the one over cities. In general, the summer Tmax for all the areas show increasing trend. The frost days and low temperature extremes over both the deserts and cities are decreasing. The frost days over deserts decrease slightly higher than over cities and in general, the spring Tmin for all the stations is increasing explaining the decreasing trend of the frost days and low temperature extremes.
The authors thank the Collaborative Innovation Center on Forecast and Evaluation of Meteorological Disasters, Nanjing University of Information Science and Technology, China Meteorological Administration (CCSF201318) for the funding that has supported the study. The authors also acknowledge expert opinion from reviewers in quest of improving our manuscript.
