Research Article - (2014) Volume 2, Issue 2
Keywords: Crop diversification; Cropping pattern; Technology; Agro-infrastructure; Agro-climatic conditions; Assam agriculture
Issues related to crop diversification have been discussed by the agricultural economists for a long period of time and researchers have been trying to relate diversification to the development prospects and various factors responsible for it [1,2]. Studies also described methods of diversification of land use and other resources for a sustainable agricultural growth and rural livelihood [3-6]. Generally, crop diversification means the changes in combination of crops cultivated in an area and measured by the proportion of area under various crops. Specifically, it refers to the species diversification of cultivated crops by the farmers considering their likely risk and returns leading to a production portfolio that minimizes risk and increases income [4,7]. It may also be defined as the diversification of varieties and ecotypes of the same variety to maximize outputs of primary products as well as value-added processed products to enable farmers to enhance their incomes [8]. Practice of increasing number of crops or crop varieties also indicates crop diversification, which may be due to potential farm-level response to climatic variability and change [9].
In subsistence farming system, diversification provides an alternative means of livelihood for smallholder farmers, the majority of whom are vulnerable to climate change. At the individual farm level, crop diversification acts to reduce susceptibility to climatic variability such as floods or drought that might result in crop failure. At the same time, it increases the number of marketable activities such as adding livestock to a cash crop operation or undertaking value-added processing and hence serves to reduce farmers’ risks resulting from weather fluctuations.
Experiences across regions of India reveal that because of changing rainfall patterns and depletion of water resources, the existing cropping pattern is becoming less productive [10-12]. Thus intensification of crops through mixed cropping and integration of high-value crops such as horticultural production is gaining prominence as a climate change adaptation strategy, especially in the hill regions as well as for future growth of agriculture [13-15].
In general, level of diversification is governed by the market forces (relative price, profitability of crops), advancement of technology (access to inputs and implements), agro-climatic condition, development of infrastructure (communication, marketing and storage facility) and institutional factors like government’s policy, protection and risk factor [16-21].
Across the Indian states, there has been a tendency of crop diversification towards either high value non-food crops or plantation and horticultural crops and that got momentum with the arrival of Green Revolution technology [22-24]. Declining trends in yield of food grains during 1960-61 to 1982-83 has also been a reason for the shift of area from food to non-food crops [25]. However, Tyagi [26] and Geetha [27] extended their view to soil and climatic factors like optimum rainfall conditions, temperature, wind, sunshine, soil moisture, etc. for the cropping pattern choice conditioning healthy growth of crop yields and net farm income.
Using alternative dummy variable methods Rahman [28], Fetien et al. [29], Wondimagegn et al. [30], Rehima et al. [31] used various demographic characteristics, farm size, weather variables like rainfall and temperature, alternative income and asset holding, irrigation facilities, rent, experience and attitude of farmers, infrastructure and technology are found to be significant for changing crop diversification.
Assam is largely an agrarian state in North East India having varied physical resources, agro-climatic endowments and substantial agricultural diversity. Due to its diverse agro-climatic and geo-morphological conditions (presence of both hills and plains, hot and humid as well as cold and varied rainfall zones) varieties of food, non-food as well as several horticultural crops have been produced by the farmers depending upon the availability of labour, water, drainage, technological inputs and infrastructure.
Although agriculture continues to be a major sector in Assam, its contribution to Gross State Domestic Product (GSDP) continued to decline from 57.24% in 1970-71 to 22.85% in 2007-08 (GoA, 2008-09). The state is yet to record significant expansion of modern technology in agriculture. Only 35.8 % of area under paddy (the major agricultural crop) was under high yielding varieties (HYV) seeds and 17.56% of gross cropped area (GCA) was covered by irrigation facilities during 2006-07. Per hectare consumption of fertilizer in Assam was only 58.6 kg (GoA, 2008-09). Very limited studies are conducted on crop diversity in Assam and that reflects limited changes in crop diversity. Here, cultivation of summer rice recorded faster growth than autumn and winter rice in the flood-affected areas. Here flood risk also has a significant influence on the allocation of area under different seasonal varieties of paddy. The higher the flood risk more is the seasonal diversification of paddy in Assam [32,33].
Thus, only a few studies on cropping pattern choice by farmers relate it to the changing technology, climatic conditions and agro-infrastructures together at the international level but none in Assam. Along with price and profitability; climatic factors may force the farmers to adopt suitable crops in order to reduce risk, where technological and infrastructure conditions support them to go for such changes and thus create conditions for cropping pattern changes.
This paper examined the spatio-temporal pattern of crop diversification in Assam. Also, the impacts of modern inputs (irrigation, chemical fertiliser) and climatic conditions (mainly rainfall and temperature) on crop diversification across the districts of Assam are examined.
The analysis is made on the basis of secondary data on area, modern technical inputs like consumption of fertilizer, irrigation; structure of land holding, climatic factors like rainfall, humidity, temperature collected from various issues of Statistical Hand Book of Assam, Economic Survey, Regional Meteorological Centre, Guwahati; Reports of Directorate of Economics and Statistics and Directorate of Agriculture, government of Assam.
Quinquennial moving (five year) average of area and proportion of area under each crop to GCA have been calculated for the periods 1951-56 to 2006-11. Thereafter, elasticity of each crop with respect to GCA in the state is computed to understand whether the increase or decrease of area under a crop has been due to expansion of GCA or due to substitution of area under other crops. This is defined as the ratio of percentage change in area under a particular crop and percentage change in GCA. If the elasticity is greater than unity then we can conclude that the growth of the particular crop has been due to both the expansion of GCA i.e., area under cultivation in the season of cultivation of such crop and partly due to the substitution of area under other crop in that season. Similarly, the negative elasticity is an indication of inverse relationship between the growths of area under cultivation of a crop to that of GCA. However, if the value of elasticity is positive but less than one, it would reflect the change in area of the concerned crop either due to expansion of GCA or substitution of other crops. Even, one effect may be negative and the other may be positive and the net result would be in the positive direction.
Then the concentration of each crop in a region/district with respect to that of state as a whole is examined through the changes in Locational Quotient (LQ) of each crop in the respective region/district. That means LQ measures the degree to which a specific unit region contains more or less than in share of crop acreage in the whole state or country, indicating a ratio of ratios. It is defined as:  where, Aij represents area under ith crop in jth district, Aj is gross cropped area in jth district.
  is gross cropped area in the state (sum of GCA of all districts).Apart from the proportional distribution of GCA, various indices are commonly used to measure the degree of diversification. These are Herfindahl Index (HI), Simpson Index (SI), Ogive Index (OI), Entropy Index (EI), Modified Entropy Index (MEI) and Composite Entropy Index (CEI) etc. HI is the sum of squares of acreage proportion of each crop in the gross cropped area and can be written as:
  . Here, n is the number of crops grown and Pi represents proportion of area under ith crop to gross cropped area (GCA). The value of HI lies between zero (for perfect diversification) and one (for perfect specialization). A higher value of HI implies less diversification. Hence, it is subtracted from one to get the index of diversification (De and Chattopadhyay, 2010). OI is also based on the proportion of area under crops, while EI is defined as
  Log (1/Pi). EI also increases with the increase in diversification and it approaches zero when there is perfect concentration, i.e. when Pi equals one. The upper bound of the index is log N and depends on the number of crops cultivated as well as the choice of base of logarithm. In the MEI number of crops is chosen as the base, which would change over time and thus gives more appropriate result. But, the number of major crops in Assam remains same over time excepting the proportions in GCA. Along with that the simplicity in computation prompted us to choose HI here.
Thereafter, tabular as well as regression method has been used to examine the impact of various technological and climatic factors on the variation in area under major crops and diversification index across the districts of Assam. As HI (constituted of proportion of area under all major crops) is regressed on various explanatory variables, price of any particular crop could not be used, though changes in price of a crop through variation in its profitability lead to expansion or contraction of area under it. Similarly, despite having some idea on the possible impact of CO2 emission (an important component of climate change) on the productivity of agriculture, it is not included here due to the paucity of information [34,35]. Moreover, as global warming is partly caused by the emission of CO2 (a Greenhouse Gas) inclusion of temperature can partly take care of it. Here, both the average maximum temperature and rainfall of respective Kharif (May to September) and Rabi (October to April) season have been included in the regression. Both Random Effect GLS Robust Regression and Fixed Effect Model (FEM) is used to compare the effects of various factors on diversification. As the value of index is limited to the range of 0 and 1 the robust method is assumed to provide better result. At first, the equation has been considered is Yit = at + ∑bij Xitj + €it . Where Yit represents the value of dependent variable (HI) of ith zone at time t, Xitj represents value of jth explanatory variables of region i at time t. €it is the value of random disturbance term of zone i at time t and bij is the effect of jth explanatory variable in zone i. The period t =1 for 1971-76 and = 2 for 2005-10. These two periods are chosen for the regression purposes depending upon the availability of data on technological variables like irrigation and chemical fertiliser use. Though the variables used are not exhaustive, comparison of two alternative models provides a substantial explanation of the changes in HI. The specification error is tested by Hausman Test and found to be insignificant (P-value = .66) in case of Random Effect GLS Robust Regression.
A part of €it (=αi) depends on the variation in zonal characteristics (unit) and that remains more or less same over time in Assam; while the other part is purely random. As the inter-zonal variation remained more or less same over time the FEM is considered to be suitable and used to know the impact of inter-zonal variation (ηit) on the observed variation in diversity. One time specific dummy variable, γ is introduced that takes value 0 for the first period and 1 for the second period for all units. The FEM model considered for estimation is Yit = γt + ∑bij Xitj + αi + ηit... (2). Here αi represents zone specific fixed effects and related to inter-zonal variations in weather factors. For the state as a whole, a separate regression is also conducted to examine the temporal impact of climate related variables.
Stability of coefficients is also examined by Chow Test [36]. For this purpose one dummy variable is introduced that takes value 0 for the first period for all units and 1 for the second period for all units, which is then multiplied by the respective variables to compute DIrrigation, DChem. Fert, DRain (Kharif), DRain (Rabi), DMaxTemp (Kharif) and DMaxTemp (rabi). The significance of coefficients of those variables is examined to check stability.
At present Assam constitutes of 27 districts. But, information related to various aspects of agriculture is not available for all these districts throughout the period as many of those were created at different times by dividing some of the former districts. Thus, for the purpose of analysis, data has been compiled from the available information on all current districts to the erstwhile undivided 10 districts existing in 1971 and shown in the geographical map of Assam.
Changes in agro-climatic condition of Assam
Assam is well known for its diverse sub-Himalayan agro-climatic conditions which is suitable for the growth of varieties of crops across the districts. The climatic conditions in the state also changed significantly over the years and that too some extent led to the variation in cultivation of crop but not observed to be in line with the growth process as expected from an agricultural economy for which has been known. Looking at the temporal variation in three major components of weather condition rainfall, relative humidity and temperature across different parts of Assam over a long period of time, changing climatic conditions has been observed. Here, zone-wise temporal variations in quinquennial average rainfall, minimum and maximum temperature of Kharif and Rabi season are shown in Figures 1a, 1b, 2a, 2b, 3a and 3b respectively.
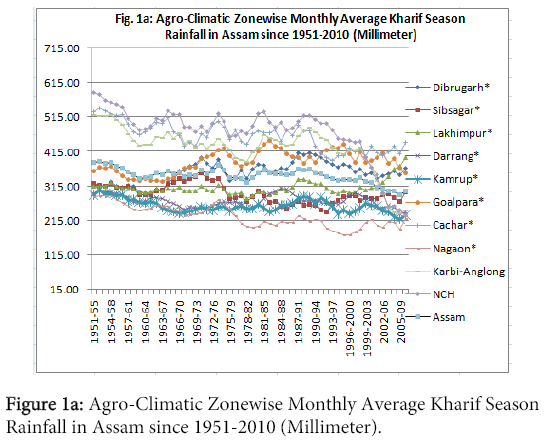
Figure 1a: Agro-Climatic Zonewise Monthly Average Kharif Season Rainfall in Assam since 1951-2010 (Millimeter).
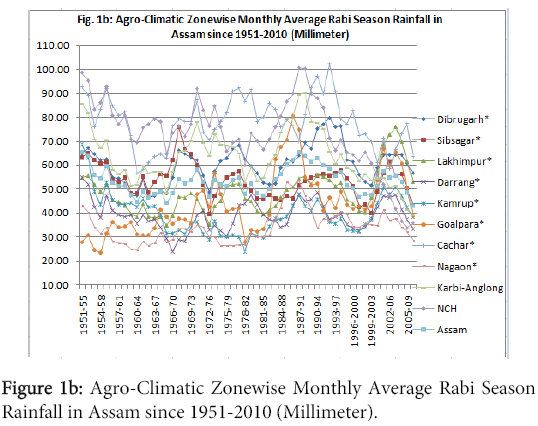
Figure 1b: Agro-Climatic Zonewise Monthly Average Rabi Season Rainfall in Assam since 1951-2010 (Millimeter).
Quinquennial average annual rainfall in Assam has been found to be more and more erratic and on an average declined from over 2576.3 mm during 1951-56 to 2358.5 mm in 1971-76 and further to 2040 mm during 2005-10 (IMD, Regional Meteorological Centre, Guwahati). Among the districts, Cachar area recorded highest average annual rainfall since 1951-56 but registered decreasing trend along with other zones except in Lakhimpur where monsoon rainfall increased over time. On the other hand, Nagaon area recorded the lowest annual rainfall among all the zones and that too declined over time.
Annual average rainfall in Cachar was about 3777.4 mm during 1951-56 and increased to 2833.6 mm during 2005-10, while in Nagaon it decreased drastically from around 1980.3 mm in 1951-56 to 1335.3 mm during 2005-10. In hilly Karbi Anglang and N.C. Hills however annual rainfall continuously declined from 3910.9 mm in 1951-56 to 1663.4 mm during 2005-10. Not only having inter-zonal skewed distribution of rainfall, month-wise variation in rainfall increased significantly in the high rainfall areas, while that of low rainfall area declined (IMD, Regional Meteorological Centre, Guwahati). In Lakhimpur, Dhemaji monsoon rainfall has increased continuously over the years during Kharif season and thus incidence of flood and its severity also increased that has more damaging impact on the late summer and autumn crops. In Karbi Anglong and N.C. Hills, rainfall over the years shows more erratic pattern and thus farmers avoided settled paddy cultivation even in low lying areas in order to avoid uncertainty and the diversity pattern shows people’s preference for more tea, horticulture and ericulture on the basis of wildly grown host plant, castor. Gradually, farmers in other areas also tried to switch over to the short period, more resistant crop varieties to reduce the risk of cultivation due to changing frequency, intensity and timing of occurrence of rain and flood emanated from the long term changes in climatic condition, which has been closely associated with the changing relative humidity and temperature variation across the months and regions over the years. Relative humidity has also been found to increase gradually in the rising rainfall areas and declined in the falling rainfall areas of Assam. The record of maximum and minimum temperature also shows that average level of maximum and minimum temperature has increased since 1970 across the places but it has associated with rising extremeness (maximum-minimum gap) especially in the high rainfall areas (Figures 2a, 2b, 3a and 3b).
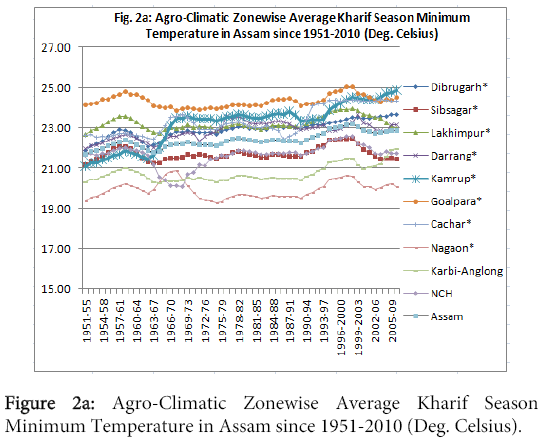
Figure 2a: Agro-Climatic Zonewise Average Kharif Season Minimum Temperature in Assam since 1951-2010 (Deg. Celsius).
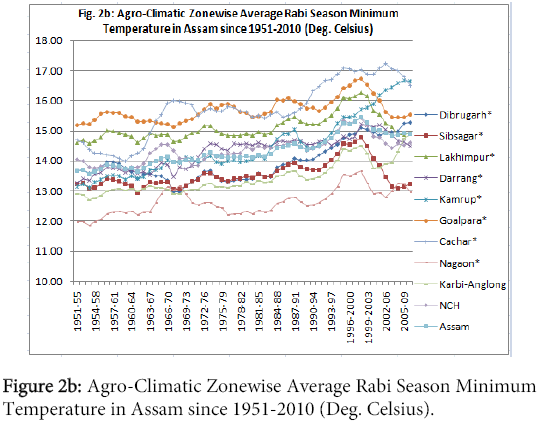
Figure 2b: Agro-Climatic Zonewise Average Rabi Season Minimum Temperature in Assam since 1951-2010 (Deg. Celsius).
Changing weather pattern may have impact on cropping pattern in the state by way of occurring sudden flood, drought, disease etc. that would compel farmers to shift their existing cropping pattern to reduce risk. Studies revealed that farmers’ adaptability to the changing climate and choice of suitable cropping pattern largely depends upon their awareness and skill to judge the expected situation, which is highly dependent on their educational level, availability of information, training; extension services by the outside agencies regarding climate change and development of agro-technology and agro-infrastructure [37,38]. But, most of those studies suffer from the limitations of inadequate information and superficial analysis.
Use of modern technology
In Assam, use of modern technological inputs and implements recorded a very slow pace despite the fact that application of technology, agro-infrastructure and material inputs are the important governing factors for the choice of agricultural production activities and its sustainable progress. Though majority of the people are engaged in agriculture and there is huge scope of utilization of Himalayan river water flows through the state, very little of the available water resources has been used for the agricultural purposes directly or indirectly through the generation of hydropower that could be used in lifting water and running other agricultural implements. As there is a lack of growth in use of irrigation water, there is also a lack of progress in utilization of chemical fertilizers which has very strong complementarities with the effectiveness of water for the diversification of agricultural activities.
Data on irrigation expansion and application of chemical fertilizer has been available only from 1976-77 and 1983-84. There is also very limited information on other modern technological inputs (HYV seeds, use of plan protective chemicals, fungicides, complementary food for enhancing yield etc) and implements like Diesel or electric pump sets, tractor, power tiller, thresher, sprayer etc). Thus here only the growth of use of irrigation potential and chemical fertilizer has been described and compared for the possible explanation of poor diversification of crop in the state and inter-district variation.
Merely 11 per cent of the gross cropped area was under irrigation during 1976-77 and increased to only 18 per cent during 2006-07, which has been much lower as compared to all India average and available Himalayan River streams carrying huge water resources and potential groundwater sources (Table 1). Proportion of GCA under irrigation ranged from 2.42 per cent in Dibrugarh region to 25.37 per cent in N. C. Hills in 1976-77. The variation reached from 4.67 per cent in Cachar Barrack Valley zone to 34.41 per cent in Nagaon area. Relatively better progress is observed in Karbi Anglong, Dibrugarh and Nagaon region. On the other hand, very slow progress is recorded in Goalpara and Kamrup, while the situation in Cachar became worse in terms of progress. Over the years, Nagaon*, Darrang*, N.C. Hills* and Karbi Anglong* regions recorded relatively faster crop diversification in terms of HI, but not necessarily in favour of high value crops, rather towards some inferior food crops and some winter crops, horticultural crops for the survival of the farmers, who are mostly small and marginal. That has however been backed by the relatively faster growth of irrigation as compared to the other districts. Thus whatever slow progress in crop diversification has been observed, its variation across the regions has been hardly due to the spatial variation in growth of irrigation potential.
| District/Year | 1976-77 | 1979-80 | 2001-02 | 2004-05 | 2006-07 |
|---|---|---|---|---|---|
| Cachar* | 5.28 (7) | 6.66 (8) | 4.78 (10) | 4.41 (10) | 4.67 (10) |
| Darrang* | 22.07 (2) | 16.65 (3) | 24.43 (1) | 25.92 (2) | 30.07 (2) |
| Goalpara* | 9.67 (5) | 10.54 (5) | 10.28 (7) | 11.29 (7) | 11.20 (8) |
| Kamrup* | 10.41 (4) | 12.71 (4) | 16.07 (4) | 18.93 (4) | 20.34 (5) |
| Lakhimpur* | 1.06 (10) | 3.41 (10) | 6.91 (9) | 6.85 (9) | 6.65 (9) |
| Dibrugarh* | 2.42 (9) | 4.34 (9) | 9.44 (8) | 10.21 (8) | 12.19 (7) |
| Nagaon* | 12.87 (3) | 17.13 (2) | 23.84 (2) | 28.26 (1) | 34.41 (1) |
| Sibsagar* | 9.17 (6) | 9.49 (6) | 12.67 (6) | 13.95 (6) | 15.40 (6) |
| Karbi Anglong* | 5.21 (8) | 8.09 (7) | 14.34 (5) | 15.98 (5) | 21.57 (4) |
| N.C. Hills* | 25.37 (1) | 19.00 (1) | 21.63 (3) | 22.04 (3) | 28.34 (3) |
| ASSAM | 10.48 | 11.33 | 14.95 | 16.56 | 18.21 |
Table 1: Growth of irrigation intensity across the districts of Assam since 1976-77 (Percentage of GCA under irrigation in any form).
Use of chemical fertilizers progressed relatively faster than irrigation in Assam (Table 2). It was merely 5.37 kg per hectare in 1983-84 and increased significantly to 67.87 kg per hectare in 2006-07. Yet it is much lower than all India average. Not only that, regional pattern of fertilizer use is highly skewed and its growth has been highly irregular. Though irrigation expansion has been relatively more intensive in N. C. Hills region, consumption of fertilizer and its growth has been at very low level. However, this district recorded high level of diversity in terms of index, which indicates a diversification towards low fertilizer intensive inferior crops. It may be owing to risk aversion, scarcity of resource and peculiar hill texture that is not suitable for modern day profitable agricultural crops and not supported by the required growth of mechanical devices. Horticulture, inferior winter and other food crops as well as ericulture has been practiced in N.C. Hills* and Karbi Anglong* regions.
| District/Year | 1983-84 | 1987-88 | 2000-01 | 2003-04 | 2006-07 |
|---|---|---|---|---|---|
| Cachar* | 10.12 (2) | 10.22 (2) | 28.72 (6) | 40.75 (6) | 59.06 (5) |
| Darrang* | 3.99 (5) | 7.24 (3) | 30.75 (5) | 51.91 (5) | 46.68 (6) |
| Goalpara* | 1.68 (9) | 6.51 (5) | 47.95 (4) | 87.89 (1) | 104.58 (2) |
| Kamrup * | 2.62 (6) | 5.69 (6) | 48.64 (3) | 61.62 (4) | 78.16 (3) |
| Lakhimpur* | 1.74 (8) | 2.91 (9) | 5.08 (9) | 7.76 (8) | 9.18 (8) |
| Dibrugarh* | 13.94 (1) | 4.50 (7) | 67.62 (2) | 70.51 (3) | 76.54 (4) |
| Nagaon* | 8.36 (4) | 6.76 (4) | 66.42 (1) | 72.96 (2) | 126.19 (1) |
| Sibsagar* | 9.59 (3) | 13.46 (1) | 21.80 (7) | 39.81 (7) | 39.67 (7) |
| Karbi Anglong* | 0.97 (10) | 2.00 (10) | 5.20 (8) | 4.66 (9) | 8.60 (9) |
| N.C. Hills* | 1.86 (7) | 3.14 (8) | 1.85 (10) | 1.79 (10) | 3.40 (10) |
| ASSAM | 5.37 | 6.87 | 39.73 | 55.63 | 67.87 |
Table 2: Growth of Intensity of Consumption of Chemical Fertilizer (NPK) Across the Districts of Assam since 1983-84 (Kg/per hectare).
Only in Dibrugarh, Goalpara, Nagaon and Kamrup where irrigation progress has been relatively faster, growth in per hectare fertilizer consumption has also been relatively faster. These districts showed remarkable progress in terms of growth in consumption of fertiliser and also recorded rapid diversification in terms of HI except Dibrugarh where expansion of area has taken place more in favour of tea and other horticultural crops.
Changes in cropping pattern in Assam
Change in cropping pattern from the production of less productive crops to more productive varieties is an essential strategy that can increase income from agriculture, minimize risks due to crop failures and make earning sustainable. Initiative at individual farm level to diversify farm enterprises is associated with cash needs of agriculture, combat risk, technological changes and deliberate government policies that accelerate diversification.
Due to rich geographical and agro-climatic diversity, various types of crops are grown in the state of Assam (Table 3). Here Paddy, Jute, Mustard, Sugarcane, Pulses and Tea are the major crops. While Tobacco, Wheat, Maize, Potato, Vegetables and Fruits, Banana, Papaya, Oranges, Coconut, Betel-nut, Pineapple, etc are also grown in the state as subsidiary crops. Excluding tea, Assam is basically a food grain producing state that occupies about three-fourth of the gross cropped area (Table 3). Food crops including both cereals and pulses, constituted 78.2 per cent of GCA of the state in 1951-56 and that increased marginally to 80 per cent in 1971-76. Thereafter, it decreased slowly to 74.13 per cent in the year 2006-11. Though paddy is the single most important crop, the cash crop jute is grown on the low lying areas on the bank of Brahmaputra and tea, the most important cash crop of Assam is grown on large scale in the upland areas. There is a significant decline in allocation of land towards winter rice continuously since 1951-56 and also of autumn rice since 1991. On the other hand, cultivation of summer rice recorded accelerated growth especially during last two decades and now occupies about 10 per cent of GCA of the state.
| Crop/Crop Groups | 1951-56 | 1961-66 | 1971-76 | 1981-86 | 1991-96 | 2001-06 | 2006-11 |
|---|---|---|---|---|---|---|---|
| Autumn Rice | 16.47 | 18.77 | 19.96 | 17.77 | 17.33 | 12.45 | 10.23 |
| Winter Rice | 57.52 | 55.03 | 52.31 | 48.27 | 47.63 | 47.66 | 47.79 |
| Summer Rice | 0.30 | 0.49 | 1.26 | 1.17 | 3.76 | 8.89 | 10.41 |
| Total Rice | 74.29 | 74.29 | 73.53 | 67.22 | 68.72 | 69.00 | 68.43 |
| Maize | 0.18 | 0.33 | 0.51 | 0.57 | 0.51 | 0.54 | 0.55 |
| Wheat | 0.11 | 0.17 | 1.77 | 3.14 | 2.16 | 1.80 | 1.68 |
| Other cereals& Millets | 0.18 | 0.20 | 0.64 | 0.34 | 0.28 | 0.23 | 0.19 |
| Cereals (Excluding Rice) | 0.47 | 0.70 | 2.92 | 4.05 | 2.95 | 2.57 | 2.42 |
| Total Cereals | 74.75 | 74.98 | 76.45 | 71.27 | 71.67 | 71.57 | 70.85 |
| Gram | 0.14 | 0.08 | 0.16 | 0.11 | 0.08 | 0.06 | 0.05 |
| Tur (Arhar) | 0.16 | 0.11 | 0.20 | 0.26 | 0.17 | 0.19 | 0.18 |
| Other Rabi Pulses | 3.15 | 3.23 | 3.04 | 3.37 | 2.74 | 2.81 | 3.04 |
| Pulses | 3.45 | 3.42 | 3.40 | 3.74 | 3.00 | 3.07 | 3.28 |
| Total Food Grains | 78.2 | 78.4 | 79.85 | 75.02 | 74.66 | 74.64 | 74.13 |
| Jute | 5.60 | 5.45 | 4.38 | 3.29 | 2.45 | 1.75 | 1.78 |
| Mesta | 0.06 | 0.40 | 0.42 | 0.36 | 0.17 | 0.14 | 0.14 |
| Cotton | 0.19 | 0.29 | 0.14 | 0.11 | 0.05 | 0.04 | 0.05 |
| Fibres | 5.85 | 6.14 | 4.93 | 3.76 | 2.67 | 1.93 | 1.96 |
| Rape & Mustard | 5.36 | 5.18 | 5.18 | 7.96 | 7.81 | 6.96 | 6.83 |
| Sesamum | 0.27 | 0.39 | 0.42 | 0.40 | 0.41 | 0.39 | 0.35 |
| Castor seed | 0.08 | 0.10 | 0.07 | 0.06 | 0.05 | 0.04 | 0.03 |
| Linseed | 0.06 | 0.04 | 0.08 | 0.22 | 0.24 | 0.26 | 0.21 |
| Oil Seeds | 5.78 | 5.70 | 5.76 | 8.65 | 8.51 | 7.66 | 7.43 |
| Potato | 0.91 | 0.99 | 0.92 | 1.32 | 1.83 | 2.12 | 2.24 |
| Tea | 7.55 | 6.92 | 6.56 | 6.21 | 6.32 | 7.57 | 8.01 |
| Sugarcane | 1.19 | 1.19 | 1.33 | 1.43 | 1.01 | 0.69 | 0.77 |
| Coconut | NA | NA | NA | 0.21 | 0.45 | 0.56 | 0.54 |
| Areca nut | NA | NA | NA | 1.45 | 1.94 | 2.01 | 1.92 |
| Tobacco | 0.41 | 0.41 | 0.26 | 0.15 | 0.05 | 0.02 | 0.02 |
| Plantation Crops | 9.14 | 8.52 | 8.15 | 9.45 | 9.77 | 10.86 | 11.26 |
| Sweet Potato | NA | NA | NA | 0.27 | 0.25 | 0.22 | 0.21 |
| Banana | NA | NA | NA | 0.81 | 1.11 | 1.19 | 1.27 |
| Tapioca | NA | NA | NA | 0.05 | 0.06 | 0.08 | 0.09 |
| Pineapple | NA | NA | NA | NA | 0.36 | 0.36 | 0.38 |
| Horticultural Crops | NA | NA | NA | 1.13 | 1.78 | 1.85 | 1.95 |
| Chillies | 0.12 | 0.25 | 0.39 | 0.30 | 0.36 | 0.41 | 0.47 |
| Onion | NA | NA | NA | 0.13 | 0.18 | 0.20 | 0.19 |
| Turmeric | NA | NA | NA | 0.24 | 0.24 | 0.33 | 0.37 |
| Others Total | 0.12 | 0.25 | 0.39 | 0.67 | 0.78 | 0.94 | 1.03 |
| Total Non-Food Grains | 21.80 | 21.60 | 20.15 | 24.98 | 25.34 | 25.36 | 25.87 |
| GCA (Hec.) | 1973559 | 2221439 | 2647354 | 3254463 | 3440098 | 3325427 | 1875844 |
Table 3: Quinquennial Average Proportion of Area under Principal Crops to GCA in Assam: 1951-56 to 2006-11 (Percentage).
As far as cereal cultivation is concerned, percentage of GCA under wheat, maize and other inferior cereals has increased over the years. This is an indication of diversification towards inferior crops and that happens only when there is a lack of basic input like irrigation and other inputs like HYV seeds, chemical fertiliser as well as technological support. People in the region, particularly the large number of small farmers cannot afford costly investments, especially in winter like various rabi pulses, potato unless there is secured irrigation facility and thus uncertainty in output and profit. Though cultivation of potato and mustard has increased, it is very slow and at present only 2.24 and 6.83 per cent of GCA is used for the cultivation of potato and mustard respectively. Overall, proportion of area under rabi pulses to GCA remains more or less stagnant. The indication is that much of the cultivable area in Assam was uncultivated in the off-monsoon season. With the expansion of area under cultivation in the off-monsoon season, except pulses, cultivation of most of the winter crops has increased very slowly and not at the cost of area under other crops. It also indicates very slow growth of multiple cropping across the seasons of the year.
Whether the growth whatever has been observed in terms of area allocation towards various crops has been due to the expansion of total area under cultivation or owing to the substitution of other crops has been examined through the elasticity of changes in area under various crops with respect to the changes in gross cropped area (GCA) for a particular period.
It is interesting to note that the GCA in Assam had increased from 211.90 thousand hectares in 1951-56 to 375.30 thousand hectares in 1996-2001 and that was mainly due to the expansion of net area under cultivation i.e., Net Sown Area (NSA). Many uncultivated lands were brought under cultivation during that period and even some forest land was converted into the agricultural fields. Very small area has been brought under multiple cropping in off-monsoon seasons as irrigation expansion has been very limited despite having so many rivers in this sub-Himalayan state. The wave of Green Revolution technology has reached in most of the backward and tribal dominated areas. After 2001 GCA has even declined and reached 351.40 thousand hectares during 2006-11, which happened mainly due to fall in NSA in some areas like Sibsagar and Karbi-Anglang, and due to reduction in area sown more than ones.
Figure 4 shows that Net Sown Area has not increased much in Assam after 1980, rather it has declined in the district of Sibsagar and marginally in Goalpara. Moreover, area cultivated more than once in a year has declined in Kamrup since 1980 and significantly in Nagaon, Dibrugarh, Darrang after 2000 and also marginally in Karbi Anglong. It is revealed from the trend of GCA as shown in Figure 5. It shows the stagnation of agriculture in Assam despite rising requirement of agricultural products for the growing population in the state, which is not even over-compensated by the industrial progress. Nevertheless, increase in cropping intensity has been observed only in limited available land, net area cultivated also increased at the cost of forest and other fallow or less productive hilly terrains. In Assam there is a lack in approach towards agricultural activities despite having economic crisis at the household level in rural areas.
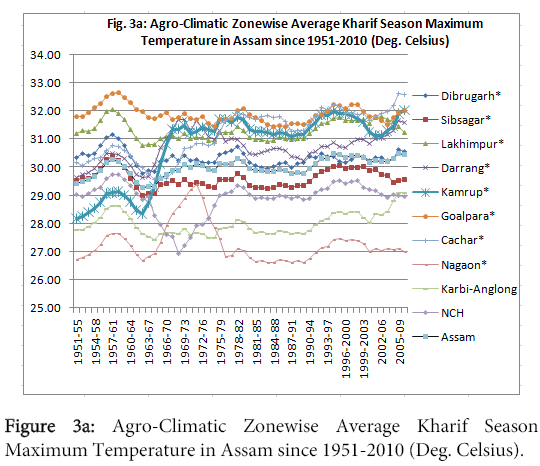
Figure 3a: Agro-Climatic Zonewise Average Kharif Season Maximum Temperature in Assam since 1951-2010 (Deg. Celsius).
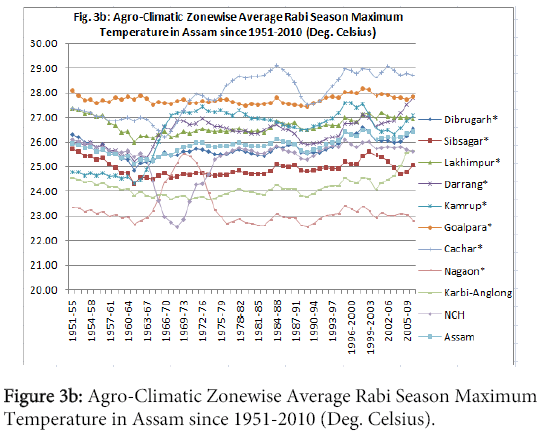
Figure 3b: Agro-Climatic Zonewise Average Rabi Season Maximum Temperature in Assam since 1951-2010 (Deg. Celsius).
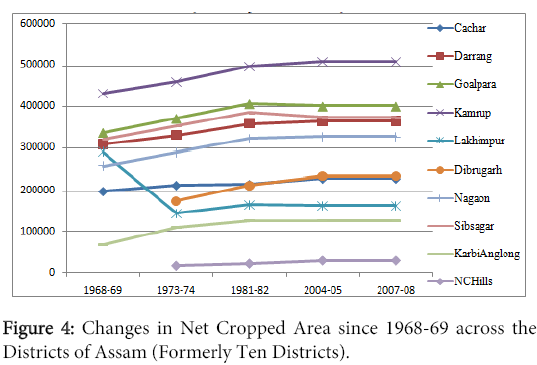
Figure 4: Changes in Net Cropped Area since 1968-69 across the Districts of Assam (Formerly Ten Districts).
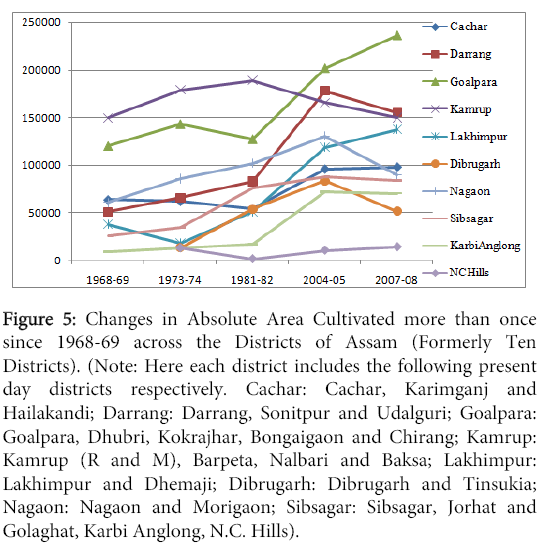
Figure 5: Changes in Absolute Area Cultivated more than once since 1968-69 across the Districts of Assam (Formerly Ten Districts). (Note: Here each district includes the following present day districts respectively. Cachar: Cachar, Karimganj and Hailakandi; Darrang: Darrang, Sonitpur and Udalguri; Goalpara: Goalpara, Dhubri, Kokrajhar, Bongaigaon and Chirang; Kamrup: Kamrup (R and M), Barpeta, Nalbari and Baksa; Lakhimpur: Lakhimpur and Dhemaji; Dibrugarh: Dibrugarh and Tinsukia; Nagaon: Nagaon and Morigaon; Sibsagar: Sibsagar, Jorhat and Golaghat, Karbi Anglong, N.C. Hills).
Lack of progress in irrigation, chemical fertiliser and implements may be the principal reasons for the decline in NSA and cropping intensity. Another reason can be cited here is that there has been significant growth of area under tea, (the most important commercial crop of Assam but not practised in all the districts) across the districts of Assam (due to its more relative profitability) especially in Sibsagar, Dibrugarh where it grew much faster and at the cost of some other crops. Also, a part of the cultivable land has been lost in recent years due to growth of new townships, and industries along with the declaration of some agricultural areas as reserved forest areas in the state in recent years. Frequent occurrence of floods also contributed to the decline in area under cultivation in the prime agricultural season.
Table 4 reveals that the elasticity of area under various crops or crop groups changed significantly over various sub-periods. Elasticity of area under overall food-grains has been positive and greater than one throughout except in the periods 1961-66 to 1971-76 and 1981-86 to 1991-96. Area under food-grain increased at higher rate than that of GCA during 1950s and 1970s. But after 1991-96 the positive value is actually an indication of decline in area, as both overall NSA and GCA have declined in the state as a whole. Only the value of elasticity in case of potato and tea along with plantation and horticultural crops has been more than one for most of the time, which is an indication of both substitution of some other crops and whatever expansion of GCA was recorded till 1999-2004, went in favour of these crops. Again the negative value of elasticity in post 1991 period has been due to the falling GCA and thus an indication of growth of the identified crop and the positive value during that period indicates the reverse one. Except minor plantation and horticultural crops, growth of inferior cereals and some inferior winter crops indicate the absence of irrigation and other technological progress in agriculture that compels the farmers to adopt such low value crops for getting whatever possible from their available land. That is another reason why the area under cultivation decreased. Thus, the overall crop diversification in Assam does not reflect much progressive agricultural scenario in the state.
| Crop/Crop Group | 1951-56 to 1961-66 | 1961-66 to 1971-76 | 1971-76 to 1981-86 | 1981-86 to 1991-96 | 1991-96 to 2001-06 | 2001-06 to 2006-11 | 1951-56 to 2006-11 |
|---|---|---|---|---|---|---|---|
| Autumn | 2.26 | 1.41 | 0.40 | 0.55 | 14.90 | 8.44 | 0.04 |
| Winter | 0.62 | 0.68 | 0.58 | 0.76 | 0.98 | 0.84 | 0.58 |
| Summer | 6.52 | 11.11 | 0.63 | 41.67 | -66.36 | -6.14 | 85.14 |
| Total Rice | 1.01 | 0.94 | 0.54 | 1.42 | 0.81 | 1.31 | 0.80 |
| Maize | 8.64 | 4.62 | 1.52 | -0.82 | -2.06 | 0.49 | 6.25 |
| Wheat | 5.72 | 62.08 | 5.19 | -4.83 | 9.02 | 4.00 | 36.93 |
| Other cereals & Millets | 2.02 | 15.52 | -1.52 | -2.59 | 9.82 | 7.28 | 1.22 |
| Cereals (Excluding Rice) | 5.43 | 21.62 | 3.07 | -4.09 | 7.18 | 3.55 | 11.59 |
| Total Cereals | 1.03 | 1.13 | 0.63 | 1.11 | 1.07 | 1.39 | 0.87 |
| Gram | -2.99 | 7.33 | -0.56 | -4.36 | 11.47 | 9.06 | -0.63 |
| Tur (Arhar) | -1.43 | 5.96 | 2.72 | -5.40 | -4.19 | 2.72 | 1.46 |
| Other Rabi Pulses | 1.24 | 0.63 | 1.58 | -2.45 | -0.31 | -2.35 | 0.92 |
| Pulses | 0.94 | 0.97 | 1.55 | -2.72 | -0.22 | -1.80 | 0.88 |
| Total Food-grains | 1.03 | 0.02 | 1.69 | 0.92 | 1.02 | 1.26 | 0.87 |
| Jute | 0.76 | -0.28 | -0.32 | -3.76 | 15.13 | 0.31 | -0.729 |
| Mesta | 52.21 | 1.32 | 0.26 | -8.93 | 8.42 | 1.26 | 4.50 |
| Cotton | 3.29 | -2.33 | -0.04 | -9.07 | 9.47 | -1.98 | -1.02 |
| Fibres | 1.38 | -0.27 | -0.26 | -4.41 | 14.61 | 0.33 | -0.68 |
| Rape & Mustard | 0.70 | 1.00 | 3.91 | 0.60 | 6.27 | 1.87 | 1.69 |
| Sesamum | 4.76 | 1.56 | 0.80 | 1.23 | 3.34 | 5.38 | 1.719 |
| Castor seed | 3.05 | -0.91 | 0.78 | -3.66 | 8.12 | 7.49 | -0.39 |
| Linseed | -2.06 | 8.36 | 9.25 | 3.25 | -2.14 | 8.53 | 7.28 |
| Oil Seeds | 0.89 | 1.06 | 3.72 | 0.66 | 5.90 | 2.30 | 1.72 |
| Potato | 1.83 | 0.52 | 3.38 | 8.07 | -7.01 | -1.15 | 4.68 |
| Tea | 0.26 | 0.67 | 0.71 | 1.34 | -8.70 | -1.41 | 1.15 |
| Sugarcane | 0.98 | 1.76 | 1.41 | -4.50 | 16.34 | -3.36 | 0.11 |
| Coconut | -- | -- | -- | 22.30 | -11.23 | 2.43 | 141.75 |
| Areca nut | -- | -- | -- | 7.37 | -0.83 | 3.04 | 29.76 |
| Tobacco | 1.00 | -1.39 | -1.30 | -11.12 | 26.79 | 13.90 | -1.42 |
| Plantation Crops | 0.38 | 0.72 | 1.85 | 1.64 | -4.48 | -0.47 | 1.58 |
| Sweet Potato | -- | -- | -- | -0.76 | 5.57 | 3.85 | -19.90 |
| Banana | -- | -- | -- | 7.97 | -2.20 | -1.80 | 51.17 |
| Tapioca | -- | -- | -- | 3.21 | -13.70 | -3.30 | 54.63 |
| Pineapple | -- | -- | -- | -- | 0.91 | -0.60 | 0.09 |
| Horticultural Crops | -- | -- | -- | -- | -0.89 | -0.95 | 63.87 |
| Chillies | 10.50 | 4.50 | -0.18 | 4.34 | -6.17 | -5.54 | 8.30 |
| Onion | -- | -- | -- | 8.41 | -3.60 | 2.49 | 43.08 |
| Turmeric | -- | -- | -- | 1.04 | -17.23 | -4.40 | 49.97 |
| Others Total | 10.50 | 4.50 | 5.00 | 3.96 | -8.98 | -3.42 | 20.09 |
| Total Non-Food-grains | 0.90 | 0.56 | 2.30 | 1.25 | 0.95 | 0.23 | 1.46 |
Table 4: Elasticity of area under various crops to GCA in Assam during different sub-periods.
As per the Locational shift measured by LQ, major winter paddy spread from Cachar, Lakhimpur and Sibsagar to additional Dibrugarh and Karbi Anglang districts. While concentration of summer paddy shifted from Cachar, Nagaon, Sibsagar to Goalpara, Kamrup, Nagaon region (Table 5). Concentration of inferior rabi pulses, oilseeds along with fruit crops like pineapple, banana, tapioca, and tobacco, tea, cotton, sugarcane and turmeric are observed in North Cachar Hills along with either Cachar, Kamrup or Karbi Anglang, Nagaon or Darrang, Lakhimpur and Goalpara. Rapid locational shift of crop concentration has been observed over the decades.
| SL | Crop | 1951-2 to 55-56 | 1961-2 to 65-66 | 1971-2 to 75-76 | 1981-2 to 85-86 | 1991-2 to 95-96 | 2001-2 to 05-06 | 2006-7 to 10-11 |
|---|---|---|---|---|---|---|---|---|
| 1 | Atumn Paddy (Rice) | G, K, KA | G, K, KA | Da, G, K, NC | Da, G, K, NC | Da, G, K, NC | Da, G, K, NC | Da, G, K, NC |
| 2 | Winter Paddy (Rice) | C, L, S | C, L, S | C, Di, N, S, KA | C, L, S, KA | C, L, Di, S, KA | C, L, Di, S, KA | C, L, Di, S, KA |
| 3 | Summer Paddy (Rice) | C, N, S | C, G, N | Da, N | C, G, N | C, L, Di, S, KA | G, K, L, N | G, K, N |
| 4 | Maize | Da, L, KA | Da, L, KA | Di, KA, NC | Di, KA, NC | Di, KA, NC | KA, NC | KA, NC |
| 5 | Wheat | G, K, N | G, K | G, K, N | Da, G, K, N | G, K, N | Da, G, K, N | Da, G, K, N |
| 6 | Other Cereal | G, K, L | G, K, L | Da, G, K | G, K, NC | G, K | G | G, K |
| 7 | Gram | K, N, KA | Da, G, K, N, KA | G, K, KA | Da, G, K, N, KA, NC | Da, G, K, KA | Da, G, K, KA | Da, G, N, KA |
| 8 | Tur (Arhar) | Da, G, K, KA | Da, G, K, KA | Da, K, KA | Da, N, KA, NC | N, KA, NC | G, N, KA, NC | G, N, KA, NC |
| 9 | Other Rabi Pulses | K, N | G, K, N | Da, K, N | Da, G, K, L, Di, N | G, K, N | Da, G, K, L, Dib, N | Da, G, K, NC |
| 10 | Rape & Mustard | Da, G, K, N | Da, G, K, N | Da, G, L, N, KA | Da, L, Di, N, KA, NC | Da, G, L, KA | Da, G, K, L, N, KA, NC | Da, G, L, KA, NC |
| 11 | Sesamum | Da, G, K, N, KA | Da, G, N | Da, G, N, KA, NC | G, K, N, KA, NC | G, K, KA, NC | G, K, KA, NC | Da, G, N, KA, NC |
| 12 | Linseed | C, K, N, KA | C, K, N, KA | K, NC | Da, K | G, K | G, K | Da,G, K, N |
| 13 | Castor | K, L, KA | K, L, KA | K, L, KA, NC | L, KA, NC | K, KA, NC | L, KA, NC | L, KA, NC |
| 14 | Jute | G, N | G, K, N | Da, G, K, N | Da, G, K, N | Da, G, N | Da, G, K, N | Da, G, K, N |
| 15 | Mesta | Da, G, N | Da, G, N | Da, G, K, N | Da, G, K, N | Da, G | Da, G | Da, G |
| 16 | Cotton | KA, NC | KA, NC | KA, NC | KA, NC | KA, NC | C, KA, NC | C, KA, NC |
| 17 | Tea | C, Da, L, S | C, Da, L, S | C, Da, L, S | Da, Di, S | C, Da, Di, S, NC | C, Da, Di, S, NC | C, Da, Di, S, NC |
| 18 | Sugarcane | C, S, KA | C, S, KA | C, Da, N, S, KA | C, Dib, N, S, KA | C, N, S, KA, NC | N, S, KA, NC | N, KA, NC |
| 19 | Coconut | NA | NA | NA | Da, K, N | K, N | C, K, N | C, K, N |
| 20 | Arecanut | NA | NA | NA | C, Da, K, Di, S | C, K, Di, S | C, K, S | C, K, S |
| 21 | Tobacco | Da, G, K, KA | Da, G, K, KA | Da, K, L | Da, G, K, L, NC | Da, G, K, L, KA, NC | G, K, L, KA, NC | G, K, L, KA, NC |
| 22 | Potato | Da, G, L, KA | Da, G, K, L, KA | C, Da, G, K, L, Di | Da, G, K, L, Di | D, K, L | Da, G, K, L | D, G, K, L |
| 23 | Sweet Potato | NA | NA | NA | G, K, L, Di | G, K | G | G, K |
| 24 | Chillies | Da, N, KA | C, Da, KA | C, Da, G, K, Di, NC | C, Da, K, L, NC | C, G, K, NC | C, Da, G, K, NC | Da, G, K |
| 25 | Turmeric | NA | NA | NA | Da, K, L, N, NC | Da, K, L, N, NC | Da, K, L, N, NC | Da, K, L, N, NC |
| 26 | Tapioca | NA | NA | NA | Da, G, KA, NC | Da, G, KA, NC | Da, G, KA, NC | G, KA, NC |
| 27 | Banana | NA | NA | NA | K, S, KA, NC | K, S, NC | C, K, S, NC | C, K, S, NC |
| 28 | Onion | NA | NA | NA | Da, K, L, N | G, K, N | Da, G, K, N | G, K, N |
| 29 | Pineapple | NA | NA | NA | NA | C, K, KA, NC | C, KA, NC | C, K, KA, NC |
Table 5: Districts Having Higher Concentration of Crops on the Basis of Concentration Index during 1951-52 to 2010-11.
But among the 29 major crops considered, 15 are found to have presence in more proportion than state average in North Cachar Hills. However, the most important cash crop of Assam, tea has more and more concentration in Cachar, Darrang, Lakhimpur and Sibsagar during 1951-56, but gradually shifted from Lakhimpur. Also, it occupies a vast area of Dibrugarh and North Cachar Hills.
Level of crop diversity was very low across the districts/zones of Assam during 1951-56. Karbi Anglong combined with N.C. Hills, one of the most backward agricultural zone of Assam recorded highest level of diversification as per HI index and comparatively less diversification was observed in relatively well-off Sibsagar, Jorhat, Golaghat oil and coal-field areas; Lakhimpur, Dhemaji flood prone districts and Cachar Barrack Valley zone (Table 6). Also, changes in HI index over time revealed relatively rapid progress in diversification achieved by N C Hills district which is followed by formerly undivided Goalpara region. It was again followed by Darrang, Sonitpur and Nagaon region of the state. Expansion of some flood resistant but less productive inferior cereals along with paddy and some winter crops and vegetables has been observed over time. All through there has been very slow progress in diversity in the Dibrugarh, Tinsukia, Sibsagar, Jorhat, and Golaghat where more concentration towards tea plantation has been recorded. Since 1981 these zones of upper Assam and Nagaon recorded more concentration of tea cultivation and several paddy fields have been converted to suitable tea gardens especially, by the big landowners and also by multinational companies for the relative profitability of tea as compared to food or other commercial crops (Table 7). However, in Cachar zone slow rate of diversification has been taking place against tea and gradually in favour summer paddy though still now proportion of land allocation towards tea is higher than the state average and summer paddy is cultivated on a small portion of area.
| Value of Herfindahl Index (HI) | |||||||
|---|---|---|---|---|---|---|---|
| Dist./Year | 1951-56 | 1961-66 | 1971-76 | 1981-86 | 1991-96 | 2001-06 | 2006-11 |
| Cachar, Karimganj, Hailakandi | 0.46 | 0.46 | 0.40 | 0.39 | 0.43 | 0.43 | 0.44 |
| Darrang, Sonitpur, Udalguri | 0.35 | 0.34 | 0.29 | 0.24 | 0.24 | 0.22 | 0.21 |
| Goalpara, Dhubri, Kokrajhar, Bongaigaon, Chirang | 0.36 | 0.30 | 0.29 | 0.25 | 0.22 | 0.20 | 0.19 |
| Kamrup(R&M), Nalbari, Barpeta, Baksa | 0.36 | 0.33 | 0.30 | 0.27 | 0.26 | 0.25 | 0.24 |
| Lakhimpur, Dhemaji | 0.45* | 0.44* | 0.34 | 0.35 | 0.40 | 0.35 | 0.38 |
| Dibrugarh, Tinsukia | -- | -- | 0.62 | 0.28 | 0.33 | 0.34 | 0.40 |
| Nagaon, Morigaon | 0.34 | 0.34 | 0.32 | 0.25 | 0.22 | 0.23 | 0.23 |
| Sibsagar, Jorhat, Golaghat | 0.50 | 0.53 | 0.46 | 0.40 | 0.38 | 0.43 | 0.43 |
| Karbi Anglong, | 0.24** | 0.23** | 0.42 | 0.46 | 0.42 | 0.43 | 0.40 |
| N.C. Hills | -- | -- | 0.34 | 0.24 | 0.17 | 0.16 | 0.15 |
| Assam | 0.37 | 0.35 | 0.32 | 0.28 | 0.27 | 0.26 | 0.26 |
Table 6: Changes in Crop Diversification in Assam Measured by Herfindahl Index since 1951-56.
| District/Year | 1951-56 | 1961-66 | 1971-76 | 1981-86 | 1991-96 | 2001-06 | 2006-11 |
|---|---|---|---|---|---|---|---|
| Cachar, Karimganj, Hailakandi | 30445 | 29928 | 31018 | 32368 | 35314 | 32703 | 31573 |
| Darrang, Sonitpur, Udalguri | 25320 | 26509 | 30897 | 35198 | 40126 | 41367 | 49789 |
| Goalpara, Dhubri, Kokrajhar, Bongaigaon, Chirang | 1467 | 1603 | 2098 | 2576 | 3188 | 3471 | 3409 |
| Kamrup(R&M), Nalbari, Barpeta, Baksa | 1881 | 2074 | 2713 | 3159 | 3660 | 3436 | 3468 |
| Lakhimpur, Dhemaji | 46926* | 50243* | 57297* | 3680 | 4287 | 4763 | 4887 |
| Dibrugarh, Tinsukia | -- | -- | -- | 60273 | 68385 | 93484 | 95324 |
| Nagaon, Morigaon | 5064 | 5577 | 6372 | 6822 | 7829 | 8004 | 8299 |
| Sibsagar, Jorhat, Golaghat | 44571 | 46433 | 51930 | 58962 | 64895 | 76113 | 77335 |
| Karbi Anglong, | -- | -- | -- | -- | 1367 | 1748 | 1803 |
| N.C. Hills | -- | -- | -- | -- | 4233 | 4065 | 4528 |
| Assam | 155674 | 162367 | 182325 | 203038 | 233284 | 269154 | 280415 |
Table 7: District wise area under tea in Assam since 1951-52 (Hectare).
Simple regression results of diversification index (HI) on rainfall, maximum temperature in Kharif (April-Sept.) and Rabi season (Oct.-March), intensity of irrigation and chemical fertilizer use across regions during 1976-80 and 2006-10 are shown in Table 8a. The results reveal that irrigation virtually has no role in the inter-zonal variation in observed diversification, while chemical fertilizer has significant inverse impact on the variation in diversification level. As described above, the developed agricultural area became specialized more in some specific crops and the area recorded more diversification, have gone for some relatively inferior crops requiring less chemical fertilizer due to low progress of irrigation intensity. But the linear regression model is not found to be good fit as compared to fixed effect model, as presented in Table 8b. The fixed effect model on the stacked data however reveals that chemical fertiliser has significant inverse impact on the diversification, while maximum temperature in Kharif season also has positive impact on the diversification level and that of Rabi season has inverse effect on the level of diversification (Table 8b). Though the truth is that variation in rainfall in Kharif season and incidence of flood has significant impact on variation in choice of varieties of paddy crops, it is not reflected in the overall HI as most of those paddy varieties also fall within each paddy group and not much change in each group would be reflected. The chow test reveals the stability of the coefficients except for chemical fertiliser with intercept case.
| Variable | Coeff. | Z-value | Z | P-value |
|---|---|---|---|---|
| Constant | 0.789 | 0.179 | 4.39 | 0.000 |
| Irrigation | 0.00272 | 0.00166 | 1.63 | 0.102 |
| Chem. Fert. | 0.000336 | 0.000286 | 1.17 | 0.241 |
| Rain (Kharif) | -0.0000261 | 0.0000148 | -1.76 | 0.078 |
| Rain (Rabi) | 0.0000291 | 0.0001117 | 0.26 | 0.795 |
| MaxTemp (Khariff) | -0.03335 | 0.01296 | -2.57 | 0.010 |
| MaxTemp (Rabi) | 0.031708 | 0.01475 | 2.15 | 0.032 |
| North & Lower Brahmaputra Valley | 0.1132982 | 0.02934 | 3.86 | 0.000 |
| South Brahmaputra Hill Zone | 0.0315 | 0.0587 | 0.54 | 0.592 |
Table 8a: Results of Random Effect GLS Regression by Robust Method.
| Without Intercept | R2 = 0.796, Adj.R2 = 0.706, F = 8.84 (Sig. = 0.00) |
With Intercept | R2 =.84, Adj.R2= 0.565, F = 3.058 (Sig. = 0.073) | |||
|---|---|---|---|---|---|---|
| Variable | Coeff. | t-value | Sig. | Coefficients | t-value | Sig. |
| Constant | 00 | -- | -- | -.442 | -.822 | .438 |
| Irrigation | .003 | 1.026 | .335 | .004 | 1.040 | .333 |
| DIrrigation | .004 | .572 | .583 | .008 | .931 | .383 |
| Chem. Fert. | -.015 | -2.606 | .031 | -.015 | -2.573 | .037 |
| DChem. Fert. | .016 | 2.677 | .028 | .015 | 2.618 | .034 |
| Rain (Kharif) | -1.614E-005 | -.110 | .915 | -1.985E-005 | -.132 | .898 |
| DRain (Kharif) | .000 | 1.481 | .177 | .000 | 1.606 | .152 |
| Rain (Rabi) | 2.574E-005 | .040 | .969 | .000 | .261 | .801 |
| DRain (Rabi) | -.003 | -1.936 | .089 | -.003 | -1.872 | .103 |
| MaxTemp (Khariff) | .035 | 3.400 | .009 | .053 | 2.199 | .064 |
| DMaxTemp (Khariff) | -.006 | -.155 | .880 | -.006 | -.136 | .895 |
| MaxTemp (Rabi) | -.014 | -1.226 | .255 | -.020 | -1.450 | .190 |
| DMaxTemp (Rabi) | .007 | .135 | .896 | 5.293E-005 | .001 | .999 |
Table 8b: Results of fixed effect model of diversification index across the zones of Assam on various predictors.
The erratic rainfall over the years that is characterised by rising early monsoon rainfall or in later months and decline in rainfall of peak rainfall months forced the poor farmers to go for some inferior (in terms of productivity) but highly flood resistant short period crops. Also the rainfall in winter (Rabi) season that has been declining over the years across major zones coupled with slow progress of irrigation forced to diversify in favour of inferior crops. The reduction in risk is the primary consideration for the cropping choice. The intercepts in linear regression is positive and significant, which shows the impact of dummy variable that may represent the effect of better infrastructure.
Above analysis reveals specialization towards some fertilizer intensive commercial crops in some parts of Assam, while diversification is observed in some regions with some irrigation improvement and that too towards some inferior crops i.e., diversification towards traditional crops, which may be explained in terms of crop risk, scarcity of credit, and lack of infrastructure in the hilly backward NC Hills and Karbi Anglang. Generally, diversification across the progressive regions of India is observed in pursuit of technology, market risk and profitability. The current unusual result is supported by the growing uncertainty in seasonal rainfall, growth of fertilizer use, poor irrigation development across the region and rising temperature particularly in monsoon period, which is shown in regression results.
The study lacks in explaining the impact of modern implements, market infrastructure, government policy and price etc due to lack of information. Also farmers in the foothill regions confront varied flood incident due to erratic rainfall in the high hill areas. Therefore, the changes in agricultural activities in the foothills would partly depend on the changing weather conditions in the high hill area. So there is a scope for further study in this direction.
