Research Article - (2013) Volume 2, Issue 4
Bone Morphogenetic protein 2 holds great promise for potential applications in the clinic. It is a potent growth factor for the use in the cervical spine surgery (FDA approved 2002) and has been marketed as “Infuse” for treating open tibial shaft fractures (FDA approved 2004). However, its use is limited by several significant side effects that maybe due to its potency and effect on different stem cell populations in the spine. BMP2 is expressed throughout the human body in several tissues and at a very high concentration in the blood. BMP receptors, especially BMP receptor type Ia, is ubiquitously expressed in most tissues. Currently, it is difficult to determine how BMP2 is physiologically distributed in mice or humans and no quantitative models are available.
A Physiologically-Based Pharmaco-Kinetic (PBPK) model has been developed to determine steady-state distribution of BMP2 in mice. The multi-compartmental PBPK model represents relevant organ/tissues with physiological accuracy. The organs/tissue compartments chosen were brain, lung, heart, liver, pancreas, kidney, uterus, bone and fat. A blood compartment maintained connectivity among the various organs. Four processes characterized the change in the concentration of the protein in every compartment: blood flow in, blood flow out, protein turnover and receptor binding in the organ. The unique aspects of the model are the determination of elimination using receptor kinetics and generation using protein turnover. The model also predicts steady state concentrations of BMP2 in tissues in mice and may be used for possible scale-up of dosage regimens in humans.
Keywords: BMP2; PBPK; BMP2 receptor; BMP2 distribution; Systems biology; BMP2 steady state concentrations
Bone Morphogenetic Protein 2 (BMP2) belongs to the TGF beta superfamily. It was first identified by extraction from bone [1]. Injection into the muscle of mice was shown to lead to the development of bone formation making BMP2 a potent inducer of bone growth. Several studies support the use of BMP-2 for complicated cases of open tibial shaft fractures and for tibial non-unions, however its use, even FDA approved, is limited due to its severe side effects [2]. BMP2 is expressed throughout the human body in several tissues and at a very high concentration in the blood. It signals via BMP receptors of type I and type II. BMP receptors are serine threonine kinases and the signal cascade is initiated by binding of BMP2 to type I and type II receptors. Of the BMP type I receptors, the Bone Morphogenetic Protein Receptor type Ia (BMPRIa) is the most ubiquitously expressed receptor, while the Bone Morphogenetic Protein Receptor type Ib receptor (BMPRIb) is more selectively expressed. Little is known about the distribution of BMP2 in tissues and only limited information is available about various tissue concentrations of BMP2 and its receptors. This is due to the fact that BMP2 and its receptors are present at very low concentration levels making quantification difficult.
We present here a physiological based pharmacokinetic model for the determination of the steady state concentration of BMP2 in mice. Features that characterize our approach to modeling are the determination of elimination using receptor kinetics and generation using fractional synthesis protein kinetics. This PBPK model may be used as a guide to define initial dosage required to achieve desired concentration in a specific target organ and a baseline model for possible scale-up to humans.
Materials
The BMP2 (SC-5683) antibody was purchased from Santa Cruz Biotechnology (Santa Cruz, CA). The secondary antibody conjugated to HRP (SC-2020) was purchased from Santa Cruz Biotechnology (Santa Cruz, CA). Western blot detection Kit was obtained by GE Healthcare. Autoradiography films were from Denville Scientific (New Jersey, USA).
BMP2 expression
BMP2 expressions were obtained for select organs. Six 8 week old female C57BL/6J obtained from Jackson Laboratory were mock injected with 50 microliter PBS 1 day per week for 5 days and then housed for 4 weeks. After sacrifice by CO2 heart, lung, liver, and kidney were isolated, and frozen at -80°F. Tissues were then homogenized (Wheaton Tissue Grinder 358039) for 1 min using RIPA buffer according to the protocol obtained by Sigma Aldrich. Protease inhibitors were added to inhibit protein degradation. Samples were centrifuged at 13000 rpm and supernatant was subjected to SDS page followed by Western blot. BMP2 antibody was used 1:1000 followed by the secondary HRP conjugated antibody (1:10000). Detection was performed using the GE Healthcare ECL detection kit following manufacturer’s protocol.
Model development
Development of the PBPK model was performed in the following steps.
1. Outline and arrange pharmacologically important tissues in an anatomically correct order
2. Define the process of protein distribution from blood to organs.
3. Establish the mass balance equations for each organ and obtain the required physiological and pharmacokinetic parameters (organ volumes, blood flow rates, receptor expressions and protein turnover).
4. Substitute the model parameters into the differential mass balance equations for plasma and tissues to generate steadystate concentrations
Model selections
Figure 1 is the schematic representation of the PBPK model for BMP2. The model includes pharmacologically important tissues (blood plasma, lungs, heart, liver, kidney, pancreas, uterus, bone and fat). The assumptions for the PBPK model are:
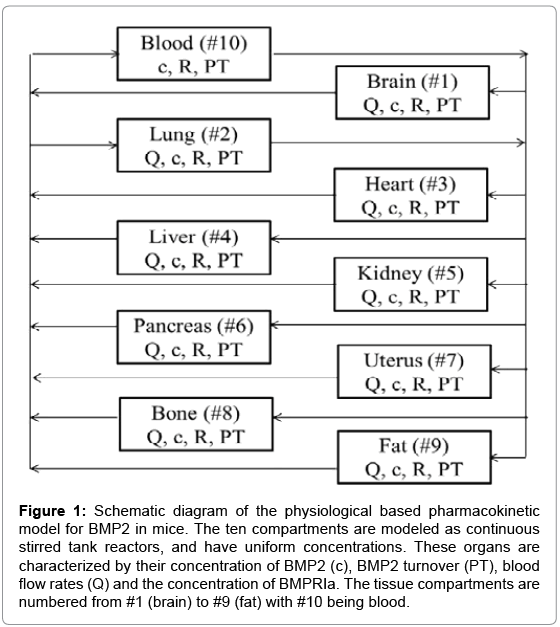
Figure 1: Schematic diagram of the physiological based pharmacokinetic model for BMP2 in mice. The ten compartments are modeled as continuous stirred tank reactors, and have uniform concentrations. These organs are characterized by their concentration of BMP2 (c), BMP2 turnover (PT), blood flow rates (Q) and the concentration of BMPRIa. The tissue compartments are numbered from #1 (brain) to #9 (fat) with #10 being blood.
1. Inter-compartmental transport occur via blood flow
2. Instantaneous equilibrium between tissue and blood within the tissue
3. Equal protein concentration in effluent blood and blood within the tissue
4. BMPRIa receptor binding of BMP2 follows second order kinetics
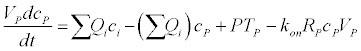
Differential mass balance equations
Blood:
All other organs:
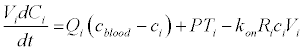
Where Vi is the tissue volume, ci is the total BMP2 concentration in the tissue, Qi is the blood flow rate in the tissue, PTi is the protein turnover of an organ, Ri is the BMPRIa receptor concentration in the organ and kon is the receptor binding constant.
Model parameters selection and calculation
The required physiological parameters are tissue volumes, blood flow rate in tissue and receptor binding constant, which were obtained from literature. The organ volumes were assumed to be directly proportional to the organ masses and hence the mass fraction is equal to the volume fraction. The total volume of a mouse was calculated from the average blood volume of a mouse. The organ blood flow rates were calculated using fractional flow rate data from literature.
The required pharmacokinetics like protein turnover, protein steady-state concentrations, and the receptor concentrations were derived from experimental data or calculated from previous published data.
A signaling protein like BMP2 interacts with many protein receptors as a part of a signaling cascade. BMP2 interacts with a receptor called BMPRIa, the most ubiquitously expressed type I receptor. The binding constant, kon was 6×10¹¹ M-1s-1 from literature and assumed to be similar for all organs. Ror was calculated by calculating the expression-receptor concentration translation factor using literature data for liver in mice. The translation factor is assumed to be same for all organs, varying with the normalized mRNA expression. The BMPRIa expressions were obtained from experiments and literature values.
The steady state BMP2 concentrations were determined by using expression data from literature and the western blot experimental data. These data were normalized to BMP2 kidney expression. The kidney expression was available for both literature and western blot data thus making it possible for normalizing both sets of data. Translation factor was determined from literature and used to convert normalized BMP2 expression data to BMP2 concentration data.
The protein turnover, PTi, is the net combination of the protein synthesis rate and protein degradation rate. Since parameters for calculating these two terms separately were hard to determine, the protein turnover was determined by fitting the steady state BMP2 concentration data with the PBPK model at steady state.
Computer simulations and data analysis
Microsoft Excel was used for making all the numerical calculations. Excel has specialized built-in multiple equation solver functions which were used for solving systems of linear equations.
Expression of BMP2 in tissues
The expressions of BMP2 on protein level were measured by Western blot. For this PBS-injected mice were sacrificed, the organs removed and the tissue homogenized. After homogenization, the tissue samples were prepared followed by SDS page and Western Blot Figure 2. Three independent Western blots were quantified and the data normalized to the expression of BMP2 Figure 3. These expressions were obtained for the kidney, liver, lung and heart. Known expressions of BMP2 in the literature were obtained for the other organs and used to calculate concentrations for BMP2.
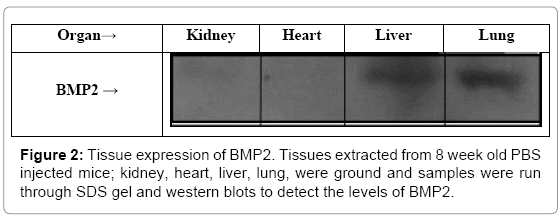
Figure 2: Tissue expression of BMP2. Tissues extracted from 8 week old PBS injected mice; kidney, heart, liver, lung, were ground and samples were run through SDS gel and western blots to detect the levels of BMP2.
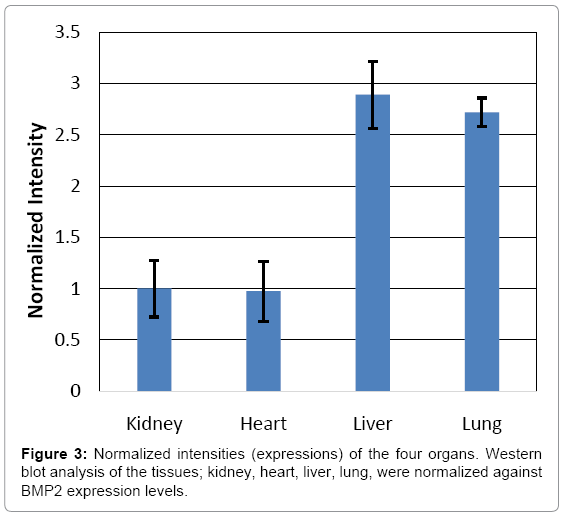
Figure 3: Normalized intensities (expressions) of the four organs. Western blot analysis of the tissues; kidney, heart, liver, lung, were normalized against BMP2 expression levels.
Model parameter selection
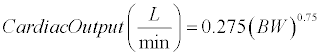
Table 1 summarizes the physiological parameters for the PBPK model. In PBPK modeling, the concentrations of BMP2 are constant in an organ, and the organs are connected by blood flows which allow for the distribution of BMP2 between them. The blood flows are calculated as fractions of the total cardiac output, which was calculated from a scaling relationship for 25 g mice given below:
| Flow rates | Sources/Notes | Volumes | Sources/Notes | |||
| Fraction | L/s | Fraction | L | |||
| Brain | 0.0330 | 9.51E-06 | ILSI [14] | 0.0170 | 5.44E-04 | ILSI [14] |
| Lung | 0.0500 | 1.44E-05 | ILSI [14] | 0.0070 | 2.28E-04 | ILSI [14] |
| Heart | 0.0660 | 1.90E-05 | ILSI [14] | 0.0500 | 1.63E-03 | ILSI [14] |
| Liver | 0.1610 | 4.64E-05 | ILSI [14] | 0.0550 | 1.79E-03 | ILSI [14] |
| Pancreas | 0.0157 | 4.54E-06 | Graf et al. [12] | 0.0700 | 2.28E-03 | ILSI [14] |
| Kidney | 0.9100 | 2.62E-04 | ILSI [14] | 0.0170 | 5.55E-04 | ILSI [14] |
| Bone | 0.0407 | 1.17E-05 | Graf et al. [12] | 0.1073 | 3.50E-03 | ILSI [14] |
| Fat | 0.0360 | 1.04E-05 | Graf et al. [12] | 0.0820 | 2.68E-03 | ILSI [14] |
| Uterus | 0.0087 | 2.50E-06 | Kawamoto et al. [13] | 0.0101 | 3.30E-04 | Nielsen et al [15] |
| Blood | 1.0000 | 2.88E-04 | Sum of all flow rates | 0.0613 | 2.00E-03 | ILSI [14] |
Table 1: Organ Flows rates and Volume in mice. The flow rates and volumes were obtained mainly from the ILSI parameters booklet ILSI [14] and the BioDMET database [12]. The parameters for the mouse uterus were difficult to find, and hence were drawn from research papers as indicated. The flow fraction and volume fraction for the uterus were calculated using the data in the sources. These quantities were scaled for the current mouse model by multiplying with the cardiac output and the total body volume respectively. The blood flow rate is the sum of all the flow rates, and hence is a whole fraction.
 (1)
(1)
where BW is the body weight of a mice in kilograms
Plugging in the weight of the mouse, we get 0.01729 L/min, or 2.88E-4 L/s. The fractions of the cardiac output were obtained from various sources, and were multiplied by the cardiac output to get the blood flows for each organ in L/s.
Similarly, the organ volumes were calculated as fractions of the total body volume. These volume fractions were obtained as mass fractions, but were assumed to be approximately equal as the densities are close to one. In Mitruka and Rawnsley [3], the range for the blood volume is given to be between 2 – 2.5 mL in a 25 g mouse. For the purposes of this model, the blood volume was taken to be 2.0 mL. The volume of the body of a mouse was obtained by dividing the blood volume by the volume fraction of the blood.
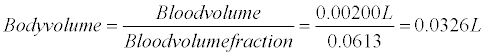 (2)
(2)
The rest of the organ volumes were obtained by multiplying this body volume by the volume fractions, which are summarized in Table 1.
Table 2 summarizes the receptor binding parameters for the PBPK model. BMP2 is bonded to the receptor BMPRIa by the following reversible reaction:
| Receptor Expression | Ri | Source | ||
| Relative | Normalized | Conc. (mol/L) | ||
| Brain | 688.14 | 4.6524 | 3.85E-08 | Wu et al. [5] |
| Lung | 160.16 | 1.0828 | 8.96E-09 | Wu et al. [5] |
| Heart | 273.47 | 1.8489 | 1.53E-08 | Wu et al. [5] |
| Liver | 147.91 | 1.0000 | 8.28E-09 | Wu et al. [5] |
| Pancreas | 64.95 | 0.4391 | 3.63E-09 | Wu et al. [5] |
| Kidney | 156.07 | 1.0552 | 8.73E-09 | Wu et al. [5] |
| Bone | 24.85 | 0.1680 | 1.39E-09 | Wu et al. [5] |
| Fat | 272.33 | 1.8412 | 1.52E-08 | Wu et al. [5] |
| Uterus | 213.82 | 1.4456 | 1.20E-08 | Wu et al. [5] |
| Blood | 110.24 | 0.7453 | 6.17E-09 | Wu et al. [5] |
Table 2: Receptor concentrations derived from Receptor expressions. These expressions were derived from the probesets 1425491_at, 1425493_s_at, and 1425494_s_at, which are a part of the dataset GeneAtlas MOE430 Lattin et al. [6]. Except for the brain and the blood, the expressions for all other organs and tissues were readily available from the dataset. The expression for the brain was obtained by adding the expressions for its different parts. These parts were the cerebellum, the cerebral cortex, the prefrontal cortex, the amygdala, the hippocampus, the hypothalamus, and the microglia. Similarly, the expression for the blood was obtained from B-Cells, Baf3, T-cells and macrophages.
BMP2 + BMPRIa↔ BMP2 − BMPRIacomplex (3)
One of the major assumptions regarding this reaction is that the backward reaction does is negligible as compared to the forward reaction. The forward reaction is characterized by the following rate equation:
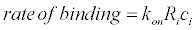
s rateofbinding = konRici (4)
where kon is the receptor binding rate constant, Ri is the concentration of BMPRIa in an organ, and ci is the concentration of BMP2 in the same organ
The form of this equation is obtained from Umulis et al. [4] and is the same for all the organs. The term kon has the value 6E+11 M-1s-1 [4], while the receptor concentrations were derived from mRNA expressions of the different organs. These mRNA expressions were obtained from the BioGPS database Wu et al. [5] by taking the averages of the expressions from the probesets 1425491_at, 1425493_at and 1425494_s_at Lattin et al. [6]. These expressions were assumed to be accurate in terms of relative levels, and could be converted to concentrations if the absolute level (in terms of the concentration) of one of the organs was known. This can be understood mathematically in the form of the following equation:
ci = kEi (5)
where, k isss the organ concentration of the organ with an expression of 1 after normalization, and E is the expression in an organ.
The BMPRIa concentration for the liver was obtained from the Moped database to be 8.28E-09 mol/L [7]. Thus, the other expressions were normalized to the liver, and then multiplied by its concentration in liver to obtain the absolute levels in every organ. This method was taken from Chen and Balthasar [8].
Table 3 summarizes the literature data, western blot results for the BMP2 expressions and respective steady state concentrations for the PBPK model. The steady-state concentrations for the protein were obtained from a mixture of experimental and theoretical data. The expressions for kidney, heart, liver, and lung were obtained from western blot experiments, while the others were obtained from the BioGPS database from the GeneAtlas dataset MOE430, using the probeset 1423635_at Lattin et al. [6]. The normalized values were converted to the steady-state concentrations by the same method used for converting the receptor expressions. The normalized expressions were multiplied by the concentration of BMP2 in the kidney, which was obtained from the Moped database Kolker et al. [7].
| Normalized | Conc. (mol/L) | Sources/Notes | |
| Brain | 9.266 | 3.94E-06 | Wu et al. [5] |
| Lung | 2.718 | 1.15E-06 | Experiment |
| Heart | 0.974 | 4.14E-07 | Experiment |
| Liver | 2.891 | 1.23E-06 | Experiment |
| Pancreas | 0.647 | 2.75E-07 | Wu et al. [5] |
| Kidney | 1.000 | 4.25E-07 | Experiment |
| Bone | 5.855 | 2.49E-06 | Wu et al. [5] |
| Fat | 0.900 | 3.82E-07 | Wu et al. [5] |
| Uterus | 2.200 | 9.34E-07 | Wu et al. [5] |
| Blood | 9.429 | 3.88E-09 | Wu et al. [5] |
Table 3: BMP2 Normalized expressions and derived concentrations. These expressions were derived from a single probeset 1423635_at from the MOE430 dataset for mice Lattin et al. [6]. The expressions for all organs except the blood and the brain were obtained from the dataset, while those for the brain and blood were summed from the expressions of their individual parts which were available. For the brain, the expressions were obtained from the cerebellum, the cerebral cortex, the prefrontal cortex, the amygdala, the hippocampus, the hypothalamus and the microglia. Similarly, the expression for the blood was obtained from B-Cells, Baf3, T-cells and macrophages.
The protein turnover is a measure of the rate of generation of BMP2 and thus a measure of the rate of BMP2 being synthesized and broken down in the body. This term was calculated by rearranging the differential equations at steady-state to give the following equation:
For Blood: 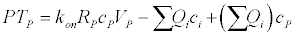 (6)
(6)
For other organs: 
These equations were solved by substituting the values of all the parameters. The results of this calculation are summarized in the Table 4.
| Organ | Protein Turnover mol/s |
| Brain | 5.05E-05 |
| Lung | 1.41E-06 |
| Heart | 6.20E-06 |
| Liver | 1.10E-05 |
| Pancreas | 1.37E-06 |
| Kidney | 1.23E-06 |
| Bone | 7.27E-06 |
| Fat (Brown) | 9.32E-06 |
| Uterus | 2.22E-06 |
| Blood | 2.85E-08 |
Table 4: Calculated Protein Turnover. The turnover is specific to the protein BMP2, is representative of the breakdown and synthesis processes of BMP2, and can be calculated at steady-state from its distribution in the body and interaction with its receptor BMPRIa.
The goal of the present study was to develop a PBPK model for BMP2 in mice for determination of steady state concentrations. This model is important since BMP2 is used clinically and injected into the spine and several side effects are reported. One reasons maybe the diffusion of BMP2 from the injection site into the blood stream and distribution from there to other organs. In order to predict the effects of BMP2 accumulation and potential side effects a PBPK model of BMP2 in the steady state is first needed. Because the drug of concern for this model was a protein, more terms were included in the balance equations, namely the protein turnover and the receptor kinetics terms. These terms characterize the net protein synthesized, broken down, and interacted with the receptors in the body. The model for interaction with the receptors was modeled after second order receptor kinetics, with the forward reaction summarized in the following equation:
This equation is a simplified version of the model presented in Umulis et al. [4] in which diffusive effects and the effects of the backward reaction were incorporated. Both of these effects were not incorporated in the current version of the model and assumed to be not appropriate for the modeling objectives. The BMP2-BMPRIa interaction takes place on the cell surface as opposed to inside the cell, and hence diffusion would not characterize the interaction. Also, the backward reaction is assumed to be negligible as compared to the forward reaction, which was also touched back in the results section.
Protein synthesis and degradation are opposing processes which progress simultaneously. In relation to proteins, the term ‘turnover’ describes both synthesis and degradation process [9]. These two opposing processes form a part of the general protein metabolism. The equation for BMP2 turnover (PTi) as described by the present model is as mentioned in Equation (6):
For Blood: 
For other organs: 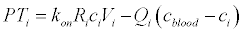
All the organs have a positive protein turnover, which means that BMP2 turnover is anabolic, with more protein is being synthesized than broken down in the body at steady state. The protein turnover is lowest in the blood and highest in liver followed by the brain. The differences in protein turnover could be due to the presence of antagonists for BMP2 in the tissues. These are expressed in different concentrations in the various tissues [1]. Additionally, BMP2 is synthesized by cells in precursor form and needs to be activated to be active. Our data obtained from the WB relate to the mature BMP2 protein. As seen from the equations, protein turnover is independent of concentration at steady state but depends on the distribution of BMP2 in the body and its interaction with BMPRIa. The lowest protein turnover is observed in the blood system. This data may explain why BMP2 has major effects especially on vascular tissues Matsubara et al. [10] and may explain the role of BMP2 in arterial plaque formation observed in vivo Johnson et al. [11]. One limitation of this model is the exclusion of other BMP2 type I receptors, such as BMPRIb or Alk2. Additionally, we assumed that the type I receptor is the limiting receptor for signaling and that there is no shortage of BMPRII. We did also not consider crosstalk of other BMPs such as BMP4, BMP7 etc. with the BMPRIa.
However, this model is among the first of its kind for bone morphogenetic proteins and describes for the distribution of active BMP2 in the tissues. In the absence of dynamic data, a mathematical model describing the steady-state levels of the protein was the best option. This model can be manipulated to be used as guidance for experiments, or could also be upgraded to include the dynamics of the system once the data is in hand.
We acknowledge the support of NIH RO1AR064243 and thank the NIH COBRE on Membrane Protein Production and Purification.