Research Article - (2014) Volume 2, Issue 1
Keywords: Air moisture, Stable isotopes, Climate studies, Vapor source identification, Southwest monsoon
Water vapor is one of the most important trace gases in the Earth’s atmosphere and plays a key role as a partner of homogeneous & heterogeneous chemical reactions [1,2] and short-wave & long-wave radiative budget of the atmosphere [3]. Increase in its concentration by 30-150 n mol/mol yr-1 since 1954 [4-6] - has generated interest in its direct consequences on the Earth’s climate and the atmospheric chemistry [7,8]. Mostly, H2O concentration measurements along with the atmospheric circulation models are used to place constraints on the H2O cycle in the middle atmosphere [6,9,10].
Measurements of δD, δ18O and deuterium excess (d-excess) in atmospheric water or air moisture provide insights into the hydrologic cycle, ecological processes, the paleoclimate [11-13] and also provide important means to calibrate atmospheric models of the water cycle at the global and regional scales [14-21]. The relative concentration of stable isotopologues of water (H216O, HD16O, H218O, H217O) varies in the water vapor over its life cycle in the atmosphere due to difference in saturation vapor pressures, diffusion rates of these isotopologues. The processes governing this life cycle include evaporation at the surface, vertical and lateral transport and mixing in the atmosphere, recycling by ecosystems, in situ condensation and evaporation during cloud formation and removal as rain or snow [11,22-24].
There are numerous studies on climate and precipitation interannual variations for the time period 1870 present [25-27] but there is a shorter (1961-present) and much sparser record of precipitation isotopes, and almost no record of the isotopic composition in atmospheric water vapor. The value of δ18O (H2O) is -12‰ and δD(H2O) is –85‰ just above the ocean [28] and its cooling during upward air movement causes cloud formation and due to the vapor pressure isotope effect preferential condensation and subsequent results in removal of the isotopically substituted H2O isotopologues by precipitation. The D/H, 17O/16O, and 18O/16O isotope ratios in H2O thus decrease with altitude and the difference in isotope ratios also observed due to amount effect (in case of precipitation) and latitude effects. Using these principles, National Institute of Hydrology, Roorkee has carried out the work for the first time in India to understand the role of water vapor (air moisture) isotopes in climate studies, vapor source identification and in understanding southwest monsoon dynamics.
The studies were conducted at National Institute of Hydrology, Roorkee (Uttarakhand), India falling under the latitude 29°52’, longitude 77°53’ and altitude 268m Figure 1. The normal rainfall of Roorkee is 1156.4 mm per annum and out of which 1004.3 mm is recorded during the monsoon seasons (June to October). The monthly average maximum temperature of the study area is recorded in the range of 20.4 (January)-39.2°C (May) and monthly average minimum temperature in the range of 6.1(January)-24.9°C (July) and average relative humidity 78%.
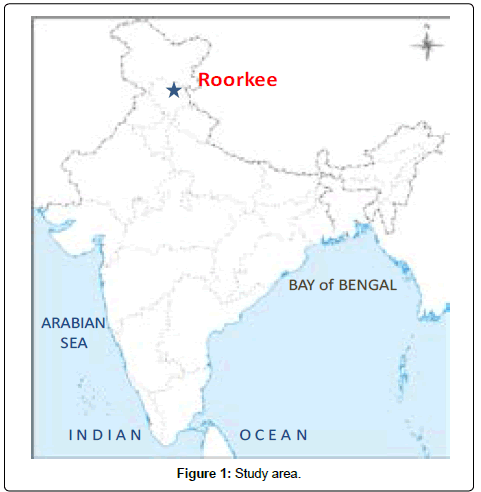
Figure 1: Study area.
Sample collection
The air moisture samples, for isotopic analyses, are collected one sample per day on daily basis from 9.30 am to 10.00 am by condensation method [29,30]. The time is preferred 9.30 am to 10.00 am due to (i) the relative humidity is usually higher compared to that in the afternoon. The higher the humidity, the greater will be the volume of liquid condensate collected in a given time. (ii) The temperature around this time is comparatively lower, and therefore, condensation is more and evaporation from the collected liquid is less. (iii) The melting of ice cubes in the aluminium cone is minimal and therefore, condensing efficiency of the cone does not change drastically over an hour or so of sampling period.
The location of the sampling is kept fixed for all the study period. The condensation device was kept in a Stevenson screen at a height of 1 meter from the ground level. For selecting the location the following precautions are taken into consideration that the location should be:
• Well-ventilated but not exposed to direct sunlight
• Not surrounded by vegetation or water body
• Not near a pipe which conveys heat
• Not near an outlet which emits hot or cold air or any kind of fumes
• Not approachable by birds or cattle
• Not near a pedestrian walkway
• Preferably at a location which the attendant can visit a couple of times during sampling
• Preferably on the first floor foyer or balcony with roof
In this method, the air moisture sample is collected using the conical condensation device Figure 2. The conical condensation device comprises; (i) Aluminum cone; (ii) metallic stand for holding and vertically aligning the aluminum cone at desired height; (iii) a lid with knob for covering the aluminum cone; and (iv) a cylindrical wire mesh cover for protecting the cone and the sample bottles.
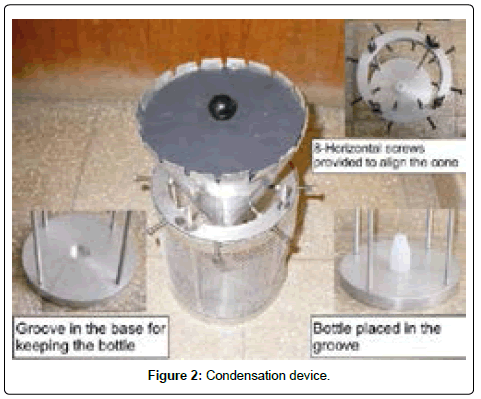
Figure 2: Condensation device.
The aluminum cone is aligned using the 8-screws provided for it, such that the tip of the cone is positioned just above the bottle and the droplets of the moisture condensed on the surface of the cone falls straight into the bottle. A 5-ml sampling bottle is placed into the groove at the base of the stand and ensured that the bottle is open (stub and cap removed), completely inserted into the groove and not shaking freely. The ice cubes are put into the cone up to the top, leaving little more space required for fixing the lid. The aluminum cone (filled with ice cubes and sealed by lid) in the stand is placed such that the axis of the aluminum cone is vertically aligned with the bottle placed in the groove. The position of the cone is adjusted such that the tip of the aluminum cone is centered at 0.5 cm above the mouth of the bottle. This will ensure that droplets of moisture condensing outside the aluminum cone can fall straight into the bottle and the falling droplets can be seen. Depending on prevalent relative humidity, it takes 30 minutes to 60 minutes for collecting 5 to 10 ml of liquid condensate. However, during the rainy season when relative humidity is very high, the sampling bottle is filled even within 30 minutes. After setting up the conical condensation device the date, time, temperature and relative humidity are recorded using thermo-hygrometer [29].
Sample analysis
Stable isotopes (2H or D and 18O) in water were analyzed using GVIso prime Dual Inlet Isotope Ratio Mass Spectrometer. For δ D analysis, 400 μl of the water sample is equilibrated with H2 along with Pt catalyst at 40°C for 3 h and then the equilibrated gas is introduced into the mass spectrometer. The δ18O of the sample is measured by equilibrating 400 μl of water with CO2 gas at 40°C for 7 h and then the equilibrated gas is introduced into the mass spectrometer. The measured values are reported as delta (δ) values [31]. The precision of measurement for δ 2H was within ± 1‰ and that for δ18O with in ± 0.1‰.
Climatologically studies
In a study conducted at National Institute of Hydrology, Roorkee by [32] a correlation was established between the isotopic compositions of the air moisture samples collected on daily basis by condensation method over a period of five years 2007-11 with the meteorological parameters. It was observed that the trend of stable isotopic composition of air moisture for the 5 years indicated a systematic depletion in isotopic average while the maximum depleted value of air moisture has been found almost same in all the five years which indicated the changing climatologically conditions at Roorkee i.e. increased arrival of oceanic vapors with time. This is a very important phenomenon and need to be understood fully. In the same study, the isotopic composition of air moisture for the monsoons over a period from 2007 to 2011 showed a systematic depleting trend with an overall depletion by approximately 33‰ for δ18O and 60‰ for δ2H in 5 years (Figures 3 and 4). This systematic trend of change in stable isotopic composition indicated towards the change in climatological conditions at Roorkee in recent years which was also seen in other meteorological data. Further, investigations in this aspect can contribute to improve the understanding of the isotope-hydrometeorology of India as well as to consider the stable isotopic signatures of air moisture and precipitation as one of the important meteorological parameters because other meteorological parameters only show the change in weather conditions while isotopic signatures also indicate the cause and source.
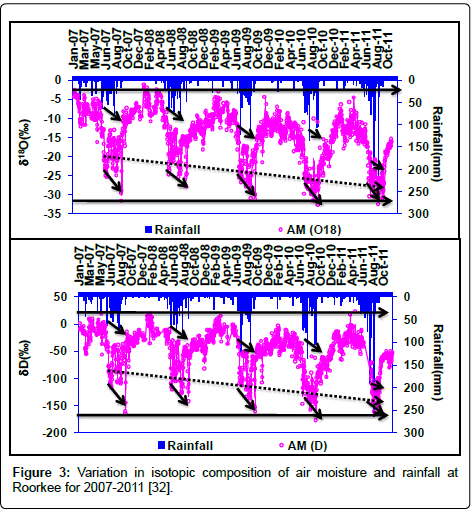
Figure 3: Variation in isotopic composition of air moisture and rainfall at Roorkee for 2007-2011 [32].
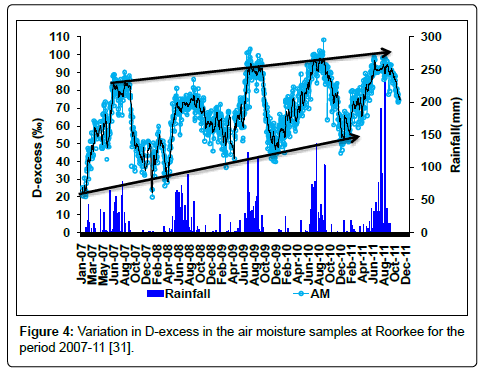
Figure 4: Variation in D-excess in the air moisture samples at Roorkee for the period 2007-11 [31].
Identification of source of air moisture
In an another study conducted by [33] at Roorkee, Uttarakhand, India establishing a correlation in the wind trajectory, water vapor data and corresponding changes in the isotopic signature of air-moisture it was inferred that the δ18O values of the air moisture varies with time (months and seasons) indicating the activeness of different sources of atmospheric vapors (Figure 5) and it was found that Roorkee (Uttarakhand, India) receives the rainfall during the monsoon from Arabian Sea and Bay of Bengal while winter season rains are influenced by the atmospheric vapors originating in Mediterranean Sea. During summer, the precipitation occurs due to water vapors originate locally or at regional scale.
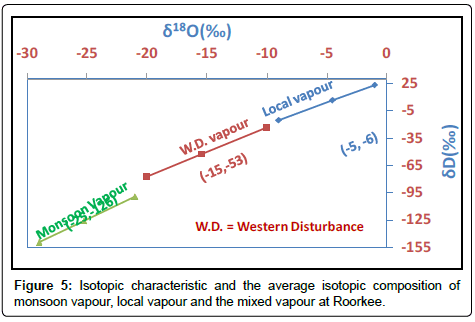
Figure 5: Isotopic characteristic and the average isotopic composition of monsoon vapour, local vapour and the mixed vapour at Roorkee.
Isotopic signatures of air moisture can be used to distinguish the source of atmospheric moisture as well as to estimate the contribution of the monsoonal and local vapors. With further analysis in future, semi-quantitative estimation of air-moisture flux transport can be provided.
Roorkee receives air moisture from various sources such as Arabian Sea, Indian Sea, Mediterranean Sea (Western disturbance), local and regional sources (Figure 6).
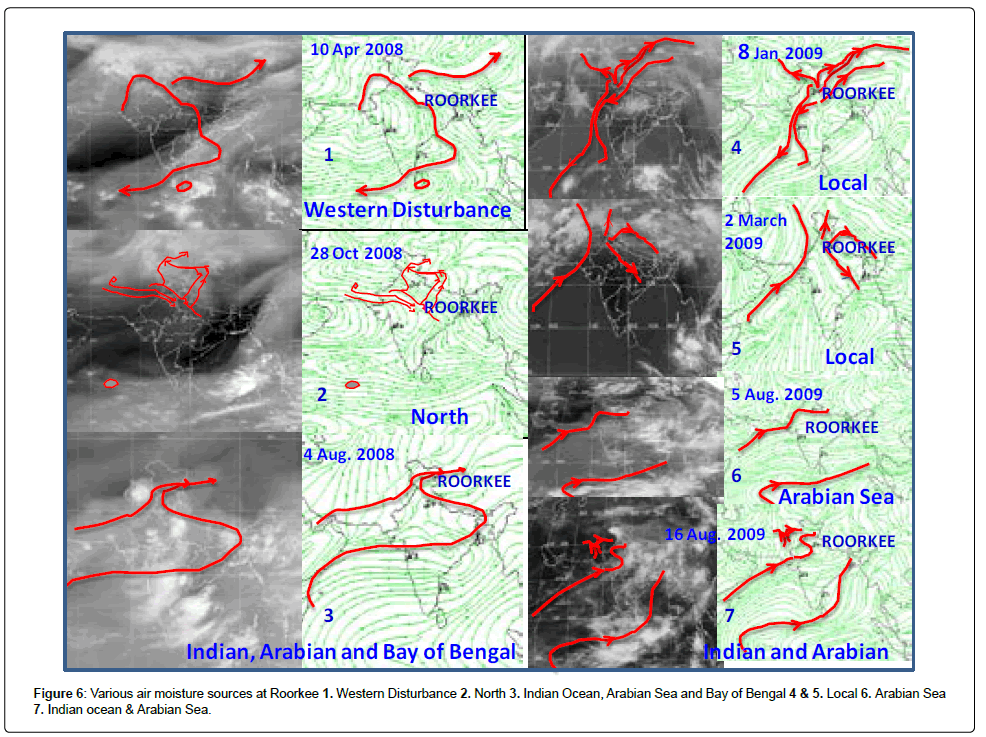
Figure 6: Various air moisture sources at Roorkee 1. Western Disturbance 2. North 3. Indian Ocean, Arabian Sea and Bay of Bengal 4 & 5. Local 6. Arabian Sea 7. Indian ocean & Arabian Sea.
Understanding Southwest (SW) Monsoon Dynamics
In this study conducted by [34], the air moisture samples were collected during 2008-10 in Indo-Gangetic plains at sites located a few hundred kilometers away along the southwest monsoon track: Roorkee (Uttarakhand) and Sagar (Madhya Pradesh). Isotopic composition of air moisture collected at both the sites is compared and it is found that the two isotopic spectra grossly correlate at most part of the spectrum indicating that although rainout process take place locally, its effect on the atmospheric water vapors can be observed over long distances.
The air moisture/water vapor received during SW monsoon period is always depleted as compared to the vapors received during nonmonsoon period (Figure 7). The same results were also observed in other studies [35-37]. The extent of depletion in isotopic composition of moisture and period over this depletion continues is directly linked with monsoon strength (intensity, episodes and duration), therefore, isotopes may be used to track movement of monsoon vapors and regional influx of moist vapor.
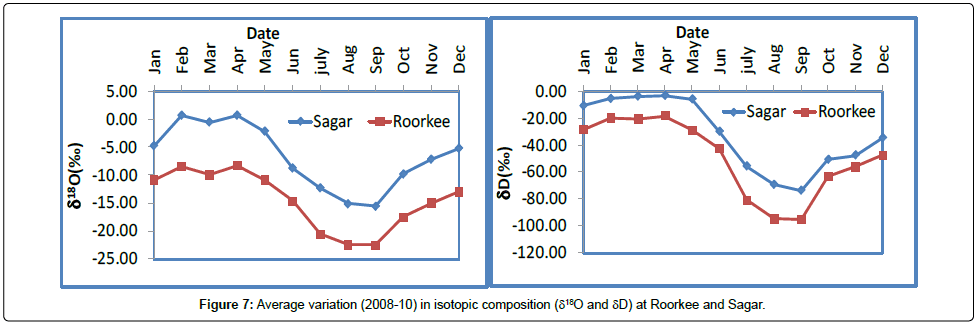
Figure 7: Average variation (2008-10) in isotopic composition (δ18O and δD) at Roorkee and Sagar.
From the studies, it has been found that (i) the systematic change in isotopic composition of air moisture indicate towards the change in climatological conditions at Roorkee (ii) the isotopic composition of water vapors have shown a good correlation in time domain in inferring monsoon signal. This can be concluded that the isotopes of air moisture can be used for studying the climatological conditions, for monsoon studies and in tracing its source.
Investigations in respect of role of isotopic composition of air moisture can contribute to improve the understanding of the isotopehydrometeorology as well as to consider the stable isotopic signatures of air moisture and precipitation as one of the important meteorological parameters because other meteorological parameters (temperature, humidity, rainfall etc.) only show the change in weather conditions while isotopic signatures also indicate the cause and source.
understanding of factors controlling the water and energy balance of the atmosphere, development of improved climate models and guide new studies of clouds and the atmospheric hydrology. The basic attributes of the climate system, including precipitation, evapo transpiration, atmospheric and soil moisture, would change with warming climate and the change in average pattern of these attributes to the extremities would be large enough to cause catastrophic impacts on life and assets. Therefore, to understand the nature of the ongoing changes in hydrology and their extreme manifestations such as cyclones and cloudburst will be a major challenge that is faced by hydrology related research communities. As we know that the micro physical processes may impart characteristic isotopic signatures to air moisture during extreme events, thus can be a useful tool to characterize the extreme events in terms of nature and scale of underlying processes.
The work was carried out under the project “National Programme on Isotope Fingerprinting of Waters of India” and authors are thankful to DST-SERC (Funded by DST vide IR/54/ESF/05-2004 dated July17, 2007) for sponsoring the study. Authors thank the Director, National Institute of Hydrology for his support and encouragement. Authors thank Dr M. Mohanty (DST) for his consistent and timely cooperation during the tenure of this project.
