Research Article - (2014) Volume 2, Issue 2
Keywords: Evaporative cooling; Temperature; Humidity ratio; Wet bulb effectiveness; Dew point effectiveness; Temperature-humidity index
Using of water evaporation for decreasing air temperature is a well-known cooling technology and an environmental friendly application. Due to increase in the awareness of environmental problems resulting from greenhouse emissions, various applications of evaporative cooling have been extensively studied and used for industrial and residential sectors, such as, humidifier, cooling tower and evaporative cooler [1-6].
Direct and indirect evaporative cooling systems are used to produce low temperature medium fluid (i.e., water, air, etc.). These systems usually require electricity (mostly) for the air transportation within the cooling process. Therefore, approximately two thirds of electrical power that mechanical vapor compression system consumes can be reduced [1,4], which thus reduces energy consumption and contributes to greenhouse gas reduction.
There are several researchers have been studied cooling energy, Scientists studied that the cooling energy is a significant part of the energy needed in buildings [7-16]. The need for cooling in buildings is increasing due to higher levels of targeted indoor environment in addition to the impacts of the global warming. Evaporative cooling is an efficient and sustainable method for cooling. Theoretically, the ultimate temperature for the evaporative cooling process is the ambient air wet bulb temperature, which is not easy to be reached practically. This is a main obstacle for wider utilization of evaporative cooling. Therefore processes that bring the air to temperatures lower than the wet-bulb temperature, without using a vapor compression cycles, need to be developed. Riangvilaikul, Kumar [17] developed a theoretical finite difference model of a dew point evaporative cooling system has been developed on heat and mass transfer processes. The performance of the system, namely, outlet air condition and cooling effectiveness are predicted from the model with the known inlet parameters. The simulation results are compared with the experimental findings for various inlet air conditions (typically covering dry, moderate and humid climate) and for different intake air velocities (1.56 ms-1). Good agreement and trend can be observed from both simulation and experimental results within 5 and 10% discrepancies of the outlet air temperature and effectiveness, respectively. Operating under different climate, the simulation results show that the dew point effectiveness varies significantly from 65 to 85% when the inlet air humidity changes from 6.9 to 26.4 g kg-1 at the constant inlet temperature (35°C). On the other hand, the wet bulb effectiveness is less sensitive ranging between 106 and 109% for the same inlet condition. Based on the analysis of influential parameters on the system performance, the system should be designed and operated at: intake air velocity below 2.5 m s-1, channel gap less than 5 mm, channel height larger than 1 m and ratio of working air to intake around 35-60%, to obtain the wet bulb effectiveness greater than 100% for all typical inlet air conditions.
Reducing temperature during daylight is one of the main problems facing greenhouse management in warm climates such in Egypt during summer season in addition to the high cost of using refrigerated cooling system, therefore, the main objective of this work is to optimize the parameters affecting the performance of the evaporative cooling system, to achieve that a mathematical model of heat and mass balance of the evaporative cooling pads was developed to predict the most important factors affecting the performance of the system such as the temperature, humidity ratio, wet bulb effectiveness, dew point effectiveness and temperature-humidity index of outlet air at different ambient air temperatures, air flow rates, ambient air humidities and different lengths of pad.
Model development
The governing equations describing the temperature and humidity change of the dew point evaporative cooling are the simultaneous heat and mass transfer equations. Figure 1 represents the inputs and outputs of the heat and mass balance for evaporative cooling system.
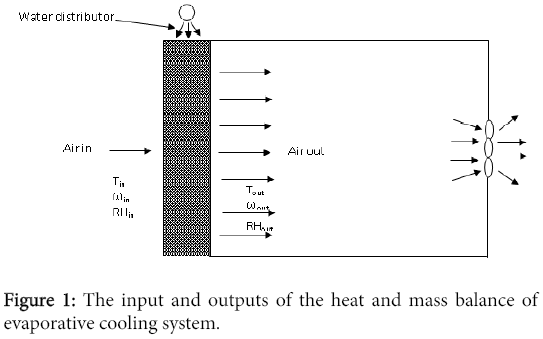
Figure 1: The input and outputs of the heat and mass balance of evaporative cooling system.
The following assumptions for development of the present model are made:
Temperature distribution of the water stream at any cross section is uniform.
No heat and mass transfer between the system and the surrounding.
The velocity and properties of all fluids are considered uniform within a differential control volume.
The wet surface is entirely saturated with water evenly.
Heat and mass transfer coefficients are constant along the pads.
Heat balance
An energy balance of a differential control volume can be written as follows [18]:
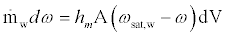
n&w Cpmdt= -hwA (T-T∞)dt(1)
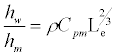
The specific heat of moist air is defined as [17]:
 (2)
(2)
Heat transfer coefficient calculation: To determine the heat transfer coefficient value (hw), Nusselt number (Nu), Reynold's number (Re) and Prandtl number (Pr) will be calculated from the following equations:
The Nusselt number (Nu) is related to the heat transfer coefficient by:
 (3)
(3)
 (4)
(4)
The Nusselt number (Nu) in a rigid cellulose paper evaporative media [19]:
 (5)
(5)
The Reynold’s number, Re, can be calculated as follows:
 (6)
(6)
The Prandtl number, Pr, can be calculated as follows:
 (7)
(7)
Mass balance
Mass transfer takes place only at wetted surface under the driving force of vapor partial pressure difference. The mass exchange is balanced and written as [20]:
 (8)
(8)
These governing equations demonstrate the profiles of the air temperature and humidity along the wet channel length which depend difference, respectively.
For air–water vapor mixtures in the wet passage, the relation of heat and mass transfer coefficients with Lewis number can be expressed as [21,22]:
 (9)
(9)
The wet bulb effectiveness is defined as the ratio of the difference between intake and outlet air temperature to the difference between intake air temperature and its wet bulb temperature. The wet bulb effectiveness is defined as [23]:
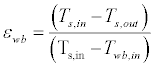 (10)
(10)
The dew point effectiveness is used to indicate (a) its cooling performance compared to its theoretical limitation, and (b) how close the outlet air temperature is to the dew point temperature of the intake air (ambient). The dew point effectiveness can be expressed as [11]:
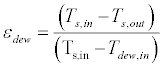 (11)
(11)
A temperature humidity index, THI, comprised of a linear combination of dry-bulb and wet-bulb temperature, has been used to estimate effect of heat stress [24,25] which presented as follows:
 (12)
(12)
All computational procedures of the model were carried out using Excel spreadsheet. The computer program was devoted to heat and mass balance for predicting the temperature, humidity ratio, wet bulb effectiveness and dew point effectiveness of outlet air. Table 1 and 2 shows the parameters used in the model and Nomenclature.
| Parameter | Units | Value | Source |
|---|---|---|---|
| Specific heat moist air, CP | kJ kg-1°C-1 | 1.006 | Dowdy and Karabash, 1987 |
| Specific heat water vapor, Cv | kJ kg-1°C-1 | 0.503 | Dowdy and Karabash, 1987 |
| Kinematic viscosity, ν | m2 s-1 | 1.8072×10⁻⁵ | Magee and Branshurg, 1995 |
| Thermal diffusivity, α | m2 s-1 | 1.28×10⁻⁶ | Magee and Branshurg, 1995 |
| Air density, ρ | kg m-3 | 1.28 | Dowdy and Karabash, 1987 |
| Lewis number, Le | - | 1 | Heidarinejad et al., 2010 |
| Area, A | m2 | 10 | |
| Pad thickness, L | M | 0.15 | |
| Ambient temperature | °C | 25, 30, 35 and 40 | |
| Humidity ratio | kg kgv | 0.1, 0.2, 0.3 and 0.4 | |
| Inlet air velocity | m s-1 | 1.5, 3, 4.5 and 6 | Riangvilaikul and Kumar, 2010 |
| Length of pads | M | 0.5, 1, 1.5 and 2 | Santos et al., 2013 |
Table 1: The parameters used in the heat and mass balance.
| Nomenclature | |
|---|---|
| ṁw mass flow rate of intake air, kg s-1 | α thermal diffusivity of the fluid, m2 s-1 |
| Cpm specific heat moist air, kJ kg-1°C-1 | hm mass transfer coefficient, kg m-2 s-1 |
| T air temperature at any time t, °C | ωsat,w saturated humidity ratio at the water |
| T∞ ambient temperature, °C | temperature, kg water kg-1dry air |
| hw heat transfer coefficient, W m-2°C-1 | V volume of the pad, m3 |
| Across section area, m2 | Le Lewis number, dimensionless |
| t time, s | εwb wet bulb effectiveness |
| CP specific heat of dry air, kJ kg-1°C-1 | εwb dew point effectiveness |
| ωhumidity ratio, kg water kg-1dry air | THI temperature-humidity index, °C |
| CV specific heat of water vapor, kJ kg-1°C-1 | Tdb dry-bulb temperature, °C |
| Lpad thickness, m | Twb wet-bulb temperature, °C |
| Vair velocity of the air, m s-1 | TP predicted temperature, °C |
| ν kinematic viscosity of the fluid, m2 s-1 | TM measured temperature, °C |
Table 2: Nomenclature.
The experiment was carried out at Sekem Company, Belbeies, El-Sharkia Governorate, Egypt.
Figure 2 illustrates the experimental setup. It shows the evaporative cooling system which consists of two extracting fans (single speed, belt driven, 138 cm diameter, 34000 m3 h-1 discharge and 2 hp power, Germany) were located on the leeward side of greenhouse (eastern direction).
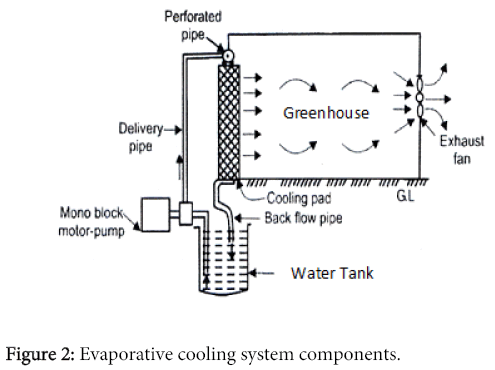
Figure 2: Evaporative cooling system components.
A fifteen cross-fluted cellulose pad plates were vertically placed in the opposite wall of the extracting fans (western direction) in the greenhouse. Each cellulose pad plate having a gross dimensions of 200 cm high, 60 cm wide and 10 cm thickness. A polyvinyl chloride pipe (PVC) 25.4 mm diameter and 9.0 m long was fixed on the middle above the cooling pads. Holes were drilled in a line about 5 cm apart along the top side of PVC pipe and the end of this pipe was capped. A baffle was placed above the water pipe to prevent any leaking of water from the cooling system. Sump (gutter) was situated underneath the cooling pads to collect the water and return it into the water tank (1000 liters capacity) from which it can be recycled to the cooling pads by a submersible water pump.
Temperature and relative humidity were recorded before and after the cooling pad using a HOBO Data Logger (Model HOBO U12 Temp/RH/Light – Range -20 to 70°C and 5 to 95% RH, USA) every ten minutes.
Model experimentation
Outlet temperature at different ambient temperatures and inlet air velocities: The outlet temperature at different ambient temperatures (25, 30, 35 and 40°C) and different inlet air velocities (1.5, 3, 4.5 and 6 m s-1) are shown in Figure 3. The results indicate that the outlet temperature increases with increasing ambient temperature and inlet air velocity. It also indicate that when the ambient temperature increased from 25 to 40°C, the out temperature increased from 21.06 to 33.01°C at 1.5 m s-1 air velocity, while it increased from 22.90 to 36.12°C at 6.0 m s-1 air velocity. It decreased from 25 to 21.06°C (15.77%) and 40 to 33.01°C (17.48%) at 25 and 40°C ambient temperature, respectively at 1.5 m s-1 air velocity, while it decreased from 25 to 22.90°C (8.40%) and 40 to 36.12°C (9.75%) at 25 and 40°C ambient temperature, respectively at 6.0 m s-1 air velocity. The lowest value of outlet temperature was 21.06°C at the ambient temperature 25°C with 1.5 m s-1 inlet air velocity and the highest value of outlet temperature was 36.12°C at the ambient temperature 40°C with 6.0 m s-1 inlet air velocity. It is concluded that the outlet air temperature is decreased when the intake air velocity is reduced. For the same inlet air velocity, the higher inlet humidity provides significantly larger increase of outlet air temperature [17]. The relevant results show that the system can provide the comfort condition when the inlet air velocity, temperature and humidity are maintained below 6m s-1, 34°C and 11.2 g kg-1, respectively [17,20].
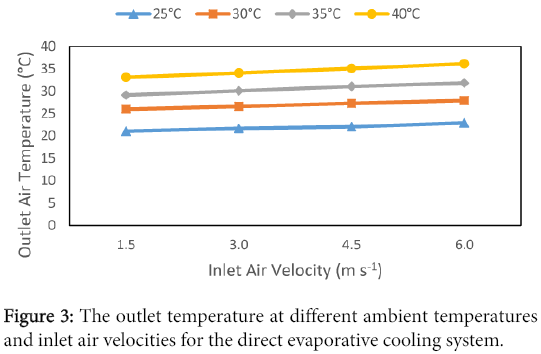
Figure 3: The outlet temperature at different ambient temperatures and inlet air velocities for the direct evaporative cooling system.
Outlet temperature at different ambient temperatures and humidity ratios: The outlet temperature at different ambient temperatures (25, 30, 35 and 40°C) and different humidity ratios (0.01, 0.02, 0.03 and 0.04 kg kg-1) are shown in Figure 4. The results indicate that the outlet temperature increases with increasing ambient temperature and humidity ratio for inlet air. It also indicate that when the ambient temperature increased from 25 to 40°C, the out temperature increased from 21.21 to 33.49°C at 0.01 kg kg-1 humidity ratio, while it increased from 22.99 to 36.09°C at 0.04 kg kg-1 humidity ratio. It decreased from 25 to 21.21°C (15.16%) and 40 to 33.49°C (16.28%) at 25 and 40°C ambient temperature, respectively at 0.01 kg kg-1 humidity ratio, while it decreased from 25 to 22.99°C (8.04%) and 40 to 36.09°C (8.78%) at 25 and 40°C ambient temperature, respectively at 0.04 kg kg-1 humidity ratio.
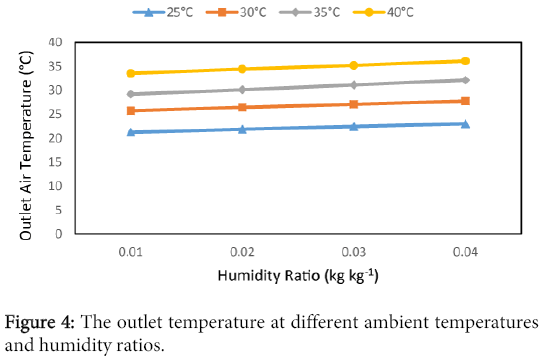
Figure 4: The outlet temperature at different ambient temperatures and humidity ratios.
The lowest value of outlet temperature was 21.21°C at the ambient temperature 25°C with 0.01 kg kg-1 humidity ratio and the highest value of outlet temperature was 36.09°C at the ambient temperature 40°C with 0.04 kg kg-1 humidity ratio. These results agreed with those obtained by Riangvilaikul, Kumar [17], Naphon [20].
Outlet temperature at different ambient temperatures and lengths of pad: The outlet temperature at different ambient temperatures (25, 30, 35 and 40°C) and different lengths of pad (0.5, 1.0, 1.5 and 2.0 m) are shown in Figure 5. The results indicate that the outlet temperature increases with increasing ambient temperature and length of pad. It also indicate that when the ambient temperature increased from 25 to 40°C, the out temperature increased from 21.09 to 33.32°C at 0.5 m length of pad, while it increased from 23.02 to 36.17°C at 2.0 m length of pad. It decreased from 25 to 21.09°C (15.64%) and 40 to 33.32°C (16.70%) at 25 and 40°C ambient temperature, respectively at 0.5 m length of pad, while it decreased from 25 to 23.02°C (7.92%) and 40 to 36.17°C (9.78%) at 25 and 40°C ambient temperature, respectively at 2.0 m length of pad. The lowest value of outlet temperature was 21.09°C at the ambient temperature 25°C with 0.5 m length of pad and the highest value of outlet temperature was 36.17°C at the ambient temperature 40°C with 2.0 m length of pad. These results agreed with those obtained by [26].
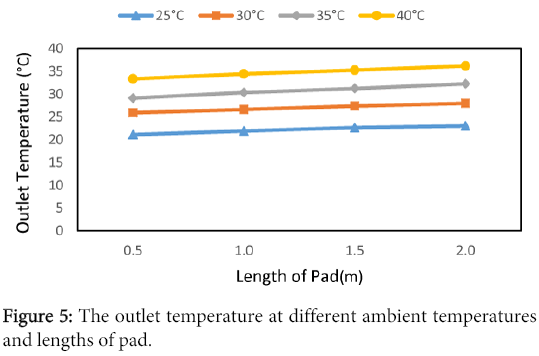
Figure 5: The outlet temperature at different ambient temperatures and lengths of pad.
Wet bulb effectiveness at different ambient temperatures and inlet air velocities: The wet bulb effectiveness at different ambient temperatures (25, 30, 35 and 40°C) and different inlet air velocities (1.5, 3, 4.5 and 6 m s-1) are shown in Figure 6. The results indicate that the wet bulb effectiveness increases with increasing ambient temperature and decreasing inlet air velocity. It also indicate that when the ambient temperature increased from 25 to 40°C, the wet bulb effectiveness increased from 0.963 to 1.163 (17.20%) at 1.5 m s-1 air velocity, while it increased from 0.878 to 0.997 (11.94%) at 6.0 m s-1 air velocity. The lowest value of wet bulb effectiveness was 0.878 at the ambient temperature 25°C with 6.0 m s-1 inlet air velocity and the highest value of wet bulb effectiveness was 1.163 at the ambient temperature 40°C with 1.5 m s-1 inlet air velocity. The performance of the cooler under different inlet velocities. The cooling effectiveness of the cooler with installed ribs is effectively increased compared to the plain channel. When the inlet velocity is more than 1.5 m s-1, the wet bulb effectiveness would increase by 10 - 20% for the cooler [27].
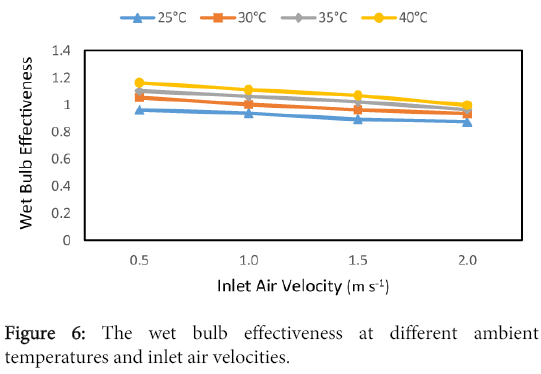
Figure 6: The wet bulb effectiveness at different ambient temperatures and inlet air velocities.
Wet bulb effectiveness at different ambient temperatures and humidity ratios: The wet bulb effectiveness at different ambient temperatures (25, 30, 35 and 40°C) and different humidity ratios (0.01, 0.02, 0.03 and 0.04 kg kg-1) are shown in Figure 7. The results indicate that the wet bulb effectiveness increases with increasing ambient temperature and decreasing humidity ratio. It also indicate that when the ambient temperature increased from 25 to 40°C, the wet bulb effectiveness increased from 0.985 to 1.172 (15.96%) at 0.01 kg kg-1 humidity ratio, while it increased from 0.894 to 1.001 (10.69%) at 0.04 kg kg-1 humidity ratio. The lowest value of wet bulb effectiveness was 0.894 at the ambient temperature 25°C with 0.04 kg kg-1 humidity ratio and the highest value of wet bulb effectiveness was 1.172 at the ambient temperature 40°C with 0.01 kg kg-1 humidity ratio. These results agreed with those obtained by Riangvilaikul, Kumar [17], Cui X, et al. [27].
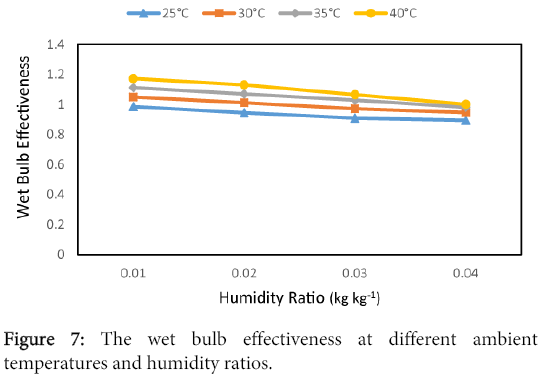
Figure 7: The wet bulb effectiveness at different ambient temperatures and humidity ratios.
Wet bulb effectiveness at different ambient temperatures and lengths of pad: The wet bulb effectiveness at different ambient temperatures (25, 30, 35 and 40°C) and different lengths of pad (0.5, 1.0, 1.5 and 2.0 m) are shown in Figure 8. The results indicate that the wet bulb effectiveness increases with increasing ambient temperature and decreasing lengths of pad.
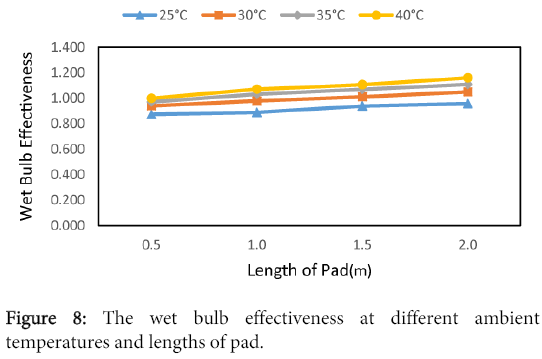
Figure 8: The wet bulb effectiveness at different ambient temperatures and lengths of pad.
It also indicate that when the ambient temperature increased from 25 to 40°C, the wet bulb effectiveness increased from 0.873 to 0.999 (12.61%) at 0.5 m length of pad, while it increased from 0.953 to 1.159 (17.77%) at 2.0 m length of pad. The lowest value of wet bulb effectiveness was 0.873 at the ambient temperature 25°C with 0.5 m length of pad and the highest value of wet bulb effectiveness was 1.159 at the ambient temperature 40°C with 2.0 m length of pad. These results agreed with those obtained by Santos et al. [26].
Dew point effectiveness at different ambient temperatures and inlet air velocities: The dew point effectiveness at different ambient temperatures (25, 30, 35 and 40°C) and different inlet air velocities (1.5, 3, 4.5 and 6 m s-1) are shown in Figure 9. The results indicate that the dew point effectiveness increases with increasing ambient temperature and decreasing inlet air velocity.

Figure 9: The dew point effectiveness at different ambient temperatures and inlet air velocities.
It also indicate that when the ambient temperature increased from 25 to 40°C, the dew point effectiveness increased from 0.599 to 0.792 (24.37%) at 1.5 m s-1 air velocity, while it increased from 0.535 to 0.688 (22.24%) at 6.0 m s-1 air velocity. The lowest value of dew point effectiveness was 0.535 at the ambient temperature 25°C with 6.0 m s-1 inlet air velocity and the highest value of dew point effectiveness was 0.792 at the ambient temperature 40°C with 1.5 m s-1 inlet air velocity.
Dew point effectiveness at different ambient temperatures and humidity ratios: The dew point effectiveness at different ambient temperatures (25, 30, 35 and 40°C) and different humidity ratios (0.01, 0.02, 0.03 and 0.04 kg kg-1) are shown in Figure 10. The results indicate that the dew point effectiveness increases with increasing ambient temperature and decreasing humidity ratio. It also indicate that when the ambient temperature increased from 25 to 40°C, the dew point effectiveness increased from 0.589 to 0.801 (26.47%) at 0.01 kg kg-1 humidity ratio, while it increased from 0.528 to 0.702 (24.79%) at 0.04 kg kg-1 humidity ratio. The lowest value of dew point effectiveness was 0.528 at the ambient temperature 25°C with 0.04 kg kg-1 humidity ratio and the highest value of dew point effectiveness was 0.801 at the ambient temperature 40°C with 0.01 kg kg-1 humidity ratio. The evaporative cooling is able to cool air to the temperature below and the dew point effectiveness spans 0.81 – 0.93, when the inlet air temperature was varied from 25 to 40°C and the humidity ratio was varied from 8 to 20 g kg-1. The inlet air velocity was kept as 1 m s-1. Other parameters were under pre-set conditions [27].
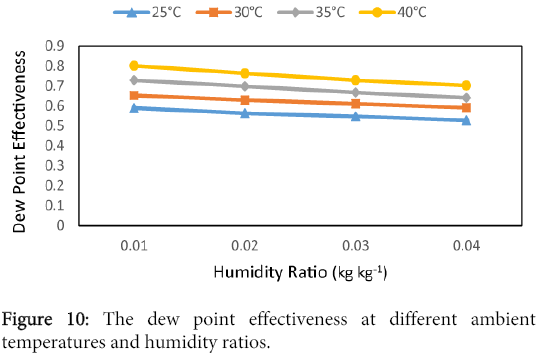
Figure 10: The dew point effectiveness at different ambient temperatures and humidity ratios.
Dew point effectiveness at different ambient temperatures and lengths of pad: The dew point effectiveness at different ambient temperatures (25, 30, 35 and 40°C) and different lengths of pad (0.5, 1.0, 1.5 and 2.0 m) are shown in Figure 11. The results indicate that the dew point effectiveness increases with increasing ambient temperature and decreasing length of pad. It also indicate that when the ambient temperature increased from 25 to 40°C, the dew point effectiveness increased from 0.533 to 0.704 (24.29%) at 0.5 m length of pad, while it increased from 0.586 to 0.800 (26.75%) at 2.0 m length of pad. The lowest value of dew point effectiveness was 0.533 at the ambient temperature 25°C with 0.5 m length of pad and the highest value of dew point effectiveness was 0.80 at the ambient temperature 40°C with 2.0 m length of pad.
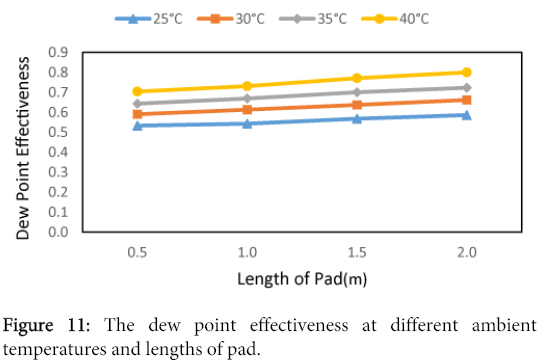
Figure 11: The dew point effectiveness at different ambient temperatures and lengths of pad.
Humidity ratio at different ambient temperatures and inlet air velocities: The humidity ratio at different ambient temperatures (25, 30, 35 and 40°C) and different inlet air velocities (1.5, 3, 4.5 and 6 m s-1) are shown in Figure 12. The results indicate that the humidity ratio increases with increasing ambient temperature and inlet air velocity. It also indicate that when the ambient temperature increased from 25 to 40°C, the humidity ratio increased from 0.027 to 0.038 kg kg-1 (28.95%) at 1.5 m s-1 air velocity, while it increased from 0.024 to 0.031 kg kg-1 (22.58%) at 6.0 m s-1 air velocity. The lowest value of humidity ratio was 0.027 kg kg-1 at the ambient temperature 25°C with 1.5 m s-1 inlet air velocity and the highest value of humidity ratio was 0.038 kg kg-1 at the ambient temperature 40°C with 6.0 m s-1 inlet air velocity. These results agreed with those obtained by Zhan et al. [15] whose found the humidity ratio increased with increasing the inlet air temperature.
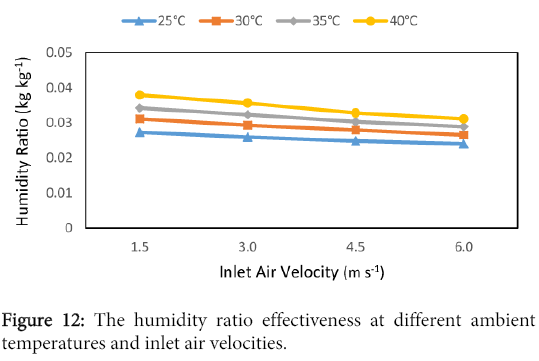
Figure 12: The humidity ratio effectiveness at different ambient temperatures and inlet air velocities.
Humidity ratio at different ambient temperatures and humidity ratios: The humidity ratio at different ambient temperatures (25, 30, 35 and 40°C) and different humidity ratios (0.01, 0.02, 0.03 and 0.04 kg kg-1) are shown in Figure 13. The results indicate that the humidity ratio increases with increasing ambient temperature and humidity ratio for inlet air. It also indicate that when the ambient temperature increased from 25 to 40°C, the humidity ratio increased from 0.014 to 0.019 kg kg-1 (26.32%) at 0.01 kg kg-1 humidity ratio, while it increased from 0.048 to 0.055 kg kg-1 (12.73%) at 0.04 kg kg-1 humidity ratio. The lowest value of humidity ratio was 0.014 kg kg-1 at the ambient temperature 25°C with 0.01 kg kg-1 humidity ratio and the highest value of humidity ratio was 0.055 kg kg-1 at the ambient temperature 40°C with 0.04 kg kg-1 humidity ratio.
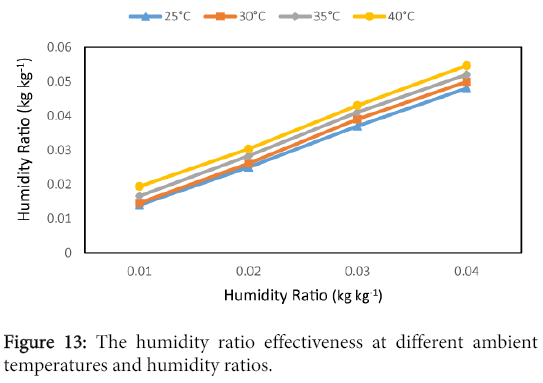
Figure 13: The humidity ratio effectiveness at different ambient temperatures and humidity ratios.
Humidity ratio at different ambient temperatures and lengths of pad: The humidity ratio at different ambient temperatures (25, 30, 35 and 40°C) and different lengths of pad (0.5, 1.0, 1.5 and 2.0 m) are shown in Figure 14. The results indicate that the humidity ratio increases with increasing ambient temperature and length of pad. It also indicate that when the ambient temperature increased from 25 to 40°C, the humidity ratio increased from 0.023 to 0.031 kg kg-1 (25.81%) at 0.5 m length of pad, while it increased from 0.028 to 0.038 kg kg-1 (26.32%) at 2.0 m length of pad. The lowest value of humidity ratio was 0.023 kg kg-1 at the ambient temperature 25°C with 0.5 m length of pad and the highest value of humidity ratio was 0.038 kg kg-1 at the ambient temperature 40°C with 2.0 m length of pad.
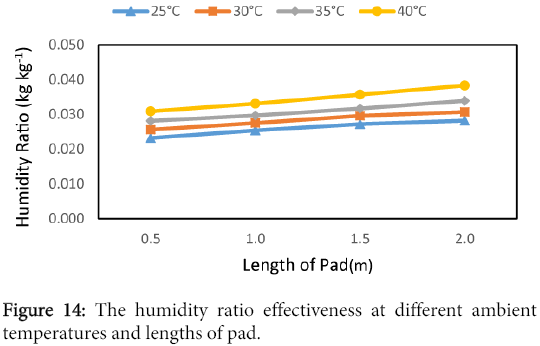
Figure 14: The humidity ratio effectiveness at different ambient temperatures and lengths of pad.
Temperature-humidity index (THI) at different ambient temperatures and inlet air velocities: The temperature-humidity index at different ambient temperatures (25, 30, 35 and 40°C) and different inlet air velocities (1.5, 3, 4.5 and 6 m s-1) are shown in Figure 15. The results indicate that the temperature-humidity index increases with increasing ambient temperature and inlet air velocity. It also indicate that when the ambient temperature increased from 25 to 40°C, the temperature-humidity index increased from 20.23 to 31.47°C (35.17%) at 1.5 m s-1 air velocity, while it increased from 21.84 to 35.68°C (38.79%) at 6.0 m s-1 air velocity. The lowest value of temperature-humidity index was 20.23°C at the ambient temperature 25°C with 1.5 m s-1 inlet air velocity and the highest value of temperature-humidity index was 35.68°C at the ambient temperature 40°C with 6.0 m s-1 inlet air velocity.
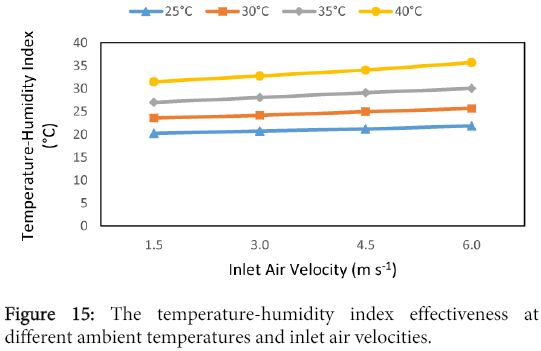
Figure 15: The temperature-humidity index effectiveness at different ambient temperatures and inlet air velocities.
Temperature-humidity index (THI) at different ambient temperatures and humidity ratios: The temperature-humidity index at different ambient temperatures (25, 30, 35 and 40°C) and different humidity ratios (0.01, 0.02, 0.03 and 0.04 kg kg-1) are shown in Figure 16. The results indicate that the temperature-humidity index increases with increasing ambient temperature and humidity ratio. It also indicate that when the ambient temperature increased from 25 to 40°C, the temperature-humidity index increased from 20.27 to 31.70°C (36.06%) at 0.01 kg kg-1 humidity ratio, while it increased from 22.01 to 35.51°C (38.02%) at 0.04 kg kg-1 humidity ratio. The lowest value of temperature-humidity index was 20.27°C at the ambient temperature 25°C with 0.01 kg kg-1 humidity ratio and the highest value of temperature-humidity index was 35.51°C at the ambient temperature 40°C with 0.04 kg kg-1 humidity ratio.
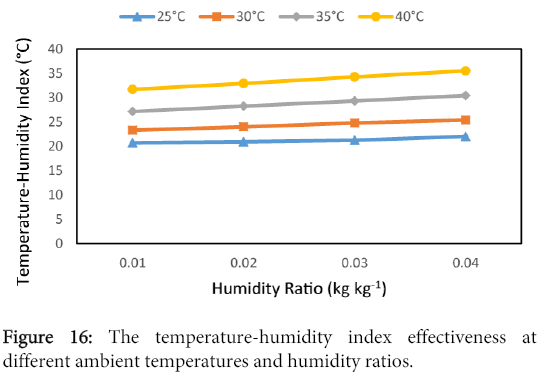
Figure 16: The temperature-humidity index effectiveness at different ambient temperatures and humidity ratios.
Temperature-humidity index (THI) at different ambient temperatures and lengths of pad: The temperature-humidity index at different ambient temperatures (25, 30, 35 and 40°C) and different lengths of pad (0.5, 1.0, 1.5 and 2.0 m) are shown in Figure 17. The results indicate that the temperature-humidity index increases with increasing ambient temperature and length of pad. It also indicate that when the ambient temperature increased from 25 to 40°C, the temperature-humidity index increased from 20.66 to 31.62°C (34.66%) at 0.5 m length of pad, while it increased from 21.99 to 35.72°C (38.44%) at 2.0 m length of pad. The lowest value of temperature-humidity index was 20.99°C at the ambient temperature 25°C with 0.5 m length of pad and the highest value of temperature-humidity index was 35.72°C at the ambient temperature 40°C with 2.0 m length of pad.
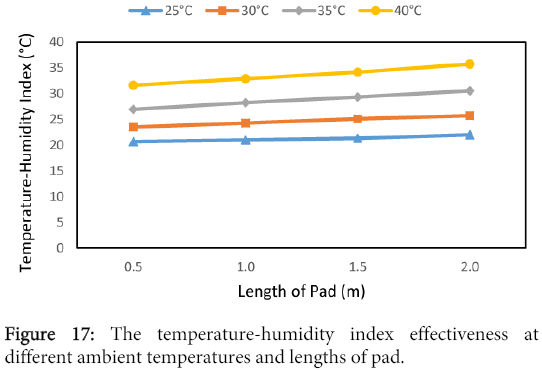
Figure 17: The temperature-humidity index effectiveness at different ambient temperatures and lengths of pad.
Model validation
Figure 18 shows the predicted and the measured outlet temperatures of evaporative cooling system. It could be seen that, the predicted outlet temperatures were in a reasonable agreement with those measured, where, it ranged 17.027 to 29.978°C theoretically while it was from 19.605 to 30.748°C experimentally.
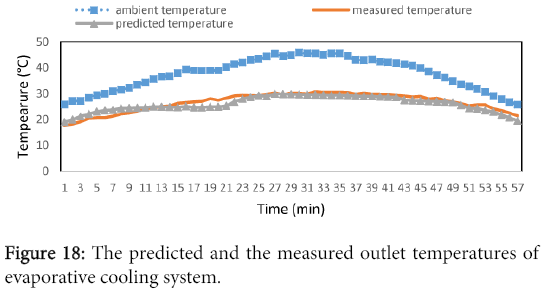
Figure 18: The predicted and the measured outlet temperatures of evaporative cooling system.
Regression analysis was carried out to find a relationship between the predicted and measured outlet temperatures and the most suitable form is shown as follows Figure 19:
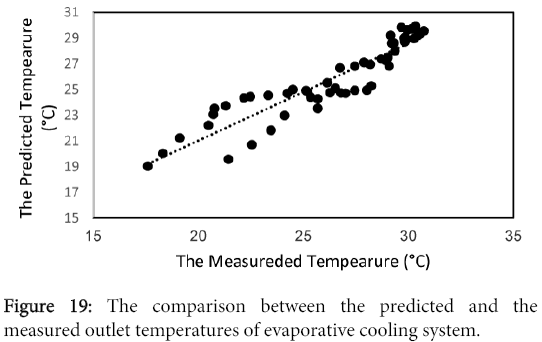
Figure 19: The comparison between the predicted and the measured outlet temperatures of evaporative cooling system.
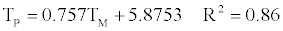 (13)
(13)
The coefficient of determination for the equation was 0.86. Data used in preparing the equation ranged from 25 to 40°C for ambient air temperature, from 1.5 to 6 m s-1 for inlet air velocity, from 0.01 to 0.04 kg kg-1 for ambient air humidity and from 0.5 to 2.0 m for length of pad. The average relative percentage of prediction errors is – 1.712 ± 2.514 %. The prediction of temperature determines the optimum condition of plant growth in greenhouse, so that the model helps this optimization.
A mathematical model for the direct evaporative cooling system was developed successively according to heat balance to optimize the main factors affecting the performance of evaporative cooling system through studying of outlet temperature, humidity ratio, wet bulb effectiveness, dew point effectiveness and temperature-humidity index at different ambient temperatures, inlet air velocities, humidity ratios and lengths of pad. Also, carrying out an experiment to validate the model results through measuring: outlet temperature. The most important results obtained can be summarized as follows:
The average outlet temperature increased from 22.07 to 34.72°C with increasing ambient temperature from 25 to 40°C, while it increased from 27.31 to 29.68°C with increasing inlet air velocity from 1.5 to 6.0 m s-1. It increased from 27.39 to 29.72°C with increasing humidity ratio from 0.01 to 0.04 kg kg-1, and from 27.35 to 29.85°C with increasing length of pad from 0.5 to 2.0 m.
The average wet bulb effectiveness increased from 0.927 to 1.086 with increasing ambient temperature from 25 to 40°C. On the other hand, it decreased from 1.075 to 0.953 with increasing inlet air velocity from 1.5 to 6.0 m s-1, while it decreased from 1.079 to 0.961 with increasing humidity ratio from 0.01 to 0.04 kg kg-1. The wet bulb effectiveness increased from 0.951 to 1.074 with increasing length of pad from 0.5 to 2.0 m.
The average dew point effectiveness increased from 0.561 to 0.747 with increasing ambient temperature from 25 to 40°C. On the other hand, it decreased from 0.695 to 0.613 with increasing inlet air velocity from 1.5 to 6.0 m s-1, while it decreased from 0.690 to 0.615 with increasing humidity ratio from 0.01 to 0.04 kg kg-1. The dew point effectiveness increased from 0.619 to 0.693 with increasing length of pad from 0.5 to 2.0 m.
The average humidity ratio increased from 0.027 to 0.035 kg kg-1 with increasing ambient temperature from 25 to 40°C, while it increased from 0.025 to 0.034 kg kg-1 with increasing inlet air velocity from 1.5 to 6.0 m s-1. It increased from 0.031 to 0.037 kg kg-1 with increasing humidity ratio from 0.01 to 0.04 kg kg-1 and from 0.026 to 0.034 kg kg-1 with increasing length of pad from 0.5 to 2.0 m.
The average temperature-humidity index increased from 21.15 to 33.56°C with increasing ambient temperature from 25 to 40°C, while it increased from 25.57 to 28.29°C with increasing inlet air velocity from 1.5 to 6.0 m s-1. It increased from 25.72 to 28.34°C with increasing humidity ratio from 0.01 to 0.04 kg kg-1 and from 25.67 to 28.48°C with increasing length of pad from 0.5 to 2.0 m.
The predicted outlet temperature was in a reasonable agreement with the measured ones with a coefficient of determination of 0.86, where. It ranged from 17.027 to 29.978°C, while the measured outlet temperature ranged from 19.605 to 30.748°C. The prediction of temperature determines the optimum condition of plant growth in greenhouse, so that the model helps this optimization.
