Research Article - (2015) Volume 3, Issue 4
In this paper, we present principal component analysis (PCA) results from a dataset containing 494 cannabis flower samples and 170 concentrate samples analyzed for 31 compounds. A continuum of chemical composition amongst cannabis strains was found instead of distinct chemotypes. Our data shows that some strains are much more reproducible in chemical composition than others. Strains labeled as indica were compared with those labeled as sativa and no evidence was found that these two cultivars are distinctly different chemotypes. PCA of “OG” and “Kush” type strains found that “OG” strains have relatively higher levels of α-terpineol, fenchol, limonene, camphene, terpinolene and linalool where “Kush” samples are characterized mainly by the compounds trans-ocimene, guaiol, β-eudesmol, myrcene and α-pinene. The composition of concentrates and flowers were compared as well. Although the absolute concentration of compounds in concentrates is much higher, the relative composition of compounds between flowers and concentrates is similar.
Keywords: Cannabis; Tetrahydrocannabinol; Cannabidiol; Marijuana; Terpenoids; Terpenes; Strains; Taxonomy
Cannabis has been used for medicinal and recreational purposes for millennia. From a taxonomic perspective scientists have been debating the presence of multiple species for quite some time. Some scientist delineates 3 species, C. sativa (hemp type), C. indica (drug type) and C. ruderalis (wild type), where others see this as just a variety of 1 species and associated subspecies thereunder [1-4]. This distinction is exceptionally important as most US States new laws consider Cannabis sativa L. and subspecies as the only legal cultivars allowed.
It is commonly accepted in cannabis culture to make the distinction between sativa and indica strains [5]. Indica plants are said to be short, densely branched and have wider leaves and are claimed to be sedative and good for pain relief. Sativa plants are tall, loosely branched and have long, narrow leaves. Sativa is claimed to be uplifting, stimulating and recommended for daytime use. This is the typical information a patient or recreational user will hear when they visit a medicinal cannabis dispensary or recreational store. However, we only found one published study that compared indica and sativa strains in patients [6]. This study showed that cannabis was uniformly effective in relieving symptoms across a wide range of diagnostic categories. Indica strains appeared superior to sativa strains in improving energy and appetite. No statistical difference between sativa and indica was found for pain, mood, nausea, muscle spasms, seizures, ocular issues, insomnia, awareness or neuropathy. Strains were assigned based upon morphology. This study was not blinded and the observed differences could be a result of expectations by the patient.If sativa and indica truly have different physiological effects upon consumption, some compound or interaction of compounds need to be responsible for this. It has been shown that cannabidiol (CBD) can influence the psychoactive effects of Δ9-tetrahydrocannabinol (THC) [7] and it has been postulated that the combination of phytocannabinoids and terpenes could result in complementary or synergistic results often referred to as the “entourage effect” [8]. In this paper we use PCA to investigate the analytical results for cannabinoids and terpenes in 494 cannabis flower samples and 170 cannabis concentrates. This analysis was performed in an attempt to investigate the potential existence of distinct cannabis chemotypes that could explain the different effects people experience from specific cannabis strains. Cannabinoids and terpenes were chosen as chemotype markers as they are considered to be the main physiologically active constituents in cannabis. Researchers have looked at cannabis from a chemotaxonomic perspective as well. Small and Beckstead split C. sativa L. into three chemotypes based upon CBD/THC ratio [4]. Type 1 has a CBD/THC ratio of <0.5, type II has an intermediate CBD/THC ratio of 0.5-3.0 and type 3 has a ratio of >3.0. DeMeijer et al showed that this could be explained genetically by a model involving one locus, with two alleles. One allele codes for CBDA synthase where the other codes for THCA synthase. The alleles where shown to be co-dominant [9]. Pacifico et al later showed that classification using just the CBD/ THC values will mask the existence of chemotypes with relatively high amounts of other cannabinoids [10]. Various authors have tried using the secondary metabolites in combination with PCA for forensic investigation of the geographical origin of the plant material [11-13]. The most elaborate study was performed by El Sohly et al who analyzed 157 samples from six geographical regions and classified them using statistical analysis of 175 GC/MS peaks. Although they managed to differentiate samples from different countries the success of this approach was limited as not only geographical location but many other cultivation variables influenced the chemical composition of the flowers. Much of the cannabis available in the western world is grown indoors often with strict control of variables. The use of controlled lighting cycles, specialized soil, fine-tuned nutrients and pest control eliminate many of the environmental variables and will make geographical assigning of the plant difficult if not impossible. Fischedick et al analyzed 11 cultivars of cannabis for 36 compounds and managed to discriminate the various cultivars with PCA [14]. Higher levels of cannabinoids correlated positively to higher levels of terpenoids (R2=0.7688). The authors of this paper showed that it is possible to grow cannabis with reproducible terpene and cannabinoid levels over different batches as long as environmental conditions and genetics are standardized. Alterations in grow cycle time, plant stress and different genotype can cause considerable differences in the chemical profile.
A study by Casano et al investigated the variability of terpene profiles in 16 plants from different strains of C. sativa L. [15]. They separated the samples into ‘mostly indica’ and ‘mostly sativa’ based upon the morphological appearance declared by cultivators of the strain. The study showed a large variation of relative content of terpenes between strains and suggests that terpene variation can be used as a tool for characterization of cannabis bio types. In this study ‘mostly indica’ strains were characterized by dominancy of β-myrcene with limonene or α-pinene as the second most abundant terpenes. The ‘mostly sativa’ strains were characterized by more complex terpene profiles, with some strains having α-terpinolene or α-pinene as dominant, and some strains having β-myrcene as dominant with α-terpinolene or trans-β-ocimene as second most abundant.To our knowledge this is the first paper reporting chemo typical differences using samples that are available to patients in the chemotypical medicinal cannabis dispensaries. Most of the previous papers use samples collected worldwide and based upon their reported cannabinoid levels, are not representative of the cannabis currently available in the United States to patients and recreational users. It is important to note that doctors often specifically recommend an indica or sativa strain to their patient, but that the scientific literature is lacking evidence to support these recommendations. In this paper we will take a PCA approach to investigate the variation between strains in the California medicinal marijuana market and also specifically look at the differences in composition between indica and sativa strains.
Chemicals
Methanol and water of analytical grade as well as terpene reference standards were purchased from Sigma Aldrich, St. Louis, MO, USA. Analytical standards for the cannabinoids were acquired from Restek, Bellefonte, PA, USA.
Origin of samples
The samples used for this study have been submitted for analysis to our laboratory by California medicinal marijuana patients in the period from the beginning of 2012 to the end of 2013. The strain names for the samples were the names reported by the submitter at the time of submission.
Statistical analyses
Strains where classified as indica, sativa, hybrid or unknown based upon the assignment by the cannabis strain database website Leafly. com on June 11, 2015. For concentrates, the whole data set was used and divided into three categories (high, medium, low CBD). All data was modulated to express the various compounds as the contribution to the sum of compounds.
PCA analysis was performed in excel using a macro written by Tsugawa et al. and is available for free [16] (http://prime.psc.riken.jp/Metabol omics Software/Statistical Analysis On Microsoft Excel/). When scaling was performed the option “auto scale” was selected.
Analytical measurements
Quantification of THC, CBD, cannabigerol (CBG), Δ9- tetrahydrocannabinolic acid (THCA), cannabidiolic acid (CBDA) and cannabigerolic acid (CBGA) was performed using a Shimadzu prominence UFLC system (Shimadzu Scientific Instruments, Columbia, MD, USA). The acidic analytical method as published by Hazekamp et al. was used [17]. Calculation of THCmax, CBDmax and CBGmax were performed as described in our previous paper [18]. Terpene content was determined using GC-FID according to the same approach as Fischedick et al using retention time comparison with authentic reference, mass spectra, and literature data [14]. A 5% diphenyl and 95% dimethyl polysiloxane column (SHRX5, 15 m, 0.25 mm ID, 0.25 μm film thickness, Shimadzu Scientific Instruments, Columbia, MD, USA) and helium carrier gas (Airgas, Radnor, PA, USA) was used for separation. Table 1 lists the terpenes that were analyzed in each sample.
| Analyzed Terpenes | |||
|---|---|---|---|
| α-Bisabolol | α-Cedrene | Limonene | α-Phelladerene |
| Borneol | β-Eudesmol | Linalool | α-Pinene |
| Camphene | (+) Fenchol | Menthol | β-Pinene |
| Camphor | Geraniol | Myrcene | Sabinene |
| Δ3-Carene | Guaiol | Nerol | α-Terpinene |
| β-Caryophyllene | α-Humulene | cis-Ocimene | α-terpineol |
| Caryophyllene oxide | Isoborneol | trans-Ocimene | Terpinolene |
Table 1: The terpenes analyzed.
Description of flower data set
The dataset contained 494 samples. At least 8 different samples were present for each uniquely identifiable strain. A total of 35 different strains where present in the dataset. Table 2 shows the number of replicates for each strain and the average, minimum and maximum THCmax concentration found in the samples. It can be noticed that the THCmax levels can vary widely even within one strain. In 14 out of 35 strains the difference between the minimum and maximum level found differed by more than a factor of 2 and in the highest case (OG Kush) by more than a factor of 5. This indicates that it will be exceptionally hard to predict the potency of a flower product based solely upon the strain name
| Strain Name | Replicates | Indica/Sativa/Hybrid or Unknown | OG or Kush | THCmax(%) | ||
|---|---|---|---|---|---|---|
| Average | Min | Max | ||||
| 1st Generation Diablo | 16 | Indica | - | 20.8 | 16.2 | 24.2 |
| Afghan Kush | 10 | Indica | Kush | 17.6 | 14.7 | 22.0 |
| Alien OG | 8 | Hybrid | OG | 19.7 | 14.6 | 23.8 |
| Black Mamba | 9 | Indica | - | 21.0 | 19.4 | 22.8 |
| Blackberry Kush | 11 | Indica | Kush | 15.9 | 12.5 | 18.0 |
| Blue Dream | 31 | Hybrid | - | 16.9 | 12.2 | 21.2 |
| Blue Dream Haze | 9 | Hybrid | - | 17.4 | 13.6 | 21.0 |
| Bubba Kush | 9 | Indica | Kush | 15.5 | 10.2 | 19.4 |
| ChemDawg | 14 | Hybrid | - | 16.9 | 11.2 | 23.1 |
| Fire OG | 23 | Hybrid | OG | 17.3 | 9.8 | 20.2 |
| Girl Scout Cookies | 19 | Hybrid | - | 15.7 | 5.8 | 20.9 |
| Grand Daddy Purple | 14 | Indica | - | 16.9 | 12.2 | 23.3 |
| Green Crack | 16 | Sativa | - | 15.4 | 11.0 | 19.1 |
| Harlequin | 15 | Sativa | - | 5.0 | 2.5 | 12.6 |
| Headband | 8 | Hybrid | - | 15.5 | 5.4 | 22.1 |
| Jack Herer | 24 | Sativa | - | 16.9 | 13.1 | 21.4 |
| LA Confidential | 17 | Indica | - | 15.1 | 8.9 | 21.7 |
| Larry OG | 8 | Hybrid | OG | 17.1 | 6.2 | 24.3 |
| Neptune OG | 10 | Indica | OG | 18.0 | 12.6 | 22.8 |
| NY Sour Diesel | 10 | Unknown | - | 15.9 | 10.8 | 20.2 |
| OG Herojuana | 11 | Unknown | OG | 18.6 | 15.3 | 20.7 |
| OG Kush | 28 | Hybrid | - | 16.4 | 4.9 | 25.0 |
| Platinum OG | 8 | Indica | OG | 18.3 | 15.6 | 21.4 |
| Pre '98 Bubba | 9 | Indica | - | 14.4 | 9.3 | 20.3 |
| Purple Kush | 8 | Indica | Kush | 13.9 | 3.8 | 18.8 |
| SFV OG | 12 | Hybrid | OG | 18.9 | 14.1 | 23.3 |
| Skywalker | 15 | Indica | - | 19.1 | 9.6 | 24.5 |
| Skywalker OG | 19 | Hybrid | OG | 18.5 | 13.8 | 21.7 |
| Sour Diesel | 32 | Sativa | - | 16.6 | 7.7 | 22.0 |
| Sour OG | 10 | Hybrid | OG | 18.0 | 14.1 | 24.1 |
| Strawberry Cough | 8 | Sativa | - | 15.3 | 8.7 | 18.1 |
| Tahoe OG | 14 | Hybrid | OG | 17.5 | 13.2 | 21.6 |
| Trainwreck | 16 | Hybrid | - | 14.0 | 5.9 | 19.8 |
| True OG | 13 | Indica | OG | 18.5 | 13.4 | 22.2 |
| Velvet Kush | 10 | Unknown | Kush | 21.6 | 20.0 | 23.1 |
Table 2: Summary of the cannabis flower data set.
Table 2 also shows the assignment to sativa, indica, hybrid or unknown. Thirteen (13) strains were assigned as indica, 5 where assigned as sativa and 14 as hybrid. Three (3) strains did not occur in the Leafly database that was used for the assignment.
Figure 1 shows the distribution of the THCmax (%) in the total data set. The average THCmax (%) in the data set was 16.8% and the median for THCmax was 17.1% the distribution was not Gaussian but showed three peaks. The first peak is at 4.5-5.49%, which correlates with low THCmax content in high CBD strains. The second peak is at 15.5-16.49 and the third peak is at 18.5-19.49%. Information regarding cultivation condition was not present, but it is speculated that these two peaks represent the averages for outdoor and indoor cultivation methods.
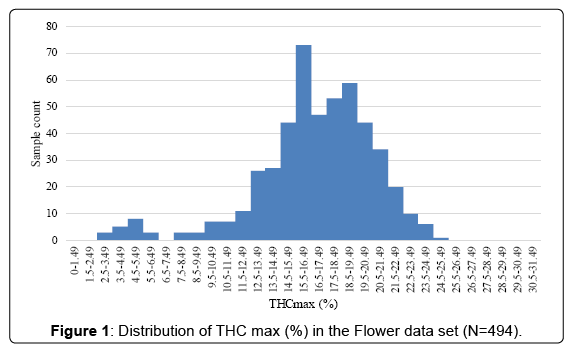
Figure 1: Distribution of THC max (%) in the Flower data set (N=494).
Figure 2 shows the distribution of the CBDmax (%) in the total data set. The Figure 2 shows that 478 out of 494 samples had less than 1.49% CBD indicating that the medicinal marijuana market in California is dominated by high THC type strains. The average CBDmax (%) in the data set was 0.6% and the median was 0.3%
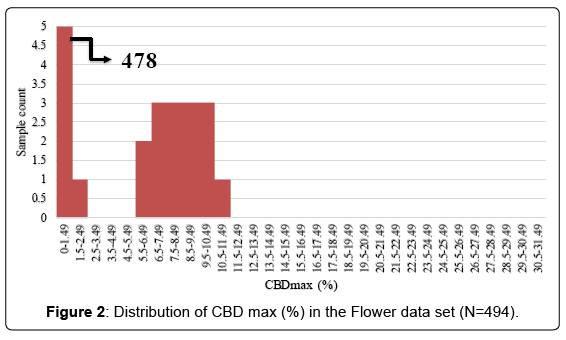
Figure 2: Distribution of CBD max (%) in the Flower data set (N=494).
The sum of terpenes was plotted against the sum of THCmax and CBDmax and a R2 value of 0.4248 which is lower than the correlation of 0.77 found by Fischedick et al. [14]. The graph can be found in supplementary information (Figure 1). This difference can be explained by the large variety of strains used in this study where the study by Fischedick was performed with a limited amount of strains grown and stored under standardized conditions. For statistical analysis all data was expressed as a contribution to the sum of all compounds. This modulation of the data was performed as it is our experience the relative ratios of terpenes in a strain are more reproducible than the absolute concentration for a strain. Supplementary information (Figure 2) shows the effect of this conversion for the 8 main terpenes in 10 different Velvet Kush samples. Absolute data shows more variation than the standardized data. This effect is likely a result of trichome density [19]. Part of the plant exposed to more light will have a higher density of trichomes. Also, during trimming of the dried female flowers more or less leafy material can be left behind influencing the absolute concentration as the trichomes are the cannabinoid and terpene producing parts of the plant. It was noted that many flowers had a name containing “OG” or “Kush”. Kush is a reference to strains originating from the Hindu Kush region in Central Asia. The origin of the term “OG” is unknown. To investigate if this term has any relationship based on the chemical composition of the plant matter, PCA analysis was performed comparing OG with Kush type strains. Eleven (11) strains were assigned to the OG group and 5 strains were assigned to the Kush group.
PCA analysis of complete flower data set
The full data set was analyzed without scaling and the scoring and loading plot can be found in (Figures 3 and 4). PC1 explained 86.3% of variance and PC2 explained 7.6%. Examination of the loading plot reveals cannabinoids are responsible for the differentiation of the samples. This is expected as the absolute concentration and variation of cannabinoids is much higher than that of the terpenes, therefore without scaling, the cannabinoids will dominate. A grouping of Harlequin (red), can be noticed. The loading plot indicates that these strains are differentiated due to a high CBDmax content. The original data showed that Harlequin is indeed a high CBD strain and fairly unique in this aspect. One OG Kush sample (purple) was mixed in with the Harlequin group and inspection revealed that this indeed was also a high CBD sample which was not characteristic of other OG Kush samples. The same data set was analyzed with scaling. The scoring and loading plot can be found in (Figures 5 and 6). PC1 explained 22.1% of variance while PC2 explained 12.5%. Again, a grouping of Harlequin (red) is observed and the loading plot reveals that relatively high quantities of CBD, α-pinene, guaiol and β-eudesmol are responsible for the separation in this plot. A second group is observed consisting of Trainwreck and Jack Herer. The loading plot reveals that this group is characterized by relatively high amounts of terpinolene, α-terpinene and α-phellandrene. It is worth noting that the monoterpenoid profiles of these strains were similar to strains described as ‘sativa’ in other studies [14,15,20]. Plotting of additional principal components did not reveal any new groupings. As Trainwreck, Jack Herer and Harlequin were very dominant in the separation, these strains were removed from the data set to see if additional groups could be detected. When scaled PCA was performed, PC1 explained 20.5% of the variation, PC2 explained 10.9%, PC3 8.7% and PC4 7.9%. The PC1 vs PC2 plot did not show any specific grouping but a general scattered plot of all the samples. In the PC1 vs PC3 plot a small cluster of Blue Dream could be noticed (Figure 7). This group showed only slight separation and was caused by the relatively high concentration of α-pinene in these samples (Figure 8). When PC1 vs PC4 is plotted a grouping of Green Crack can be noticed (Figure 9). This group differentiates itself due to relatively high amounts of CBGmax, cis-ocimene and trans-ocimene (Figure 10). No other groupings were noticed in any of the scoring plots.
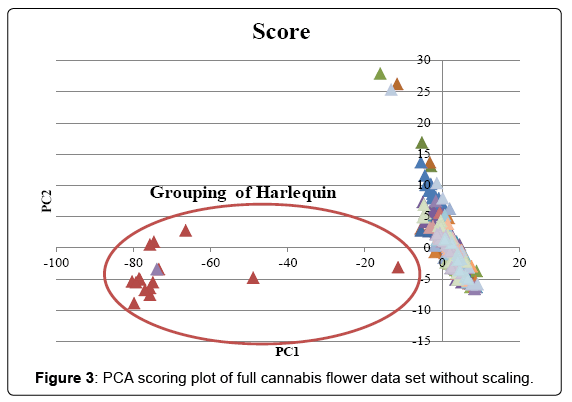
Figure 3: PCA scoring plot of full cannabis flower data set without scaling.
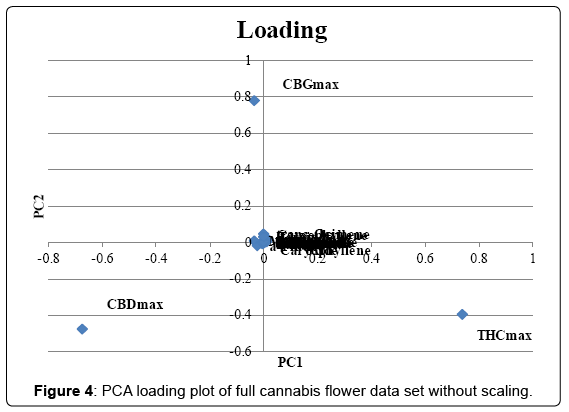
Figure 4: PCA loading plot of full cannabis flower data set without scaling.
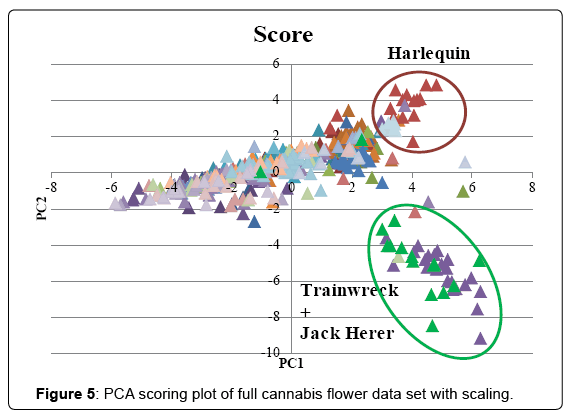
Figure 5: PCA scoring plot of full cannabis flower data set with scaling.
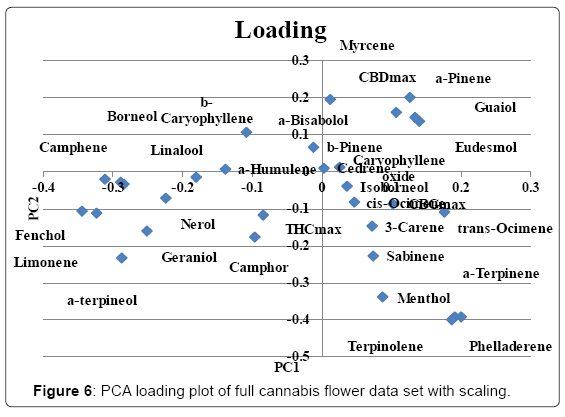
Figure 6: PCA loading plot of full cannabis flower data set with scaling.
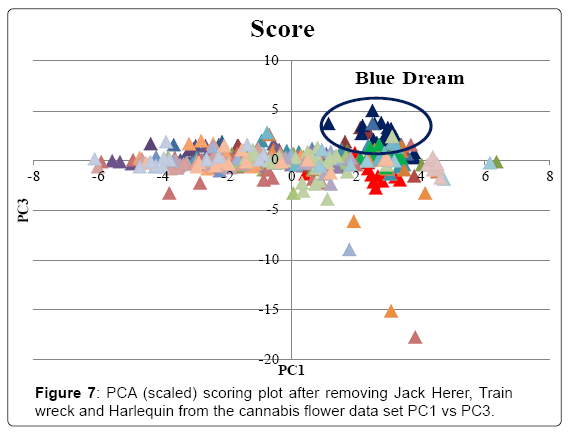
Figure 7: PCA (scaled) scoring plot after removing Jack Herer, Train wreck and Harlequin from the cannabis flower data set PC1 vs PC3.
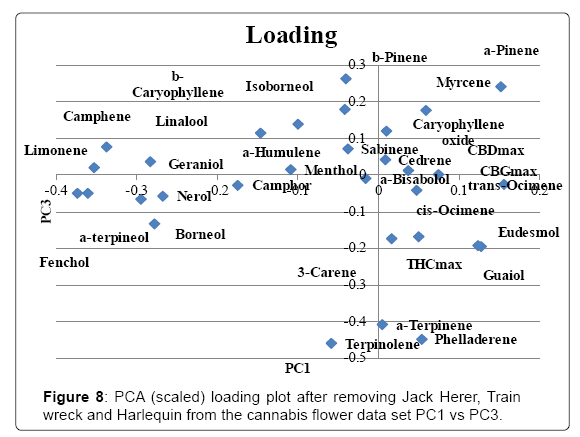
Figure 8: PCA (scaled) loading plot after removing Jack Herer, Train wreck and Harlequin from the cannabis flower data set PC1 vs PC3.
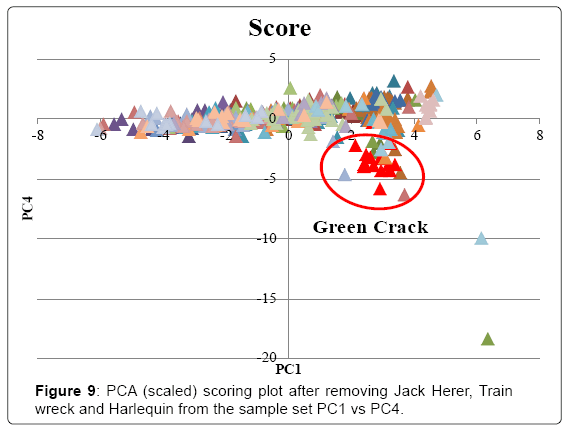
Figure 9: PCA (scaled) scoring plot after removing Jack Herer, Train wreck and Harlequin from the sample set PC1 vs PC4.
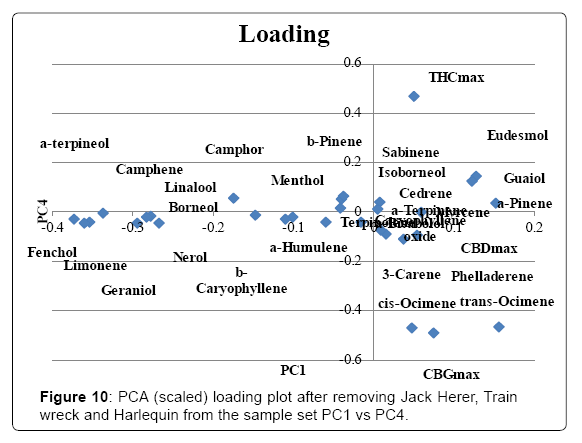
Figure 10: PCA (scaled) loading plot after removing Jack Herer, Train wreck and Harlequin from the sample set PC1 vs PC4.
All unknown and hybrid samples were removed from the data set and the remaining samples were categorized as either indica (blue) or sativa (red). Scaled PCA was performed and the scoring and loading plot can be found in (Figures 11 and 12). PC1 explained 30.2% and PC2 explained 9.2% of the variation. In the scoring plot a mix of indica and sativa samples can be noticed, but approximately half of the indica samples separate from the sativa samples. This group is dominant in the strains 1st Generation Diablo (1stGD), Black Mamba (BM), True OG (TruenOG), Neptune OG (NepOG) and Skywalker (SkyW). The loading plot reveals that this group has higher levels of limonene, fenchol, α-terpineol, camphene, linalool, THCmax, camphor, geraniol, β-pinene and β-caryophyllene.
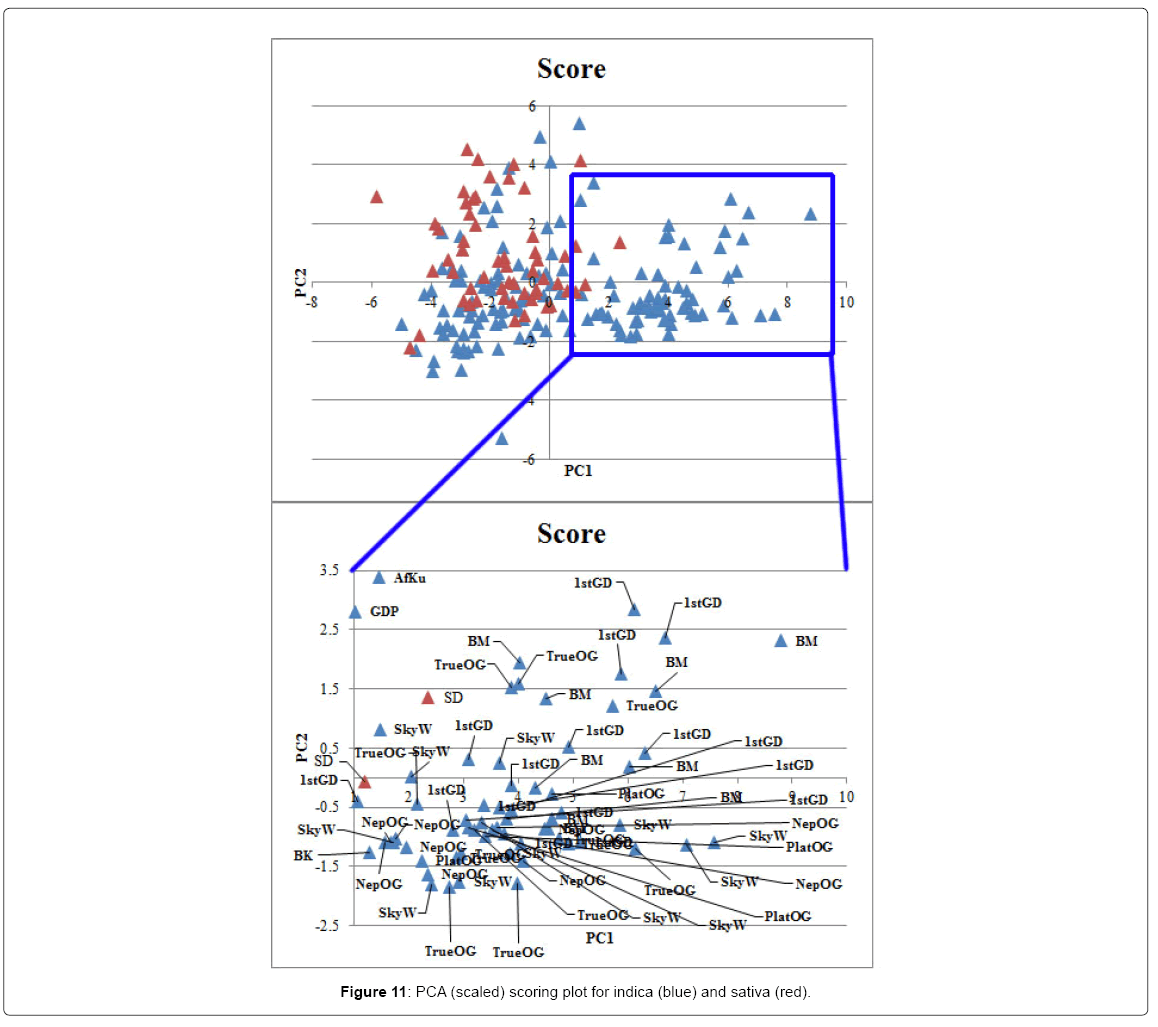
Figure 11: PCA (scaled) scoring plot for indica (blue) and sativa (red).
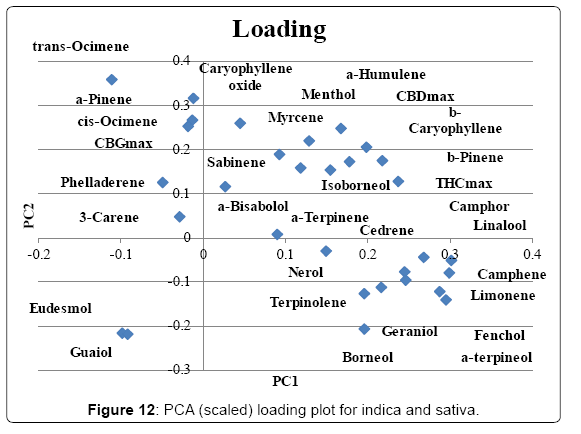
Figure 12: PCA (scaled) loading plot for indica and sativa.
OG vs Kush
A data set containing only OG type or Kush type samples was created from the original data (Table 1) and scaled PCA was performed. The scoring and loading plot can be found in (Figures 13 and 14). PC1 was 29.3%, PC2 was 11.5%. Separation of the two groups can be noticed although there is an overlapping section. The OG group is dominant in strains SFV OG (SFV), True OG (True), Tahoe OG (Tahoe), Fire OG (Fire), Neptune OG (Nept), Larry OG (Larry), Heroijuana OG (Hero), Platinum OG (Plat) and Skywalker OG (SkyW). This group is characterized mainly by the compounds α-terpineol, fenchol, limonene, camphene, terpinolene and linalool. The Kush group is dominant in strains Velvet Kush (Velv), Blackberry Kush (BB) and Purple Kush (Purp). This group is characterized mainly by the compounds trans-Ocimene, Guaiol, β-Eudesmol, Myrcene and α-Pinene.
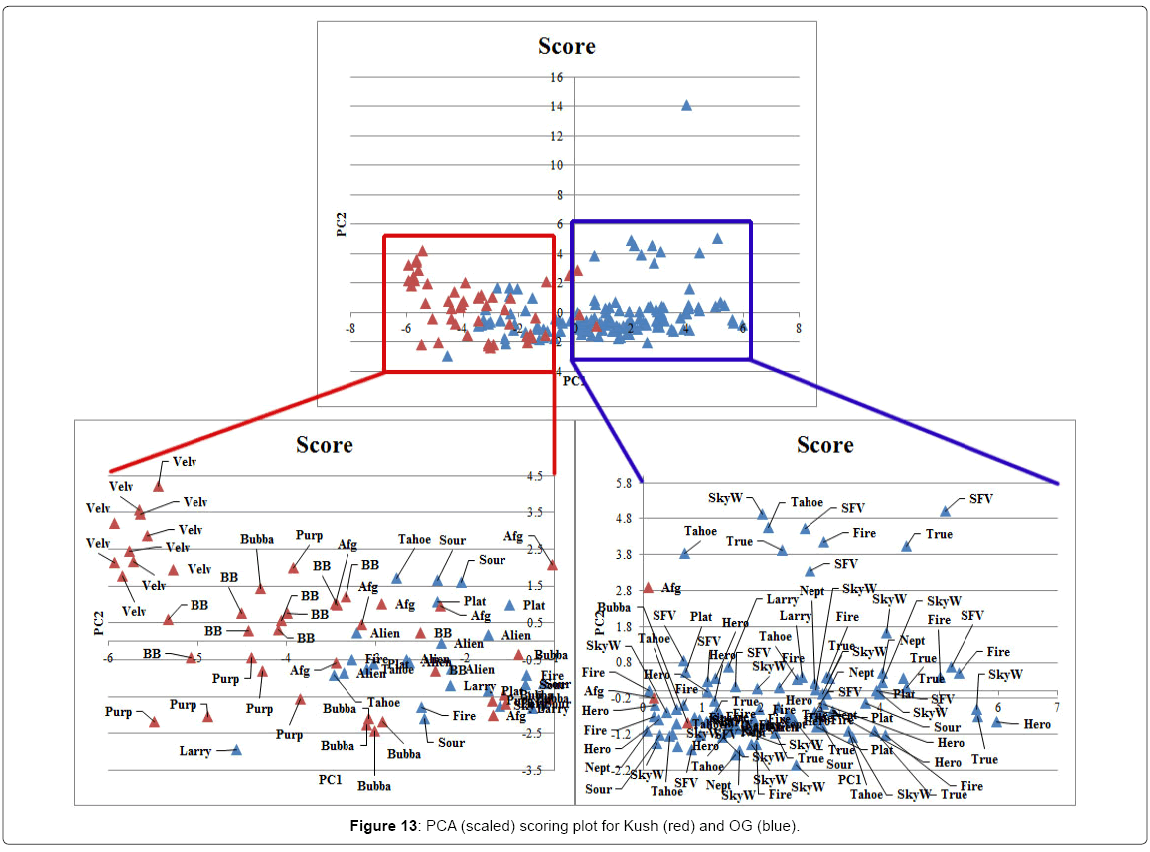
Figure 13: PCA (scaled) scoring plot for Kush (red) and OG (blue).
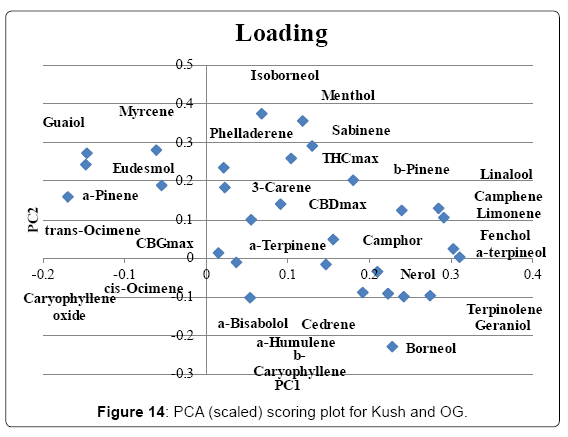
Figure 14: PCA (scaled) scoring plot for Kush and OG.
Description of concentrate data set
The concentrate data set consisted of 170 samples. The samples were assigned to one of three groups. The high CBD group has a CBDmax/THCmax ratio of >5.0, the medium CBD group had a ratio of >0.95<5.0 and the low CBD group had a ratio of <0.95. No data was available regarding the production method of the various concentrates. The distribution of the THCmax and CBDmax in the concentrate samples can be found in (Figures 15 and 16). It was noticed that the frequency of certain THC levels occur more often. There appears to be a peak in frequency at 25-29.9%, 40-44.9, 50-54.9% and 65-69.9%. We speculate that this is caused by the difference in production methods of the concentrates. The concentrates peaking in frequency at 25- 29.9% are expected to represent kief products, the peak at 40-44.9% is expected to represent hash products, the peak at 50-54.9% are expected to be mainly super critical CO2 extracts and the peak at 65-69.9% are expected to be hydrocarbon extracts. As with the flowers, it can be noticed that the presence of high amounts of CBD is relatively rare. Out of 170 samples, 138 samples had less than 4.9% CBD.
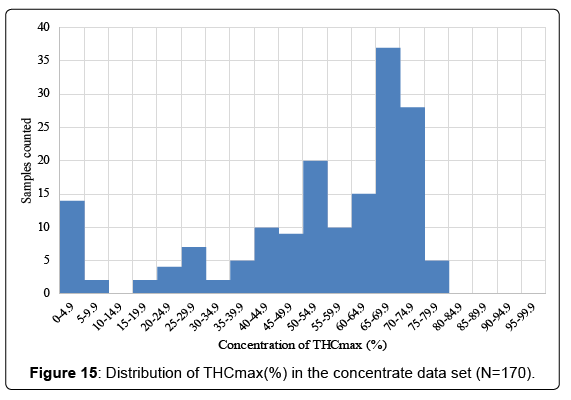
Figure 15: Distribution of THCmax(%) in the concentrate data set (N=170).
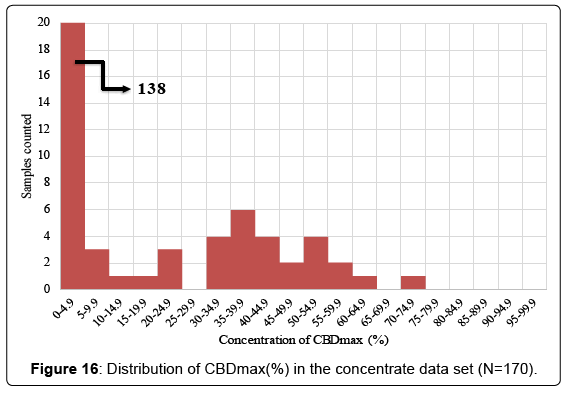
Figure 16: Distribution of CBDmax(%) in the concentrate data set (N=170).
PCA analysis of the concentrate data set
Figure 17 shows the PCA scoring plot for the data when scaling is not applied. PC1 explained 98.7% of the variation, PC2 explained 0.9%. Three distinct groups can be noticed. The loading plot (Figure 18) shows that CBDmax and THCmax content are the main parameters that separate the groups. The presence of a low CBD, medium CBD and high CBD group supports the model of 1 locus with 2 alleles by DeMeijer et al [9].Scaled PCA was performed as well and the scoring and loading plot can be found in supplementary information (Figures 3 and 4). PC1 explains 21.4% of the variation and PC2 explains16.2%. No distinct grouping could be observed in the scoring plots. This analysis was also repeated with just the terpene data, but this did not result in distinct groups. Three (3) samples separated from the majority of the samples in the right top field of the scoring plot. The loading plot reveals that samples in this region have higher levels of terpinolene, α-phellandrene, and α-terpinene. It is interesting to note that those are the same terpenoids that are typical for Jack Herer and Trainwreck strains. Most likely these concentrates originate from those strains.
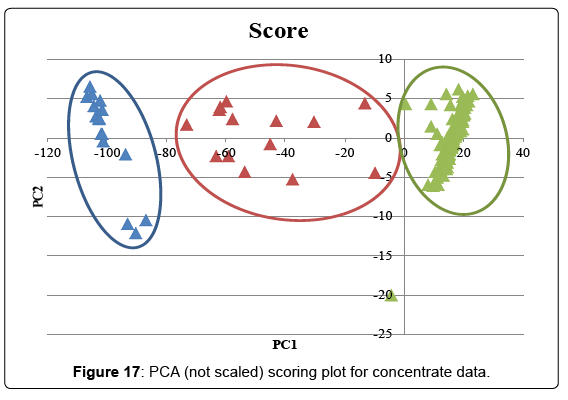
Figure 17: PCA (not scaled) scoring plot for concentrate data.
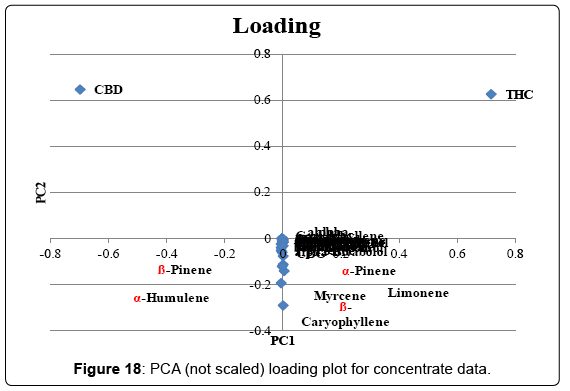
Figure 18: PCA (not scaled) loading plot for concentrate data.
PCA analysis of combined flower and concentrate data
To see if the relative chemical composition changes during processing, PCA was plotted for all the concentrate and flower data. PC1 was 18.6%, PC2 was 13.2%. The scoring and loading plot can be found in (Figures 19 and 20). No clear grouping of flowers vs concentrates could be noticed but some concentrate samples separate from the rest of the samples. Inspection of the loading plot and the sample data revealed these samples have higher relative ratios of β-eudesmol, guaiol, α-bisabolol and isoborneol. These terpenes elute relatively late in GC analyses and it is speculated that these concentrates have been heated at some time during processing, evaporating part of the more volatile terpenoids and therefore changing the relative ratio in favor of the less volatile terpenes. However, the large majority of the flowers and concentrate samples are dispersed among each other in the scoring plot indicating a similar relative composition of compounds.
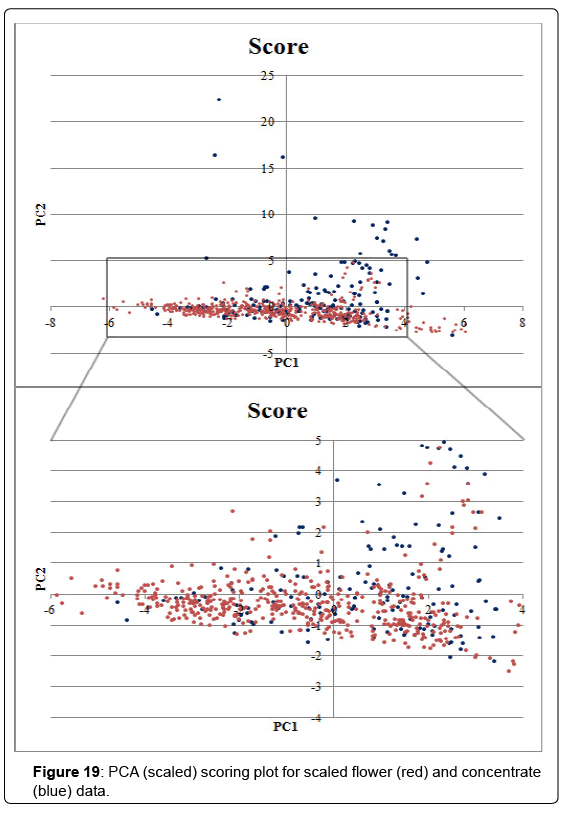
Figure 19: PCA (scaled) scoring plot for scaled flower (red) and concentrate (blue) data.
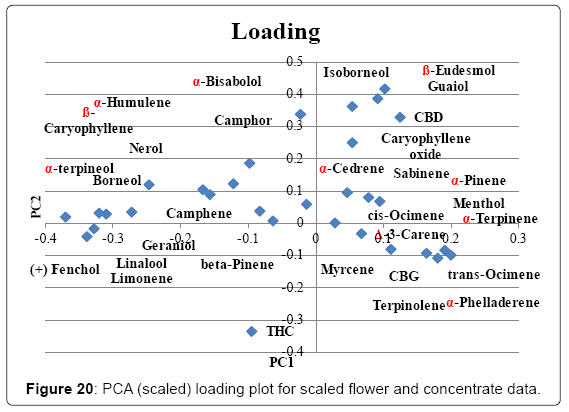
Figure 20: PCA (scaled) loading plot for scaled flower and concentrate data.
Cannabis testing labs regularly receive the question “Which strain has the most THC?”, but as was shown in (Table 1), THCmax content can be highly variable for a strain. In some cases the level of THCmax could be 5 times higher in the highest sample compared to the lowest sample. The data presented shows that strain name cannot be used as an indication of potency. The observed variation in THC content is most likely a result of cultivation conditions. This data indicates the importance of testing for potency so the consumer knows what to expect. Strain name is also not a clear indicator of chemical composition. Variations in chemical composition of samples with the same strain name describe the importance of broad based chemical profiling. By providing patients with more information regarding the composition of the cannabis they can rely on chemical composition for reproducible physiological results instead of strain names who have been shown to not necessarily correlate with compounds present in the cannabis flowers. PCA of the flower data did not reveal tight clustering of specific chemotypes but indicates a continuum of varied chemical composition. In most cases the replicates of a specific strain did not cluster showing a highly variable chemical composition even within a strain name. Some strains specifically Harlequin, Jack Herer, Trainwreck, Blue Dream and Green Crack showed much better clustering and seem to have a more distinct chemical profile than the majority of the strains. Perhaps these strains are more easily identified by their smell than other strains as they had relatively high concentrations of specific terpenes. As our testing perspective here is one from the patient point of view it would be interesting to investigate chemically distinct strains for their physiological properties to see to which extent chemotype might influence physiological effects. In the comparison of samples characterized as sativa or indica most of the samples overlapped. No distinct sativa group clustered independently from indica strains, however approximately half of the indica samples separated from the overlapping group. It is likely that many of the strains labeled as sativa are not in fact pure sativa strains as represented by hemp cultivars (with relatively higher CBD levels compared to THC) but rather high potency narrow leaflet drug type cultivars with higher THC levels compared to CBD. This data also indicates another distinct chemotype referred to as an indica with high levels of limonene, fenchol, α-terpineol, camphene, linalool, THCmax, camphor, geraniol, β-pinene and β-caryophyllene exists. This chemotype is represented in strains like 1st Generation Diablo, Black Mamba, Skywalker, Neptune OG and True OG. The observed data does not support the classification between indica and sativa as it is commonly presented in current cannabis culture. A new classification system is needed to further the medical utility of cannabis products for patients to enable them to communicate better with physicians and health care providers.Varieties with the terms OG and Kush in them are popular in the California medicinal cannabis market most likely due to their relatively high THC potency and strong pungent odor. These strains are also characterized by relatively high levels of terpenoids with alcohol substitutions. In the comparison of strains with the term Kush vs OG a differentiation between the two categories could be noticed. OG strains had relatively higher levels of α-terpineol, fenchol, limonene, camphene, terpinolene and linalool whereas Kush samples were characterized mainly by the compounds trans-ocimene, guaiol, β-eudesmol, myrcene and α-pinene. Higher levels of sesquipterpenoid alcohols have been reported to be a potential distinguishing characteristic of the wide leaflet drug type strains originating from Hindus Kush region of Afghanistan and Pakistan [21]. In media outlets cannabis concentrates are referred to as potentially more dangerous than herbal cannabis due to higher potency. Although the average THCmax concentration of concentrates (52.5%) is much higher than the average concentration in flowers (16.8%) the relative composition is similar. It is therefore expected that physiological effects should be similar for concentrates and flower if the dose is corrected for the concentration difference.
