Research Article - (2017) Volume 5, Issue 8
In this study, three solvent extracts (ethanol, acetone and hexane) were obtained from Synepalum dulcificum ((Daniell) known locally as “ntum” in Akaeze dialect of Igbo language of Nigeria and traditionally used as sweetener were evaluated for its flavourant principles. The presence of bioactive components were detected and the result of the cold solvent extraction revealed that ethanol gave the highest percent extract recoveries of 1.816%, hexane gave 0.873% while the lowest yield was observed for acetone as 0.508%. Quantitative assay revealed that ethanolic extracts had the highest content of flavonoids, glycosides, phenols, tannins, saponins and alkaloids (6.10%, 3.20%, 2.8%, 2.00%, 1.3% and 0.14%) respectively. This was followed by the acetone extracts which gave the values for flavonoids (0.70%), glycosides (0.50%), saponins (2.12%), phenols (1.60%), tannins (0.26%) and alkaloids (0.62%). The TLC plate developed and sprayed with vanillin/sulphuric acid reagent (EMW) exhibited three main bands of distinct colours in the acetone (ACE) extract while ethanol (ETE) yielded six bands. The flavour threshold was determined at neutral and slightly acidic pH 4.5. The results showed that extracts of ACE and ETE revealed strong presence of the active principles up to 0.1% at pH 7.0 and 0.01% at a pH of 4.5. Chromatographic analysis of acetone extract revealed that component A- 3 has a melting point of 65-67°C while the GC analysis of A-3 showed the eluate of two compounds at different retention times of 12.692 and 15.125 minutes. Spectral Analysis of compounds in A-3(a,b) revealed that they are possible isomers and based on spectral data the structure of compound A-3a was proposed as 2, 5-dimethyl-2, 4-dihydroxy-3(2H)-furanone.
Keywords: Flavourant principles; Syepalum dulcificum; Bioactive; Characterization
Plant-derived substances are of great interest due to their versatile applications and there are commonly used in traditional medical practice as drugs, nutraceuticals, food supplements, flavours, pharmaceutical intermediates and other chemical entities [1,2]. The value of these plants lies in their bioactive phytochemical constituents [3,4]. Phytochemicals are naturally bioactive compounds found in various parts of plants [5] and most spices, condiments, teas, and other beverages, owe their individual properties to the pharmacologically active secondary plant metabolites that they contain [6].
Taste is due to the reaction with receptor sites on the tongue from molecules, which are mainly non-volatile and are classified according to legislation as natural, nature-identical or artificial flavouring substances [7]. The mammalian taste gland can respond to a large number of chemical compounds such as sweet, salty, sour, bitter and umami (savory) taste [8]. Less is known about the mechanism of sweet substance and there seems to be no relationship between organic functional groups and sweet flavour [9,10], as almost every class of compound has a constituent which tastes sweet, yet at the same time the chemistry is very specific [11]. Natural flavours are not simply one or two compounds, which could be easily synthesized, but a large number of compounds in a characteristic distribution, called a flavour profile [12].
Synsepalum dulcificum (Daniell) is a promising species but has a poor documented resource [13]. The species are well known for their taste modifying properties which have been traditionally exploited for centuries in Africa [14]. The plant is commonly known as Ntum in the Akaeze dialect of Igbo language of Nigeria and is traditionally used as local sweetener. Not much is known of the chemical structure of the compounds in the fruit pulp of Synsepalum dulcificum but the antinutritional compositions of the seed has been partially determined [15,16]. Sysepalum dulcificum fruit is reported to have antioxidant activities [17] and improves the sweetness of low-calorie desserts without increasing energy compensation. Thus, miracle fruit could represent a novel sweetener for use in food [18].
Research duration
This study was carried out at the Chemical Sciences Laboratory, Evangel University Akaeze from 2012- 2015.
Collection and identifications of plant materials
Ripened fruits of Synsepalum dulcificum were harvested from fallow farmland situated in the Southern part of Nigeria during the period. The plant sample was identified by Professor Godwin Udom of the Department of crop production University of Uyo and authenticated by Professor JC Okafor and the plant fruit and stem sample deposited at Evangel University Herbarium.
Sample preparation and extraction procedure
Fresh ripened fruits pulp were ground into fine slurry using a blending machine. The following extraction solvents: hexane (40-60°), acetone and ethanol were employed for the removal of the plant’s active principles. 75 mL of each solvent (ethanol (95%), acetone and hexane were added successively to the ground plant sample (7.5 g) in a conical flask and allowed to stand for 6 hours at 4°C and thereafter permitted to stand for 48 hrs for at room temperature. The solution at the end of the extraction was filtered the filtrate was subsequently evaporated using a vacuum dryer and the percentage yield based on the powdered plant material used was calculated. The extracts obtained were stored in a refrigerator until required.
Estimation of alkaloids contents
The alkaloid content of the extract was determined by the method reported by Harborne [19]. About 5.0 g of each sample was weighed into a 250 mL beaker, and a 200 mL of 10% acetic acid in ethanol added, and allowed to stand for 4 hrs. The mixture was filtered using Whatmann No.4 filtered paper and concentrated in water bath to 50 mL of the original volume. Concentrated NH4OH added drop wise to each extract until the precipitation was complete. The suspension was allowed to settle and the precipitate collected, washed with NH4OH and then filtered. The residue was dried and weighed and the percentage alkaloid content calculated.
Estimation of saponin content
Saponin content was determined by the method of Obadoni and Ochuko [20]. About 12.0 g of sample extract was mixed with 100 mL of 20% ethanol, and then incubated in a water bath at 55°C for 4 hrs with stirring. The mixture was filtered and the extract re-extracted with 200 mL of 20% ethanol. The combined extract was concentrated to 40 mL in a water bath at 90°C. The concentrate was then transferred into a 20 mL separating funnel and 20 mL diethyl ether added, and shaken vigorously. The aqueous layer recovered while the ether layer was discarded. The purification process was achieved by heating with 60 mL of n-butanol. The combined n-butanol extracts was washed twice with 10 mL of 5% aqueous NaCl, and the remaining solution heated in a water bath. After evaporation, the samples were dried in an oven to a constant weight, and the percentage saponin content calculated.
Estimation of glycoside
The glycoside content of the extracts were determined by dissolving 10.0 g of the extract in 100 mL of 50% H2SO4 in a test tube. The mixture was heated in boiling water for 15 minutes, and 10 mL of Fehling solution added, and the mixture allowed to boil. A red precipitate in each extract tested, indicated the presence of glycosides which was used to calculate the percentage glycoside [21].
Estimation of flavonoid content
The flavonoid content of the extracts was estimated by the method of Krishnaiah et al. [22]. About 15.0 g of each sample was extracted repeatedly with 100 mL of 80% methanol. The whole solution was then filtered through Whatmann No.4 filtered paper. The filtrate was then transferred into a crucible and evaporated to dryness on a water bath, and weighed. The percentage flavonoid content was then calculated.
Determination of total phenols by spectrophotometric method
The fat free sample was boiled with 50 mL of ether for the extraction of the phenolic component for 15 min. About 5 mL of the extract was pipetted into a 50 mL flask and then 10 mL of distilled water added. Two (2) mL of ammonium hydroxide solution and 5 mL of concentrated amyl alcohol also were added. The samples were made up to the mark, left to react for 30 min for colour development and absorbance measured at 505 nm.
Estimation of tannin content
Tannin content was determined by the method of Van-Burden and Robinson [23]. About 6.0 g of the extract was weighed into a 50 mL plastic bottle, 50 mL distilled water added, shaken for 1 hr in a mechanical shaker, filtered into a 50 mL volumetric flask, and made up to the mark with distilled water. Then 5.0 mL of each sample was mixed with 2.0 mL of 0.1M FeCl3 in 0.1 N HCl and 0.008 M potassium ferricynide added, allowed to stand for 10 minutes and the absorbance read at 520 nm.
Assessment of flavour threshold value (sweetness)
This was determined according to the method of Van-Cott and Littell [24]. 9.0 mL of distilled water was measured into a paper cup and 1.0 g of sample dissolved to yield a 10% (w/w) sample solution. The mouth was rinsed with plain tap water and a clean cotton swab dipped into the 10% solution and smeared around the tongue. Taste with sweetness, was indicated by a + in a data table for 10% sample extract. A further 1.0 mL of the 10% sample solution was measured into a clean paper cup and 9.0 mL of distilled water added to give a 1% sample solution. Again mouth was rinsed with plain tap water and a clean cotton swab dipped into the 1% solution and smear around the tongue. Taste with sweet note was also indicated by a + in the data table for 1% sample. Other observations were noted such as mouth feel. The serial dilution was continued and each new solution tested with the cotton swab procedure. The results were recorded till the lowest concentration at which taste for sweetness could be detected (approximate taste threshold value). This experiment was repeated with sucrose and aspartame.
Analysis by thin layer chromatography
Solvent extracts of Synsepalum dulcificum were subjected to thin layer chromatographic analysis to determine the number of chemical constituents to support the chemical test. The details of the procedure are as follows: About 0.1 mg of plant extract (0.01 mL of 10 mg/mL) was separated on Merck TLC F254 analytical plates using an eluents solvent system of different polarities such as BEA (benzene/ethanol/ aluminium hydroxide) ratio (9:9:1), CEF (chloroform/ethyl acetate/ formic acid) ratio (5:4:1) and EMW (ethylacetate/methanol/water) ratio (4:5:4). The separated components were visualized under visible and ultra violet (UV) light. The plates sprayed with vanillin sulphuric acid spray reagent were heated for five minutes at 100°C for colour development. The qualitative evaluation of the plates were done by determining the migrating behaviour of the separated substances expressed as a as retardation factor (RF value).
Column chromatography
This was done using a 50.0 cm column long with diameter of about 25.0 mm and with a narrow tip. The samples obtained from the TLC were introduced and eluted and fractions with similar RF values were mixed together and evaporated to dryness.
Melting point determination
Melting point determination was carried out to ascertain the level of purity of the fractions obtained from column chromatograph using Gallen-kamp melting apparatus.
Gas chromatograghy-mass spectrophotometric analysis
Gas chromatograghy-mass spectrophotometric assay of the extracts were carried out using Perkin-Elmer Gas chromatogragh, Clarus 500 system and GC interfaced to a Mass spectrometer fitted with a Elite-I, fused silica capillary column (30 mm × 0.25 mm 1D × 1 μMdf, composed of 100 percent dimethyl polysiloxane). For gas chromatograph-mass spectrometer detection, an electron ionization system of 70 eV ionizing energy were utilized. Helium gas of 99.999% purity was used as the carrier gas at constant stream rate of 1 mL per minute and a dose volume of 2 micro-liter employed with splitting ratio of 10:1, Injector temperature of 250°C and ion-source temperature of 280°C were maintained. The oven temperature was set at 110°C, isothermally for two minutes, with an increase of 10°C per minute, to 200°C, then 5°C per minute to 280°C, culminating to a 9 minutes isothermal at 280°C. Mass spectra were carried out at 70 electron volt, at probe interval of 0.5 seconds and fragments from 40 to 450 Dalton atomic unit. Total gas chromatographic running time was determined and the comparative percentage amount of each components assessed by comparing its average peak area to the total areas. Analysis of the mass spectrum GC-MS data was carried out using the database of the National Institute Standard and Technology (NIST) having more than 62,000 patterns. The spectrum of the unidentified component related with the spectrum of the identified components stored in the NIST library. The Names, Molecular weight and structures of the components of the test materials were established.
Infrared (IR) analysis
For GC-FT IR analysis, a Bio-Radiation Digilab FTS-45A spectrometer coupled to a Bio-Radiation Tracer equipped with a liquid Nitrogen cooled narrow-band MCT detector and coupled to a HP 5890 series II gas chromatograph was used. The samples were eluted on a J and W DB-1 column 30 m × 0.25 mm (i.d.)/0.25 μm flick width with helium as stream gas (split injection mode). Deposition tip and transmission line were held above 200°C. Absorbance spectra were recorded from 4000 to 700 cm-1 at a spectral resolution of 1 cm-1.
UV-visible absorption spectroscopy
Double beams Shimadzu ultra violet-2450 Probe ultra violet-visible spectrophotometer was used to measure the absorption spectra over a wavelength series of 200-800 nm which joined with a cell temperature controller. Quartz cuvettes were used for measurements in solution.
Components identification
Components from sample extracts were recognized by comparison of their mass spectra and linear retention indices with those of the reference standard and their respective structures confirmed by UVVis, IR and GC-MS spectra.
Extraction
The result of cold solvent extraction of the fruit of Synsepalum dulificum is depicted in Table 1. Ethanol gave the highest percentage extract recovery of 1.816% for the cold extraction techniques followed by hexane at 0.873%, while lowest value was observed for acetone as 0.508%. However, quantitative determination of the chemical constituent revealed that ethanolic extracts yielded the following values for the bioactive compounds assayed: flavonoids, glycosides, phenols, tannins, saponins and alkaloids (6.10%, 3.20%, 2.80%, 2.01%, 1.30% and 0.14%) respectively, while acetone extracts gave values for phenol as 1.60%, saponins 2.12%, flavonoids 0.70%, glycosides 0.52%, tannins 0.26% and alkaloids 0.62% (Table 2).
| Solvent | Crude extract recovery (g) | Percentage recovery (%) |
|---|---|---|
| Hexane | 6.55 × 10⁻² | 0.873 |
| Acetone | 3.81 × 10⁻² | 0.508 |
| Ethanol | 1.36 × 10⁻¹ | 1.816 |
Table 1: Percentages recovery of cold solvent extracts (7.5 g) of Synsepalum dulcificum.
| Solvent | Alkaloids | Glycosides | Tannins | Flavonoids | Phenols | Saponins |
|---|---|---|---|---|---|---|
| Hexane | 0.26 | 0.91 | 0.2 | nd | 4 | 1.5 |
| Acetone | 0.62 | 0.52 | 0.26 | 0.7 | 1.6 | 2.12 |
| Ethanol | 0.14 | 3.2 | 2.01 | 6.1 | 2.8 | 1.3 |
Table 2: Quantitative determination of the chemical constituents of Synsepalum dulcificum fruit pulp extracts in percentage.
Summary of TLC results
The summary of thin layer chromatographic results are shown in Table 3 with the total number of components visualized in different solvent extracts (hexane, acetone and ethanol). Ethanol was the best extractant with 48 components followed by acetone showing 26 and hexane 25 components respectively. TLC analysis of the extracts showed that the hexane extract consist mainly of low polarity compounds since no compound was visible on the origin in both polar and less polar developing solvents. These confirm that polar compounds were not lost during hexane extraction. However, ethanol and acetone extracts contained mainly polar compounds since very little colour was visible on the solvent fronts of both TLC plates. The TLC plate developed and sprayed with vanillin/ sulphuric acid reagent (EMW) exhibited three main bands of distinct colours in the acetone extract while ethanol yielded six bands. Wide diversity in polarity components may provide physiological and structural information.
| Extracts | Visible light | Uv- light | Sprayed with vanillin sulphuric acid | Total no of components visualized | ||||||
|---|---|---|---|---|---|---|---|---|---|---|
| BEA | EMW | CEF | BEA | EMM | CEF | BEA | EMW | CEF | ||
| HXE | 3 | 2 | 3 | 4 | 2 | 2 | 4 | 2 | 3 | 25 |
| ACE | 3 | 5 | 2 | 3 | 3 | 0 | 5 | 4 | 1 | 26 |
| ETE | 7 | 6 | 3 | 6 | 7 | 2 | 6 | 7 | 4 | 48 |
Table 3: Summary of TLC Results.
Taste threshold of Synsepalum dulcificum extracts expressed in percentage w/w at pH 7.0 and 4.5
Flavour threshold values of extracts of Synsepalum dulcificum at neutral pH (7.0) is presented in Table 4, while Table 5 revealed the flavour threshold (sweetness) of three extracts of Synsepalum dulcificum fruits compared with two standards at pH 4.5. The results revealed that extracts ACE and ETE showed strong presence of the active sweet principles up to 0.1% at pH 7.0 but at pH 4.5 ACE and ETE showed strong presence of the active principles up to 0.01% [25], had reported flavour threshold value to be pH dependant. However, aspartame showed the presence of the flavour compounds even at 0.01% and 0.001% at pH 7.0 and 4.5 respectively. This may be attributed to its purity level.
| Substance extracts | 10% | 1% | 0.10% | 0.01% | 0.00% |
|---|---|---|---|---|---|
| HXE | - | - | - | - | - |
| ACE | ++ | ++ | + | - | - |
| ETE | ++ | ++ | + | - | - |
| SUCROSE | ++ | - | - | - | - |
| ASPARTAME | ++ | ++ | ++ | + | - |
Table 4: Taste threshold of Synsepalum dulcificum extracts expressed in percentage (%) w/w at pH 7.0.
| Substance extracts | 10% | 1% | 0.10% | 0.01% | 0.00% |
|---|---|---|---|---|---|
| HXE | - | - | - | - | - |
| ACE | ++ | ++ | + | + | - |
| ETE | ++ | ++ | + | + | - |
| SUCROSE | ++ | + | - | - | - |
| ASPARTAME | ++ | ++ | ++ | ++ | + |
Table 5: Taste (Sweetness) Threshold of Synsepalum dulificum extracts expressed in percentage (%) w/w at pH 4.5.
Spectral data of cold acetone extract of Synsepalum dulcificum fruit pulp
Tables 6 and 7 shows spectral data of cold acetone extract of Synsepalum dulcificum . A total of ten (10) compounds were tentatively identified while Tables 8 and 9 revealed the spectral data of cold ethanol extract with a total of twelve (12) compounds tentatively identified. Most of the compounds observed were of low molecular weight. They include 2,4-dimethyl-2,5-3(2H)-furanone, 2-hexanone, 3,5-dihydroxy-6-methyl-2,3-dihydro-4H-pran-4-one and four carboxylic acids of molecular formula C16H32O2, C18H34O2, C19H38O2 and C18H36O2 with retention times of 18.633, 20.561, 21.375 and 21.600 minutes respectively. However, Tables 10 and 11 shows the spectral data of cold hexane extract of Synsepalum dulcificum fruit pulp. A total of six (6) compounds were tentatively identified. The compounds observed had molecular formula of C5H10O, C16H32O2, C19H36O2, C16H30O2, C18H36O2 and C19H36O at retention times of 3.700, 18.583, 20.242, 21.292, 21.533 and 22.617 minutes respectively.
| S/NO | Name | Molecular formula | Molecular weight | Retention time | Base peak (%) |
|---|---|---|---|---|---|
| 1 | 4-hydroxy-4-methyl -2-pentanone | C6H12O2 | 116 | 3.125 | 43 |
| 2 | 2-furanmethanol | C5H6O2 | 98 | 3.45 | 41 |
| 3 | 4-methyl-4-hepten-3-one | C8H14O | 126 | 8.692 | 41 |
| 4 | 2,4-dihydroxy-2,5-dimethyl-3(2H)-furan-3-one | C6H8O4 | 144 | 12.692 | 42.95 |
| 5 | 3,5-dihydroxy-6-methyl-2,3-dihydro-4H-pyran-4-one | C6H8O4 | 144 | 15.125 | 43 |
| 6 | 3-ethyl-(Z)-2,4-pentadien-1-ol | C7H12O | 112 | 16.417 | 55.05 |
| 7 | Hexadecanoic acid | C16H32O2 | 256 | 18.583 | 43 |
| 8 | 9-Octadecanoic acid | C18H34O2 | 282 | 21.317 | 55.05 |
| 9 | Octadecanoic acid | C18H36O2 | 284 | 21.55 | 43 |
| 10 | 3,4-dimethyl-1-decene | C12H24 | 168 | 25.308 | 57.05 |
Table 6: Components detected in cold acetone extract of Synsepalum dulcificum.
| S/No | Name | Spectral data (ms[m/z (%)]) |
|---|---|---|
| 1 | 4-hydroxy-4-methyl -2-pentanone, | 43(100) 59(40) 58(20) 15(12) 101(10) |
| 2 | 2-furanmethanol | 41(100) 98(99) 39(91) 42(79) 53(75) 81(68) 97(58) 69(52) 70(42) 29(40) |
| 3 | 4-methyl - 4-hepten-3-one | 41(100) 97(91) 69(90) 27(40) 29(39) |
| 4 | 2,4-dihydroxy-2,5-dimethyl-3(2H)-furan-3-one | 43(100) 101(73) 73(63) 55(50) |
| 5 | 3,5-dihydroxy-6-methyl-2,3-dihydro-4H-pyran-4-one | 43(100) 44(78) 101(35) 45(25) 56(23) |
| 6 | 3-ethyl-(Z)-2,4-pentadien-1-ol | 55(100) 83(71) 41(58) 38(48) 79(31) 53(30) |
| 7 | Hexadecanoic acid | 43(100) 73(90) 60(86) 41(79) 57(62) 55(60) 29(40) 69(30) 71(28) 129(20) |
| 8 | 9-Octadecanoic acid | 41(100) 55(85) 43(59) 29(50) 69(42) 83(30) 27(25) 97(22) |
| 9 | Octadecanoic acid | 43(100) 41(86) 73(80) 55(68) 57(60) 29(48) 69(36) 129(28) |
| 10 | 3,4-dimethyl-1-decene | 57(100) 43(78) 71(65) 41(40) 55 (38) 56(37) 29(22) |
Table 7: Spectroscopic data of chemical constituents of cold acetone extract of Synsepalum dulcificum.
| S/No | Name | Molecular formula | Retention Time(min) | Molecular weight | Base peak (%) |
|---|---|---|---|---|---|
| 1 | 2-hexanone | C8H14O | 6.467 | 126 | 43 |
| 2 | 4-methyl-4-hepten-3-one | C8H14O | 8.633 | 126 | 41 |
| 3 | 2,4-dihydroxy-2,5-dimethyl-3(2H)-furan-3-one | C6H8O4 | 12.692 | 144 | 42.95 |
| 4 | 4H-pyran-4-one | C6H8O4 | 15.125 | 144 | 43 |
| 5 | n-Hexadecanoic acid | C16H32O2 | 18.633 | 256 | 43 |
| 6 | Nonadecanoic acid | C19H38O2 | 20.567 | 298 | 74.05 |
| 7 | Oleic acid | C18H34O2 | 21.375 | 282 | 55.05 |
| 8 | Octadecanoic acid | C18H30O2 | 21.6 | 284 | 43 |
| 9 | Methoxyacetic acid | C10H12O3 | 23.458 | 180 | 45 |
| 10 | 3,11-Tetradecadien-1-ol | C14H26O | 24.617 | 168 | 55.05 |
| 11 | 1-Octanol | C12H26O | 24.808 | 186 | 57.05 |
| 12 | 1,3-Cyclohexadiene | C11H18O | 25.7 | 166 | 77.05 |
Table 8: Constituents identified in cold ethanol sample of Synsepalum dulcificum.
| S/No | Name | Spectral data (ms[m/z (%)]) |
|---|---|---|
| 1 | 2-hexanone | 43(100) 55(25) 83(10) |
| 2 | 4-methyl-4-hepten-3-one | 41(100) 97(80) 69(72) 27(44) 38(30) |
| 3 | 2,4-dihydroxy-2,5-dimethyl-3(2H)-furan-3-one | 43(100) 101(73) 73(63) 55(50) |
| 4 | 4H-pyran-4-one | 43(100) 44(73)144(40) 101(30) 55(27) 45(25) 72(21) |
| 5 | pentadecane-carbonxylic acid | 43(100) 73(90) 60(87) 41(75) 57(62) 55(60) 29(40) 69(32) |
| 6 | Methy n – octadecanoate | 74(100) 87(60) 43(43) 41(27) |
| 7 | (Z)-9- Octadecenoic acid (Oleic acid) | 41(100) 55(83) 43(60) 29(52) 69(50) 83(31) 67(25) |
| 8 | Octadecanoic acid | 43(100) 41(87) 73(80) 60(78) 55(65) 57(61) 29(48) 70(32) 129(30) |
| 9 | Methoxyacetic acid | 45(100) 152(11) 122(9) |
| 10 | 3,11-Tetradecadien-1-ol | 55(100) 41(85) 67(45) 69(40) 81(35) 43(30) |
| 11 | 2-butyloctyl alcohol | 43(100) 57(99) 41(74) 29(62) 55(60) 71(50) 27(40) 56(35) 69(32) 85(30) |
| 12 | 1- (2, 6, 6- trimethyl -1, 3 – cydohexadien-1-yl) ethanol | 133(100) 107(92) 105(65) 121(61) 91(60) 43(33) 41(31) 148(30) 166(27) 77(25) |
Table 9: Spectroscopic data of chemical constituents of cold ethanol extract of Synsepalum dulcificum.
| Compound | Formula | Mol. Weight | Retention Time(min) | Base peak (%) |
|---|---|---|---|---|
| 2-methyl butanone | C5H10O | 86 | 3.7 | 43 |
| Pentadecanecarboxylic acid | C16H32O2 | 256 | 18.583 | 43 |
| Methyl-(11)-octadecenoate | C19H36O2 | 296 | 20.242 | 55.05 |
| (Z)-11-hexadecenoic acid | C16H30O2 | 254 | 21.292 | 55.05 |
| n-Octadecanoic acid (Humko industrene) | C18H36O2 | 284 | 21.533 | 43 |
| 2-methyl-(Z,Z)-3,13-octadecadienol | C19H36O | 280 | 26.617 | 55.05 |
Table 10: Components detected in cold hexane extract of Synsepalum dulcificum.
| Name of compound | Spectral data (ms [m/z (%)]) |
|---|---|
| 2- Methyl butanone | 43(100) 41(30) 27(25) 86(20) 39(15) 42(5) 71(0.5) |
| Pentadecanecarboxylic acid | 43(100) 73(80) 60(75) 41(70) 57(65) 55(60) 29(50) 71(45) 129(35) 256(30) 85(25) 213(15) 115(10) 98(5) 157(0.5) 185(0.2) |
| Methyl –(11)-octadecenoate | 55(100) 41(80) 43(60) 69(55) 74(45) 29(35) 87(30)27(25) 98(20) 264(10) 222(5) 137(0.5) 180(0.1) |
| (Z)-11-hexadecenoic acid | 55(100) 41(70) 29(55) 43(50) 69( 40) 27(30) 83(25) 97(20) 137(0.5) |
| n-Octadecanoic acid (Humko inclustrene) | 43(100) 41(85) 60(75)73(70) 55(65) 57(60) 29(50) 69(40)129(35) 284(30) 185(25) 241(20) 143(10) |
| 2-methyl-(Z,Z)-3,13-octadecadienol | 55(100) 41(85) 67(45) 81(40) 43(35) 95(30) 109(20) 121(15) 135(10) 149(5) 248(2) |
Table 11: Spectroscopic data of chemical constituents of cold hexane extract of Synsepalum dulcificum.
Melting points of purified acetone extract of Synsepalum dulcificum : Fractions that were found to contain active principles were further chromatographed to obtain A-1, A-2, A-3, A-4 and A-5 (Table 12). Fraction A-3 has a sharp melting point of 65-67°C and a strong indication of the flavourant compound suggesting the presence of 2,4- dihydroxy-2,5-dimethyl-3(2H)-furan-3-one (Table 5), while fractions A-1, A-2, A-4 and A-5 were found inactive and depicts wide range melting points of 92-99°, 80-86, 54-61° and 71°-77°C respectively.
| Fraction | Appearance | Melting point (°C) |
|---|---|---|
| A-1 | Gray white crystal | 92-99 |
| A-2 | White powdered solid | 80-86 |
| A-3 | White powdered solid | 65-67 |
| A-4 | Tiny white crystals | 54-61 |
| A-5 | White broad flakes | 71-77 |
Table 12: Melting point of purified acetone extract of Synsepalum dulcificum.
Spectral data for the purified acetone fraction
The IR, UV-Vis, and GC-MS data for the purified fraction (A-3) of acetone extracts are revealed in Table 13 while Table 14 shows the GCMS results for A-3 fraction. The GC analysis for A-3 showed the eluate of two compounds at different retention times of 12.692 and 15.125 minutes respectively. The mass spectral analysis for this compounds revealed a molecular mass of 144 each for A-3 with a diagnostic fragment ion peak at m/z=43 and 43 as base peak, which represents peak with the highest percentage abundance.
| IR (cm-1) (neat run) | UV-Vis(nm) | GC retention Time (min) | Mass of fragment ion (m/z) (% abundance) |
|---|---|---|---|
| 3,45,02,318 | 3,57,336 | 12.692 | 43(100),101(75),73(65),55(50),144(40) |
| 2,99,01,645 | 3,23,312 | - | - |
| 1518,1450, | 3,05,271 | - | - |
| 1,36,51,237 | 2,72,230 | 15.125 | 43(100),44(70),144(45),101(40),45(35) |
| 1,14,91,043 | 2,29,228 | - | 72(30),55(25) |
Table 13: Spectral data for the purified acetone fraction A-3.
| Retention Time (min) | Molecular mass | Proposed identity | Masses of fragment ion m/z (% abundance) |
|---|---|---|---|
| 12.692 | C6H8O4 | 2,4-dihydroxy-2,5-dimethyl-3(2H)-furanone | 43(100),101(75),73(60),55(50),144(40) |
| 15.125 | C6H8O4 | 3,5-dihydroxy-6-methyl-2,3-dihydro-4H-pyran-4-one | 43(100),44(75), 144(50),101(45),45(35),55(30), 72(25),73(20),115(0.5) |
Table 14: Mass spectral data for A-3 fraction from acetone extract.
Spectral analysis
From the mass spectra (Scheme 1), it was observed that cleavage of the bond beta to the carbonyl group (ring opening) and subsequent double cleavage resulted to the fragment ion peaks at m/z=101. This was caused by the elimination of methyl group and carbon monoxide molecule. Further fragmentation resulted to the loss of another carbon monoxide molecule at m/z=73. This was followed by Mclafferty rearrangement and a loss of an aldehyde group with a mass unit of 30 (HCHO) to yield a high intensity peaks at m/z=43 which corresponds to the base peak. Most compounds can fragment in a unique pattern and by comparing this fragmentation pattern with standards or by comparing to library database with known spectra, compounds can usually be identified [26]. However, the fragmentation pattern of the co-eluate compound revealed that ring opening and an expulsion of an aldehyde group (CH2=CHO) yielded a high intense peak at m/z=101 but the expulsion of carbon monoxide resulted to another prominent fragment ion peaks at m/z=73, while the elimination of a proton gave a prominent fragment peak at m/z=72. The peak at m/z=43 was caused by the removal a of formyl ion (HCO) of mass unit 29 from the fragment ion peak at m/z=72. From the spectra of these two compounds, fragments 144, 101, 73, 55 and 43 (Scheme 2) were common to both and appeared to have the similar intensity. Mass peaks at m/z=72 and 115 had slightly different intensities and may be used as distinguishing fragments.
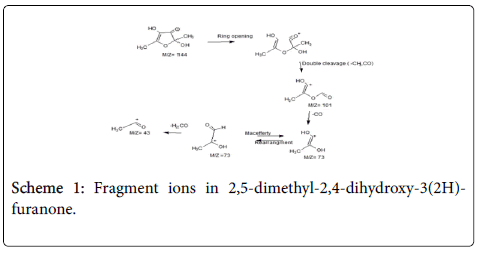
Scheme 1: Fragment ions in 2,5-dimethyl-2,4-dihydroxy-3(2H)- furanone.
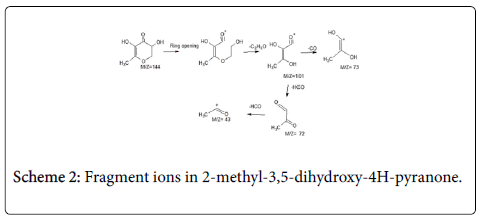
Scheme 2: Fragment ions in 2-methyl-3,5-dihydroxy-4H-pyranone.
However, by using the linear retention times of 12.692 and 15.125 minutes respectively, these two compounds could be easily distinguished. The presence of different functional groups in A-3 were identified by IR spectroscopy with bands at 1645 cm-1 (carbonyl group), C-H bending band at 2990 cm-1 and hydroxyl group band at 3450 cm-1. The presence of furan derivative (furanose) was revealed from the diagnostic absorption bands in UV spectrum at 271-272 nm and IR absorption band at 1645 cm-1 which are due to C=O (carbonyl moiety) absorptions resulting from furanone ring. With the exception of sotolone, which has a maximum absorbance at 235 nm, most furans exhibit maximum wavelength absorbance between 270-290 nm [27].
The fraction A-3 has similar mass to charge ratio at m/z 144 and similar fragmentation pattern. Compounds in A-3(a, b) are possible isomers. Based on these data and on literature report, compound A-3a was proposed to be furan derivative (furanone) and A-3b was proposed as pyran derivative (pyranose) respectively. This is in agreement with the work of [28] who reported the isolation and identification of two of five pungent principles in Capsicum annum using gas chromatography.
Structural characterization of compound A-3
The fragmentation pattern in the electron impact-mass spectrometry (EI-MS) was similar to that found in literature, showing strong peak at m/z=101 and was caused by the expulsion of methyl and carbonyl moiety. Further diagnostic fragments at m/z=75, 101 and 43 originated from the ion m/z=144 which confirmed the presence of hydroxyl, methyl and carbonyl group in A-3a (Scheme 3).
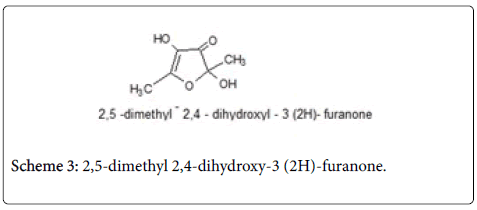
Scheme 3: 2,5-dimethyl 2,4-dihydroxy-3 (2H)-furanone.
The presence of hydroxyl, carbonyl and gem-dimethyl functional groups were also indicated from the IR spectrum which exhibited strong absorption peaks at 3450 (O-H stretching), 1645 (carbonyl), 2990 (C-H stretching), 1450 and 1365 cm-1(C-H bending). The UV strong absorption at 271-336 nm and the IR absorption at 1645 cm-1 along with GC retention time of 12.892 minutes (Table 14) suggested that compound A-3a is a furanone derivative. The above spectral data were closely related to the spectrum of furanone (2,4-dimethyl-4- hydroxy- 3(2H)-furanone) a powerful flavouring compound differing from isolated compound in Synsepalum dulcificum because it lacks only an additional hydroxyl group. This finding is in agreement with the work of [25], who reported the maximum absorption peak for standard 2,5-dimethyl-4-hydroxy- 3(2H)-furanone at 276 nm. Based on the above information the structure of compound A-3a was established as 2, 5-dimethyl-2, 4-dihydroxy-3(2H)-furanone. Scheme 1 indicates the MS fragmentation pattern of the compound.
Organoleptic guided purification of acetone (A-3) extract gave 2,5- dimethyl-2,4-dihydroxy-3(2H)-furanone as the principal flavouring agent. However, 2,5-dimethyl-4-hydroxy-3(2H)-furanone was reported as the main flavourant principle in pineapple [24]. Thus 2,5- dimethyl-2,4-dihydroxy-3(2H)-furanone has a gustatory activity and can be used in food industry as flavourant and also in pharmaceutical industry. The structure of the compound was established on the basis of IR, UV-Vis and GC-MS spectra.
