Research Article - (2015) Volume 3, Issue 1
Objective: To investigate the effects of panax notoginseng saponins on mobilizing bone marrow mesenchymal stem cells after cerebral infarction so as to provide experimental basis for Huoxue Huayu Decoction (HXHYD) that is promoting the blood flow and removing blood stasis.
Methods: Apart from the normal group, all of the remaining rats must survive the improved Zea-Longa middle cerebral artery occlusion (MCAO) modeling method; all standard rats were randomly divided into four groups. The first group designated as control group was administered with normal saline by gavage every day. The second, third and fourth groups designated as drug groups were administered respectively with Xuesaitong soft Capsule (ingredients dissolved in normal saline) in 20, 40 and 60 mg/ml body weight/day (low-dose group, mid-dose group and high-dose group). The treatment continued for 28 days. Each group was then divided into subgroups (each subgroup contains at least 8 rats) determined by time points (1st day 3rd day 7th day 14th day and 28th day). Changes of CD54, CD106, CD105, CD117 in blood and bone marrow of rats were detected by FCM. The SCF level at different time points were determined though ELISA methods.
Results: The stem cell factor (SCF) level in peripheral blood and bone marrow showed a significant increase in the control group and the treated group. The SCF in peripheral blood and bone marrow increased on the 1st day and reached a peak on the 14th day, then decreased in the peripheral blood gradually. The SCF level in peripheral blood showed a better increase in both medium-dose and high-dose groups than that of model group (p<0.05). The levels of CD54, CD106, CD105 and CD117 in peripheral blood and bone marrow in the control group and treated groups reached a peak on the 1st day, and then decreased gradually. There was a significant increase compared with the normal group (p<0.05). The levels of CD54, CD106, CD105 and CD117 in peripheral blood and bone marrow in medium-dose and high-dose groups showed a positive increase (p<0.05) than those of the control group at each time point. Meanwhile there was no significant difference of CD54, CD106, CD105 and CD117 (p>0.05) between the lowdose group and the control group at each time point.
Conclusion: PNS can mobilize the BMSCs to improve the levels in the peripheral blood.
Keywords: Panax notoginseng saponins; Bone marrow mesenchymal stem cells; Cerebral infraction; Mobilization
As one of the main resource of endogenous stem cells as well as the ideal seed cells for gene and cell therapy, the bone-marrow mesenchymal stem cells (BMSCs) represent a type of multi-potent cells with non-immunogenic and favorable tissue merging capacity. Moreover, BMSCs have clear mobilizing effects and raised potential value of those cells for clinical applications [1,2]. The research shows that when brain ischemia occurs, the MSC were mobilized from bone marrow to the focus through peripheral circulation and initiate the tissue regeneration. It is possibly a kind of compensatory reaction after brain damage that enables nerve cells to recover. However, the quantity of BMSCs mobilized into peripheral circulation is not enough to reach the treatment effect [3,4]. Thus the key to realize stem cell therapy into clinic application is to encourage more BMSCs into blood. As a result, our subject is to discuss the effect of PNS on mobilizing BMSCs cells after brain infarction and expand PNS for clinical application
Experimental animals
158 healthy SPF grade adult male Sprague-Dawley (SD) rats (280~300g) which purchased from Beijing Vital River Company were used in this research. Animal permit number: SCXK (Jing) 2006- 0009. All the rats were raised in Henan TCM University Experimental Animal Center for 1 week until randomized into groups. All animals were accessible to food and water during the experiment.
Experimental reagents
Mice monoclonal antibodies to rat CD54 and CD106 kits were purchased from Becton Dickinson (BD, USA). Rabbit antibody to CD105, Rabbit polyclonal antibodies to rat CD105 and CD117 kits were purchased from Bioss (Bioss, Beijing). SP-9001 Histostain TMPlus Kits and DAB Chromogen Kits were obtained from ZSGB-BIO (ZSGB, Beijing). Formaldehyde solution (batch number: 20100823) purchased form Tianjing Dihua Chemical Company and xylene (batch number: 100715) from Dezhikang Company (Dezhikang, Luoyang).
Experiment drug, equipment
Xuesaitong soft Capsule (main ingredients: PNS; batch number: Z53020134) was purchased from Kunming Pharmaceutical Corporation (KPC, Kunming)
Flow Cytometry was purchased from BD Company, United States. Centrifuge was purchased from Zhongke Zhongjia Scientific Instrument co., LTD (Anhui). Electronic precision scale was purchased from Jinghai Instrument co., LTD (Shanghai). Biological microscope (OLYMPUS-CX40) was purchased from Japan Olympus Company. Rotary Microtome (LEICARM2535) was purchased from LEICA Company, Germany. Precision balance (BS250S) was purchased from Saiduo LiSi Company, Beijing.
Model Establishing, inclusion and exclusion
Middle cerebral artery occlusion (MCAO) was induced by Zea- Longa [5] method. Animals were anesthetized with chloral hydrate (35mg/100g). The cut started from the central of neck, after the left common carotid (CCA), external carotid artery (ECA) and internal carotid artery (ICA) were exposed. A nylon thread was carefully inserted from CCA into the ICA and advanced towards the origin of the middle cerebral artery until a slight resistance was felt. Estimate the depth of thread towards the ICA and ECA bifurcation (18 ± 0.5mm). Animals’ temperature was maintained throughout the experiment. After 2 hours of MCAO, withdrawing the intraluminal filament until a slight resistance was felt. It indicated that the tip of nylon thread was back to the ICA and the reperfusion was accomplished. Animals were then recovered from anesthesia and continuously given penicillin 40,000 units IM for three days for the recovery. During which a sufficient food and water supply were provided.
The inclusion criteria: those which survived the first 24 hours after surgery, weight decreased after 24 hours, left Horner’s syndrome and right neurologic impairment appeared.
The exclusion criteria: intraoperative blood loss or the nylon tread was not deep enough to block the MCA (less than 18mm), not conforms to the inclusion criteria.
Groups and methods
All standard rats were randomly divided into four groups. The first group designated as control group was administered with normal saline by gavage every day. The second, third and fourth groups designated as drug groups were respectively administered with Xuesaitong soft Capsule (ingredients dissolved in normal saline) of 20, 40 and 60 mg/ kg body weight/day (low-dose group, mid-dose group and high-dose group).
Brain Preparation
Rats were sacrificed with overdose of 10% chloral hydrate and perfused with NS followed by 4% phosphate buffered paraformaldehyde (PFA). The infarcted brains were then removed and post-fixed in 4% PFA and then cut at least 10 slice with a freezing microtome at a thickness of 3um and stored in cryoprotectant.
Blood preparation
Sub-time points were set at 1st 3rd 7th 14th and 28th day. The blood and plasma were collected with abdominal aortic method. Plasma was measured with ELISA kits and blood for FCM, respectively.
Bone marrow samples collection
Rats were sacrificed and thigh bone was exposed. The marrow of thigh bone was washed with buffer (3.8ml DMEM and 0.2ml heparin sodium). The samples were then filtered by 40 meshes and centrifuged at 1500 for 10 min. The supernatant was then collected and kept at -80ºC. Sediment were then attenuated with 250 μl PBS and recollected for recovery.
ELISA assay
The levels of SCF in blood and bone marrow were measured with ELISA kits respectively. The measurements were performed step by step based on the protocol booklet of the ELISA kits according to the specifications given by the manufacturer.
FCM assay
About 50 μl of peripheral blood or bone marrow liquid were placed into FCM, respectively. CD106-PE,CD54-FITC, CD117-FITC, CD105-FITC and control reagent were added afterwards. 105 of cells were counted in each sample and the percentage of CD54, CD106, CD105 and CD117 positive cells calculated using software Cell quest.
Statistical analyses
All collected data was analyzed with statistical software SPSS Version 17.0. Analysis of variance (ANOVA) was used to find the significance of study parameters between groups. All results were expressed as mean (± SD, range). P<0.05 was considered significant.
Changes of SCF level at different time points in peripheral blood
Compared to normal group, SCF levels in other 4 groups in peripheral blood were significantly higher (P<0.05). Blood SCF level in model groups began to lift from the 1stday and reached peak at the 14th day. SCF level gradually reduced thereafter. The rising trends of blood SCF level in mid-dose group and high-dose group were better than that in the model group. No statistical difference was observed between low-dose group and model group (Table 1).
| Groups | N | 1d | 3d | 7d | 14d | 28d |
|---|---|---|---|---|---|---|
| High-dose | 8 | 15.21±0.12Δ* | 30.51±1.72Δ* | 36.01±0.09Δ* | 43.075±1.23Δ* | 33.646±0.47Δ* |
| Mid-dose | 8 | 13.11±0.32Δ* | 26.875±1.56Δ* | 33.59±0.23Δ* | 36.60±1.91Δ* | 29.95±0.56Δ* |
| Low-dose | 8 | 11.10±0.62Δ▲ | 15.56±0.98Δ▲ | 15.89±0.83Δ▲ | 18.15±2.67Δ▲ | 12.97±2.49Δ▲ |
| Model | 8 | 10.69±0.33Δ | 14.71±0.62Δ | 15.47±0.57Δ | 15.81±1.59Δ | 11.10±0.22Δ |
| Normal | 8 | 3.68±0.24 | 3.68±0.24 | 3.68±0.24 | 3.68±0.24 | 3.68±0.24 |
Note: Compared to normal group, SCF levels in other 4 groups at each time points were significantly higher (P<0.05). SCF level in mid-dose group and high-dose group
were better than that of the model group (P<0.05).The difference in the 14th day was most obvious. No statistical difference was observed between low-dose group and
model group (P<0.05).
Table 1: SCF Level in Peripheral Blood Between Groups (x ± s,N=8)
Changes of SCF level at different time points in bone marrow
Compared to normal group, SCF levels in other 4 groups in bone marrow were significantly higher (P<0.05). Bone marrow SCF level in model groups began to lift from the 1st day and reached peak at the 14th day. The rising trends of bone marrow SCF level in mid-dose group and high-dose group were better than that of the model group. No statistical difference was observed between low-dose group and model group (P>0.05) (Table 2).
| Groups | N | 1d | 3d | 7d | 14d | 28d |
|---|---|---|---|---|---|---|
| High-dose | 8 | 13.14±0.48Δ* | 23.17±0.62Δ* | 25.82±0.72Δ* | 30.80±0.32Δ* | 24.81±0.79Δ* |
| Mid-dose | 8 | 12.08±0.66Δ* | 20.31±0.42Δ* | 21.31±0.65Δ* | 25.54±0.62Δ* | 19.73±0.68Δ* |
| Low-dose | 8 | 8.59±0.78Δ▲ | 11.02±1.08Δ▲ | 14.17±0.87Δ▲ | 16.85±1.91Δ▲ | 12.77±0.58Δ▲ |
| Model | 8 | 8.08±0.90Δ | 10.08±0.65Δ | 13.41±0.59Δ | 15.41±0.13Δ | 12.35±0.72Δ |
| Normal | 8 | 4.12±0.59 | 4.12±0.59 | 4.12±0.59 | 4.12±0.59 | 4.12±0.59 |
Note: Compared to normal group, bone marrow SCF levels in other 4 groups at each time points are significantly higher (P<0.05). SCF level in mid-dose group and highdose group are better than the model group (P<0.05). The difference in 14th day is the most obvious. No statistical difference was observed between low-dose group and model groups at each time points (P>0.05).
Table 2: SCF Level in Peripheral Blood Between Groups (x ± s,N=8)
Changes of CD54 level in peripheral blood after MCAO modeling method at different time points
A small amount of CD54 was found in normal group, while in other 4 groups the CD54 level was significantly high (P<0.05). CD54 levels in the low, model and high-dose groups increased to peak in the 1st day and reduced gradually thereafter. The expression of CD54 at different time points in the mid and high-dose group was significantly lower than that in model group. The reduction in high-dose group was the most obvious (P<0.05). No statistical difference was found between low-dose group and model group at different time points (P>0.05) (Table 3 and Figure 1).
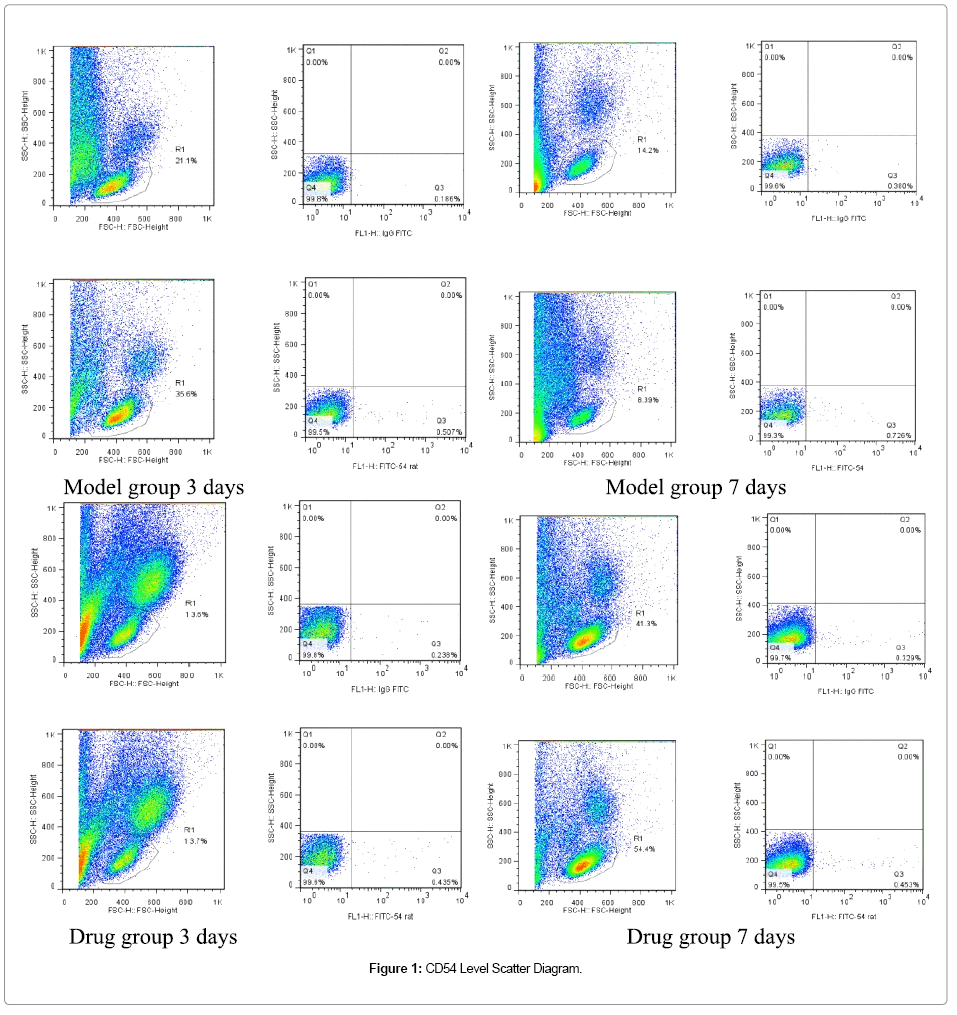
Figure 1: CD54 Level Scatter Diagram.
| Groups | 1d | 3d | 7d | 14d | 28d |
|---|---|---|---|---|---|
| Normal | 1.12±0.25 | 1.15±0.23 | 1.32±0.05 | 1.12±0.25 | 1.32±0.05 |
| Model | 6.65±0.13Δ | 5.65±0.35Δ | 4.87±0.21Δ | 4.59±0.17Δ | 3.72±0.46Δ |
| High-dose | 4.15±0.26* | 3.65±0.25* | 2.59±0.24* | 2.38±0.18* | 1.76±0.17* |
| Mid-dose | 5.12±0.22* | 4.68±0.23* | 3.57±0.20* | 2.66±0.22* | 2.06±0.09* |
| Low-dose | 6.42±0.28*▲ | 5.51±0.20*▲ | 4.54±0.39*▲ | 4.31±0.36* | 3.21±0.61*▲ |
Note: The CD54 positive cells count in model group is significantly higher than normal group at each time point (P<0.05). CD54 level in drug groups is lower than that in model group, CD54+ cells count is significantly lower than model group (P<0.05). No difference between low-dose group and model group (P>0.05).
Table 3: CD54 Level in Peripheral Blood after MCAO between Groups (x ± s,N=8).
Changes of CD54 level in bone marrow at different time point
Bone marrow CD54 levels in model group and drug groups were significantly higher than that in normal group (P<0.05). Bone marrow CD54 level in model group and drug groups increased to peak in the 1st day and reduced gradually thereafter. The expression of CD54 at different time points in mid and high-dose group was significantly lower than that in model group (P<0.05). No statistical difference was found between low-dose group and model group at different time points (P>0.05) (Table 4 and Figure 2).
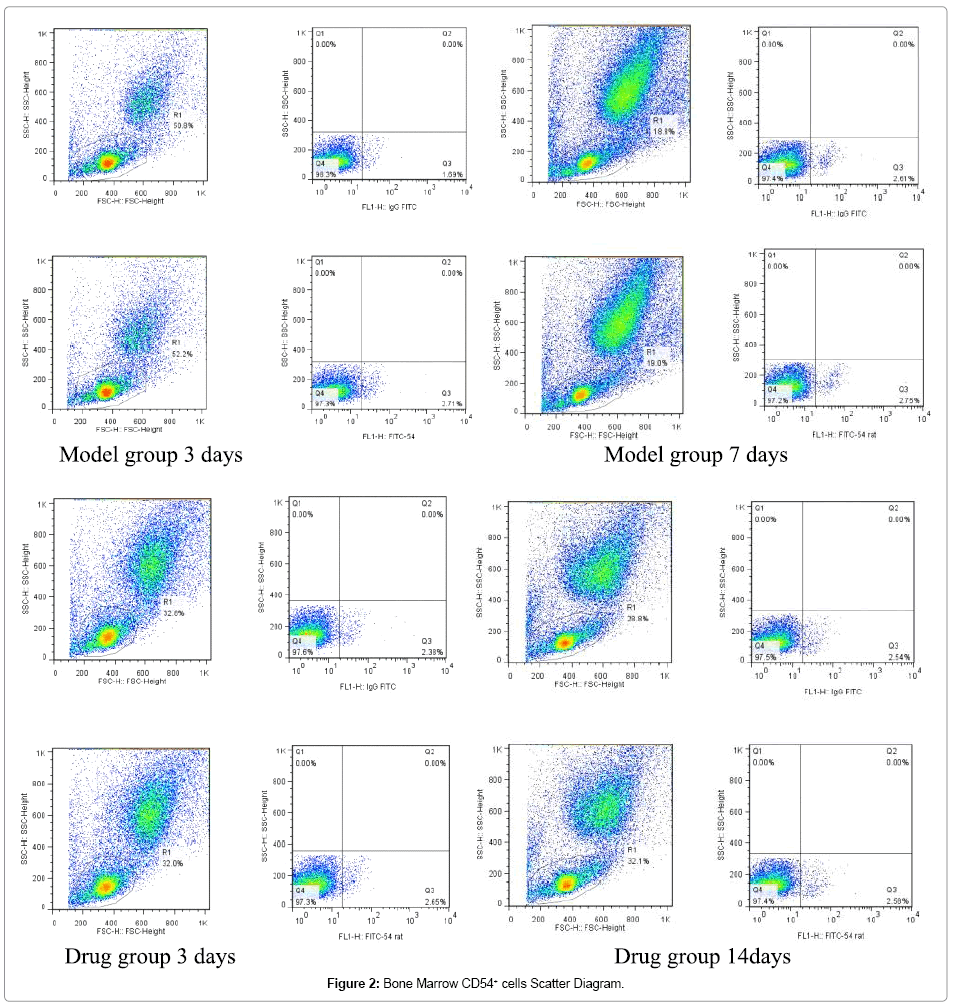
Figure 2: Bone Marrow CD54+ cells Scatter Diagram.
| Groups | 1d | 3d | 7d | 14d | 28d |
|---|---|---|---|---|---|
| Normal | 2.02±0.15 | 2.12±0.17 | 2.08±0.34 | 2.02±0.16 | 2.02±0.40 |
| Model | 4.69±0.15Δ | 4.79±0.45Δ | 4.13±0.47Δ | 3.79±0.08Δ | 2.75±0.32Δ |
| High-dose | 2.71±0.79* | 3.81±0.12* | 2.59±0.07* | 2.13±0.87* | 2.28±0.17* |
| Mid-dose | 3.73±0.72* | 4.01±0.22* | 3.12±0.13* | 2.69±0.37* | 1.98±0.28* |
| Low-dose | 4.43±0.32▲ | 4.76±0.42▲ | 3.59±0.56▲ | 3.59±0.47▲ | 2.01±0.97▲ |
Note: Bone marrow CD54+ cells count in model group at each time points is significantly higher than normal group (P<0.05). Bone marrow CD54+ cells count in high and
mid-dose groups was lower than that in model group (P<0.05). No difference between low-dose group and model group (P>0.05).
Table 4: Changes of Bone Marrow CD54 Level after MCAO between Groups ( x ± s,N=8)
Changes of CD106 level in peripheral blood after MCAO modeling method at different time point
Peripheral blood CD106 levels in model group and drug groups were significantly higher than that in normal group (P<0.05). The CD106 level in model group and drug groups peaked in the 1st day and reduced gradually afterwards. CD106 level at different time points in mid and high-dose group were significantly lower than that in model group (P<0.05). No statistical difference was found between low-dose group and model group at each time points (P>0.05) (Table 5 and Figure 3).
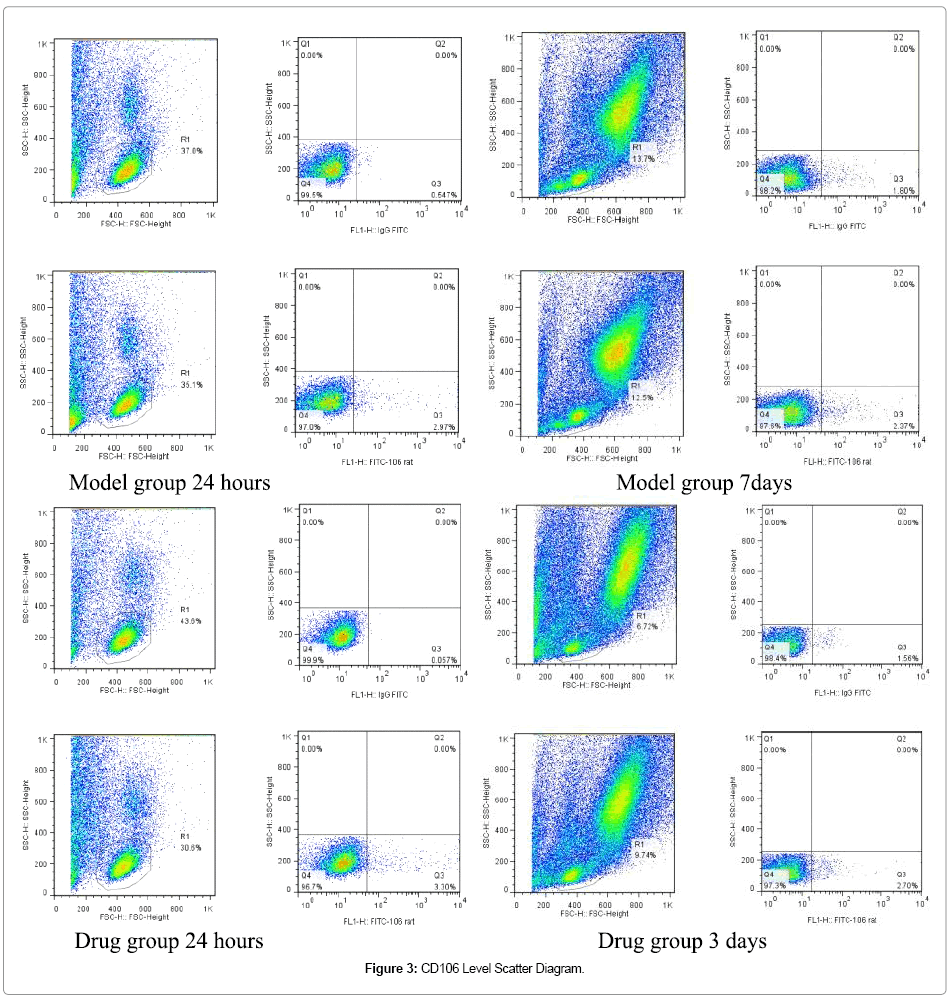
Figure 3: CD106 Level Scatter Diagram.
| Groups | 1d | 3d | 7d | 14d | 28d |
|---|---|---|---|---|---|
| Normal | 1.69±0.15 | 1.69±0.15 | 1.69±0.15 | 1.69±0.15 | 1.69±0.15 |
| Model | 4.52±0.18Δ | 3.78±0.34Δ | 3.59±0.13Δ | 3.41±0.25Δ | 2.29±0.24Δ |
| High-dose | 3.10±0.52* | 2.69±0.14* | 2.34±0.18* | 2.16±0.30* | 1.88±0.16* |
| Mid-dose | 4.00±0.12* | 3.53±0.17* | 3.36±0.22* | 3.14±0.17* | 2.01±0.14* |
| Low-dose | 4.32±0.23▲ | 3.96±0.17▲ | 3.46±0.18▲ | 3.26±0.23▲ | 2.14±0.66▲ |
Note: Blood CD106+ cells count in model group at each time points is significantly higher than normal group (P<0.05). Peripheral blood CD106+ cells count in high and mid-dose groups was lower than that in model group (P<0.05). No difference was observed between low-dose group and model group (P>0.05).
Table 5: CD106 Level in Peripheral Blood after MCAO between groups ( x ± s,N=8).
Changes of CD106 level in bone marrow at different time points
Bone marrow CD106 levels in model group and drug group were significantly higher than that in normal group (P<0.05). Bone marrow CD106 level in model group and drug groups increased to peak in the 1st day and reduced gradually afterwards. The expression of CD106 at different time points in mid and high-dose group was significantly lower than that in model group (P<0.05). No statistical difference was found between low-dose group and model group at each time points (P>0.05) (Table 6 and Figure 4).
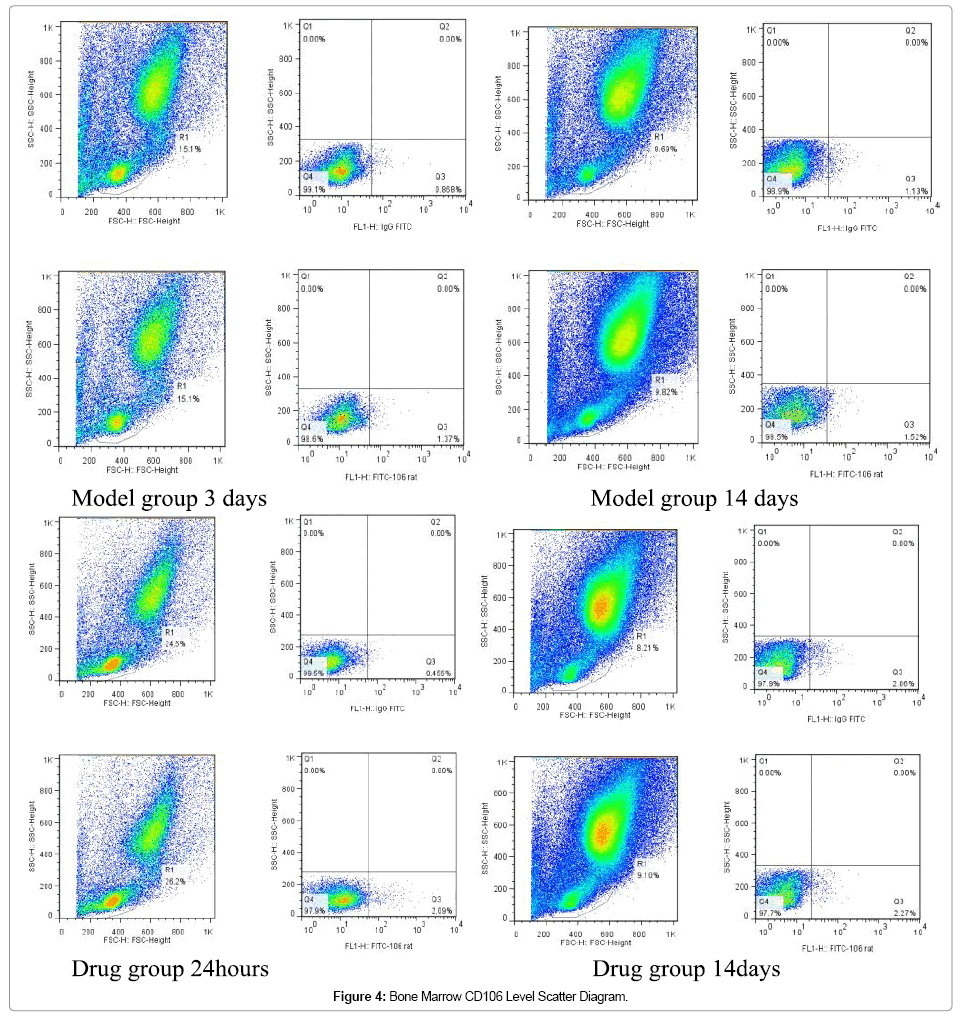
Figure 4: Bone Marrow CD106 Level Scatter Diagram.
| Groups | 1d | 3d | 7d | 14d | 28d |
|---|---|---|---|---|---|
| Normal | 2.31±0.34 | 2.31±0.34 | 2.31±0.34 | 2.31±0.34 | 2.31±0.34 |
| Model | 4.35±0.36Δ | 4.02±0.13Δ | 3.65±0.33Δ | 3.35±0.52Δ | 2.84±0.36Δ |
| High-dose | 3.37±0.93* | 3.12±0.52* | 2.61±0.75* | 2.21±0.07* | 1.71±0.13* |
| Mid-dose | 4.04±0.13* | 3.52±0.21* | 3.11±0.21* | 2.41±0.67* | 2.21±0.08* |
| Low-dose | 4.37±0.32▲ | 3.92±0.13▲ | 3.45±0.36▲ | 3.11±0.23▲ | 2.62±0.19▲ |
Note: Bone marrow CD106+ cells count in model group at each time points was higher than that in normal group with significant difference (P<0.05). Bone marrow CD106+ cells count at different time points in high and mid-dose groups was lower than that in model group(P<0.05). No difference was observed between low-dose group and model group (P>0.05).
Table 6: Changes of Bone Marrow CD106 Level after MCAO between Groups ( x ± s,N=8)
Changes of CD117 level in peripheral blood at different time points
Peripheral blood CD117 levels in model group and drug groups were significantly higher than that in normal group (P<0.05). The CD117 levels in each group started to increase from the 1st day and reached its peak at the 14th day and then reduced gradually afterwards. The rising trends of blood CD117 level in mid and high-dose group were significantly higher than that in model group (P<0.05). No statistical difference was observed between low-dose group and model group at each time points (P>0.05) (Table 7 and Figure 5).
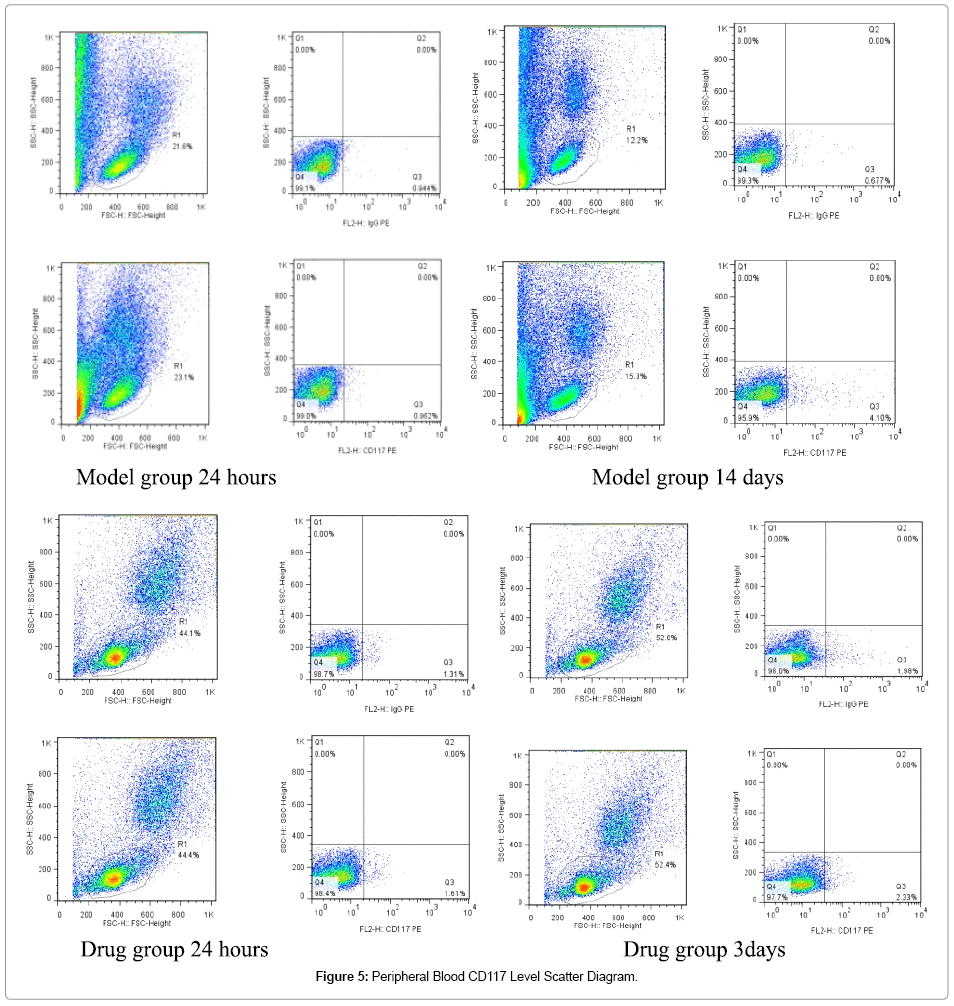
Figure 5: Peripheral Blood CD117 Level Scatter Diagram.
| Group | 1d | 3d | 7d | 14d | 28d |
|---|---|---|---|---|---|
| Normal | 1.51±0.16 | 1.55±0.13 | 1.51±0.12 | 1.58±0.17 | 1.54±0.56 |
| Model | 1.89±0.14Δ | 2.86±0.30Δ | 4.27±0.32Δ | 4.71±0.28Δ | 1.64±0.53Δ |
| High-dose | 2.99±0.86* | 4.54±0.34* | 6.53±0.37* | 7.32±0.29* | 2.68±0.16* |
| Mid-dose | 2.69±0.56* | 3.99±0.13* | 5.59±0.34* | 6.21±0.55* | 2.32±0.28* |
| Low-dose | 1.98±0.16 | 2.91±0.40 | 4.39±0.81 | 4.75±0.92 | 1.74±0.69 |
Note: Peripheral blood CD117 levels in model group at each time points was significantly higher than that in normal group (P<0.05). Peripheral blood CD117 levels at different time points in high and mid-dose groups was lower than that in model group with the most obvious data on the 14th day (P<0.05).
Table 7: CD117 Level in Peripheral Blood after MCAO between Groups ( x ± s,N=8)
Changes of CD117 level in bone marrow at different time points
Bone marrow CD117 levels in model group and drug groups were significantly higher than that in normal group (P<0.05). The CD117 levels in each group started to increase from the 1st day and reached its peak in 14 days and then reduced gradually afterwards. The rising trends of bone marrow CD117 level in mid and high-dose group were better than that in model group with significant difference (P<0.05). No statistical difference was found between low-dose group and model group at each time points (P>0.05) (Table 8 and Figure 6).
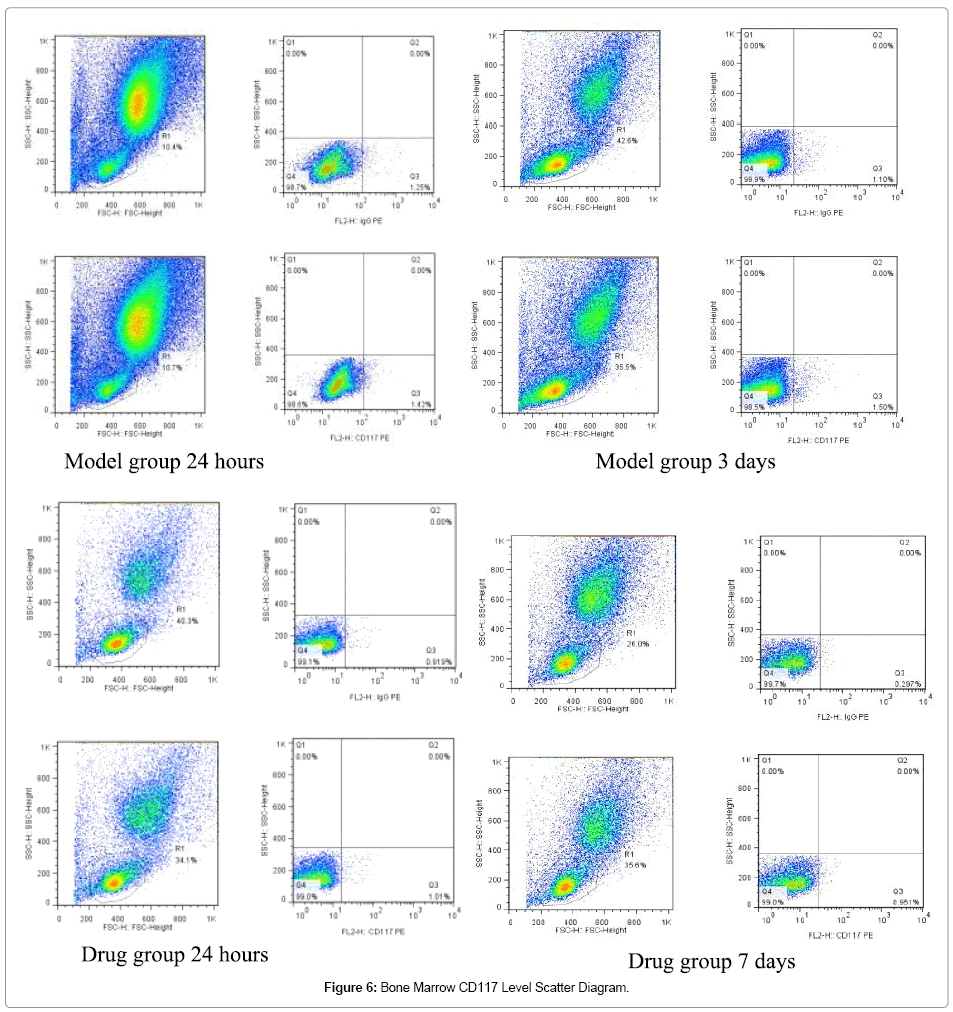
Figure 6: Bone Marrow CD117 Level Scatter Diagram.
| Group | 1d | 3d | 7d | 14d | 28d |
|---|---|---|---|---|---|
| Normal | 1.87 ±0.26 | 1.87±0.26 | 1.72±0.23 | 1.87±0.26 | 1.72±0.23 |
| Model | 2.17±0.23Δ | 2.37±0.53Δ | 3.37±0.31Δ | 4.43±0.22Δ | 1.97±0.33Δ |
| High-dose | 3.57±0.43* | 4.27±0.49* | 5.37±0.24* | 6.18±0.49* | 3.17±0.42* |
| Mid-dose | 2.79±0.82* | 3.62±0.37* | 4.02±0.36* | 5.42±0.25* | 2.59±0.31* |
| Low-dose | 2.09±0.12 | 2.45±0.12 | 3.47±0.26 | 4.66±0.72 | 2.17±0.43 |
Note: Bone marrow CD117 levels in model group at each time points was significantly higher than that in normal group (P<0.05).Bone marrow CD117 levels at each time point in high and mid-dose groups was higher than that in model group with the most obvious data on the 14th day (P<0.05).
Table 8: CD117 Level in Bone Marrow after MCAO between Groups ( x ± s,N=8).
The therapy of mobilization of stem cells is based on the rerecognition of adult stem cell growth potential and stem cell cycle theory. The agents of mobilization multiply and drive the stem cells from bone marrow pool to circulating pool and then enable the stem cells to enter the blood circulation through the basilar membrane and vascular endothelium. However, there are three problems to be solved: The percentage of homing BMSCs that stimulated to differentiate into specific neurons is very low, which is not enough to repair the function; the survive rate of homing BMSCs in the infarct area is low. Most of homing BMSCs died within 7 days due to the lack of blood supply and sufficient nutrition in the infarct area. Thus a valid way to stimulate the neovascularization in the infarct area and improve the survival rate of BMSCs is needed; Homing BMSCs are lack in number. One of the key to improve the function repair is to boost the stem cells into peripheral blood and drive them into injured sites [6-8].
Recently multiple factors were discovered involving with the mobilization of BMSCs such as chemotactic factor (CF), growth factor and adhesion molecule. Besides, tissue damage and external causes such as drugs interference with the process. Among which the stem cell factor (SCF) was considered one of the most powerful agent of mobilization. It can enlarge the stem cell to be driven into peripheral blood in dozens of times and play an important part in migration, accumulation and multiplication of the stem cells [9-11]. Adhesion molecules such as CD106 and CD54 are common surface receptors on the BMSCs that mediate the adhesion of the hematopoietic cell and played an important role in information transmission between two. Wang Xiao Xiang [12] has discovered an obvious rise of serum CD106 and CD54 in ACI patient and the difference remains significant in recovery phase compared with control group. In addition, a positively correlation was found between the degree of CD106 and CD54 increase and the size of infarcts. It was also reported that progresses of TCM herbs therapy has proven to be useful on the mobilization of stem cells homing process. Wang Chang [13] and his fellows observed the effect of astragaloside on temporary forebrain ischemia modeled rats and discovered that after 7 days of treatment, the hippocampal 5-bromo- 2-deoxyuridine (BrdU) positive cells and BrdU/GFAP+ cells were increased. A significant increase of BrdU/MAP- 2 double positive cells was observed after 14 days of treatment. Li Yong Hua [14] used components of Yangxin Tongmai Prescription to mobilize the BMSCs of rats with acute myocardial infarction(MI) and the results shows that compared with control group, a significant increase of CD34+ cells in peripheral blood in drug groups was found and the CD34+ cells in the cytoplasm of edge area of MI was also increased. The research shows that the components of Yangxin Tongmai Prescription could mobilize the BMSCs into blood and guild them to infarcted myocardium. Another research [15] has proved accessibility of Xuesaitong Injection therapy to treat acute infarction with the combination of Western medicine. The effects of BMSCs mobilization and attenuated synergistic were proved.
Our research shows that compared to normal group, SCF levels in other 4 groups in peripheral blood were significantly higher. Blood SCF level in model groups began to increase from the 1st day and reached peak at the 14th day, and gradually reduced thereafter. The rising trends of blood SCF level in mid-dose group and high-dose group were better than that in the model group (P<0.05). Such results indicate that the panax notoginseng saponins (PNS) can stimulate the production of SCF from bone marrow and has a synergy effect of BMSCs mobilization into peripheral blood. Compared to the normal group, a significant increase of CD54, CD106, CD105 and CD117 in drug groups and model group was observed (P<0.05) CD54, CD106, CD105 and CD117 levels in model group and drug groups increased to peak in one day and reduced gradually thereafter. The expression of CD54, CD106, CD105 and CD117 at different time points in mid and high-dose groups were significantly lower than that in model group with the most obvious reduction in high-dose group (P<0.05). No statistical difference was found between low-dose group and model group at different time points (P>0.05). Peripheral blood and bone marrow CD105 and CD117 levels in model group and drug groups started to increase from the 1st day and reached its peak at the 14th day, which indicates that the wounded body can mobilize stem cells spontaneously after injury. Yet the mobilization effect was too low to meet the needs of damage repair. The rising trends of blood and bone marrow CD105 CD117 level in mid and high-dose group were significantly higher than that in model group. Thus it proves that the PNS stimulated the production of CD105 and CD117 in the bone marrow and played an important role in the mobilization of CD105 and Cd117 into peripheral blood.
By reducing the adhesion effects of adhesion molecules on bone marrow stem cells, the PNS enhanced the mobilization effects of BMSCs from bone marrow into peripheral blood and provide a favorable environment in the blood. Such phenomenon supports the TCM theory of “promoting blood circulation to remove blood stasis” in the level of “promoting tissue regeneration” [16-18].
